Chapter 3
Development of Epitope-Targeting Protein Catalyzed Capture Agents Against Histidine Rich Protein II
This work described herein is unpublished work that was part of a concerted group effort to develop PCCs against the unstructured protein Histidine rich protein II (HRP2), which is a unique biomarker for Plasmodium falciparum malaria. These unpublished results (gathered from October 2014 to July 2015) focused on the medicinal chemistry optimization of several hits, and an initial push to develop biligand PCCs. The best ligands (described in JingXin Liang’s thesis, 2018) were characterized for their ability to disrupt the Heme: HRP2 complex in vitro, and were found to be potent inhibitors.
Development of Epitope-Targeting Protein Catalyzed Capture Agents Against Histidine Rich Protein II Section 3.1-Introduction
Malarial infection is caused by the Plasmodium parasite, and is endemic in the developing regions of the world with warm, humid climates including Sub-Saharan Africa, Asia, and Central/South America. The most virulent form of malaria is called Plasmodium falciparum (Pf), and accounts for >90% of all malaria related fatalities.1 The natural product artemisinin is currently the best drug for treating malarial infections;2 however, resistance to artemisinin has begun to appear in South Asia. The growing resistance of Plasmodium parasites to anti-malarial drug treatments including the “gold standard” drug artemisinin underscores the need to develop new anti-malarial medicines ideally with a unique mechanism of action.
Histidine Rich Protein II (HRP2) is an attractive protein target for treating Plasmodium falciparum malarial infection. The parasites utilize the protein to sequester Heme, which is a toxic byproduct of hemoglobin catabolism. HRP2 binds Heme and catalyzes its polymerization into the non-toxic crystalline polymer Hemozoin. Chauhan and coworkers determined that HRP2 has two binding modes for Heme that are pH- dependent.3 Below pH=6, when the histidine (His) side chain is in its acidic form, the carboxylate side chains of aspartate (Asp) and glutamate (Glu) bind Heme, but, above pH=6, binding to the histidine side chain dominates. Chauhan also demonstrated that Heme polymerization is primarily catalyzed by the carboxylate-binding mode, which is consistent with HRP2 sequestration in the acidic food vacuoles of the parasite.3 Artemisinin’s mechanism of action inhibits Hemozoin formation by first covalently
binding to Heme before HRP2 complexes with the Art-Heme moiety.4–6 The Art-Heme complex cannot undergo polymerization, and consequently Heme builds up and eventually kills the Plasmodium parasite. An alternative mechanism to inhibit Hemozoin formation would involve binding to the HRP2 protein and preventing it from complexing with Heme molecules. As this is a novel inhibition pathway this could lead to new therapeutics that treat Pf malarial infection.
While an attractive target, HRP2 presents unusual challenges for developing molecules to bind HRP2 protein. First, the HRP2 sequence primarily consists of repeating sequences of three amino acids: alanine (A), aspartic acid (D), and histidine (H). This results in a very “sticky” polypeptide chain that lacks a defined 2°/3° structure. Consequently, HRP2 does not have any well-defined grooves or pockets that a small molecule could bind. Secondly, fourteen unique epitopes have been identified in HRP2 samples that appear in varying quantities across different
geographical regions (Table 3.1).7 The extensive variation in epitope prevalence in Table 3.2 highlights the unusual amount of sequence diversity in HRP2. This makes developing reagents to bind HRP2 in an epitope-targeted manner a challenge as targeting a single epitope could result in ineffective binding in geographic regions where that epitope is either absent or in low abundance.8
Table 3.1. The fourteen unique epitopes found in HRP2.
Code Repeat Sequence
1 AHHAHHVAD
2 AHHAHHAAD
3 AHHAHHAAY
4 AHA
5 AHHAAHHASD
6 AHHATD
7 AHHAAD
8 AYY
9 AHHAAAHHATD
10 AHHAAAHHATD
11 AHN
12 AHAAAHHEAATH
13 AHHASD
14 AHHAHHATD
However, PCC agents can be easily raised against a variety of epitopes in a target protein then linked together to form a biligand that can target multiple epitopes. This would mitigate issues with detecting HRP2 as a result of its sequence diversity; also, a multiligand would enhance the binding affinity through cooperativity to enable detection/inhibition of HRP2 at low physiological levels of HRP2 protein. The remainder of this chapter summarizes efforts to develop PCC agents against the HRP2 protein.
Section 3.2-Methods
93.2.1-Preparation of Peptides10
The peptides were prepared using standard Fmoc/tBu coupling procedures either by hand or using an automatic synthesizer. Macrocyclization occurred via a copper- catalyzed click reaction before simultaneous resin cleavage and global deprotection of side chains using a 95% trifluoroacetic acid (TFA) cleavage cocktail. Precipitation of the
Table 3.2. The prevalence of the different HRP2 epitopes in patient samples from endemic areas.
Taken from reference 8.
crude peptide into diethyl ether preceded purification using semi-preparative high- performance liquid chromatography (semi-prep HPLC). Fractions containing pure peptide were identified using matrix-assisted laser desorption ionization time-of-flight (MALDI-TOF) mass spectrometry and lyophilized (For characterization spectra see Figures A3B.1-A3B.37). The resulting powder was reconstituted in dimethyl sulfoxide (DMSO), quantified using Nanodrop, and stored at 4 °C until use.
3.2.2-Enzyme-Linked Immunosorbent Assay Analysis of Peptides
The overnight ELISA protocol commenced with immobilizing the biotinylated peptides and blank on a Neutravidin coated 96-well plate before blocking the plate (with 5% milk or 3% BSA) overnight at 4 °C. Protein incubation with a GST-tagged recombinant HRP2 protein also occurred for 7-8 hours at 4 °C before incubation with an anti-GST HRP-conjugated antibody (ab) at RT. The assay was developed for several minutes at RT using a TMB peroxidase development kit before quenching with 1 M H2SO4(aq) and immediately measuring the absorbance using a Flexstation 3 plate reader.
The data was double background corrected before graphing using Graphpad Prism 7.
The all-room temperature ELISA protocol mirrored the overnight ELISA protocol except that the blocking and protein incubation steps occurred at RT for two hours each.
The data was double background corrected as before and graphed using Graphpad Prism 7.
3.2.3-Linker Library Synthesis
Linker libraries were developed using either the anchor JXL1 or DNB. Linker synthesis occurred by an automated five cycle split and mix protocol using the amino acids pool Fmoc-D-Leu-OH, Fmoc-Gly-OH, Fmoc-D-Pro-OH, Fmoc-protected α-amino isobutyric acid (Fmoc-Aib-OH), or nothing. The resulting library had a variable linker
with between zero and five amino acids. A Boc-protected propargyl click handle was coupled on before global deprotection of all acidic protecting groups. Each library was stored in 0.05% (w/v) sodium azide in MQ H2O at 4 °C until use.
3.2.4-Linker Library Screen Pre-Clear
For the pre-clear step each library was split into three aliquots and screened individually against the following biotinylated ligands: JXL1 library DNB, N-term, and C-term ligands; DNB library JXL1, N-term, and C-term ligands. After swelling the library in 0.1% BSA binding buffer and blocking overnight with 1% BSA blocking buffer the library was incubated with one of the anchors for one hour at RT. Incubation with a mouse anti-biotin alkaline phosphatase-conjugated antibody preceded stripping with a high salt buffer over one hour and development with the BCIP/NBT development system for thirty minutes. The development reaction was quenched with 6 M hydrochloric acid and all dark purple beads were removed before decolorizing the remaining beads with NMP and stripping with 7.5 M guanidinium chloride (Guan•HCl), pH = 2.0.
3.2.5-Linker Library Product Screens
Each aliquot was swelled in binding buffer and blocked overnight with 1% BSA before incubating with recombinant HRP2 protein and the biotinylated ligand used in the pre-clear stage. Any non-covalently bound material was stripped from the beads using 7.5 M Guan•HCl, pH=2.0 for one hour and incubation with a high salt buffer for an additional hour. Development occurred in the same manner as the pre-clear, and the dark purple beads were picked out and sequenced using Edman degradation.
Section 3.3-Results and Discussion
3.3.1-Alanine Scan of Sequence Hits
Previous work performed in the Heath group included combinatorial click library
screens of several epitopes that are common in HRP2 samples: the shifted Type 2 epitope AHHAADAHH, the N-term epitope LHETDQAHVDD, the C-term epitope AHHATDAHHAAAHHEAATH, and the Type 6 epitope AHHATD. These screens yielded several dozen first generation hits. Each hit needed to be tested for binding to the full protein before the best binders were optimized to maximize their binding affinity. My research focused on optimizing the structures and identifying a best binder with three hits from the shifted type 2 epitope screen: YYQLL (hL1), YYYNV (hL2), and LGYYY (hL3).
The initial round of medicinal chemistry optimization involved mapping out the binding contributions of the residues of each peptide with alanine substituted variants.
Any alanine variants with dramatically different binding to HRP2 protein would have that position selected for further amino acid substitutions. Each alanine scan set was prepared
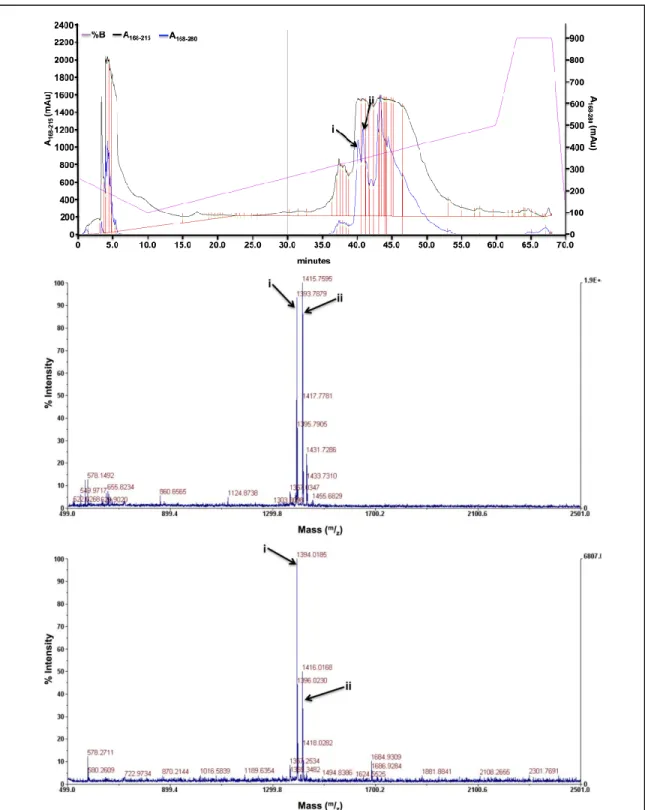
Figure 3.1. The single point ELISA results for each alanine scan set. The single point ELISA scans at 20 nM HRP2 protein for the three parent ligands a) hL1, b) hL2, and c) hL3. In the graphs the bottom dashed lines represent the background signal, and the top dashed lines represent the signal of the parent ligand.
(Table A3C.1) and evaluated against the parent ligand in a single point sandwich ELISA (Figure 3.1). The scan for ligand hL3 revealed that the tyrosine residues in positions 3-5 strongly bind HRP2. Swapping in structurally similar ligands at “intolerant” positions presents a unique opportunity to probe the non-covalent interactions involved in HRP2 binding while potentially improving affinity. Thus, the strongly intolerant residues of hL3 were also chosen for substitution.
3.3.2-Second-Generation Ligand Synthesis and Measurement of HRP2 Binding Affinity
The individual alanine scans yielded between one and four residues for substitution respectively, and the residues to be modified were Glycine (G), Tyrosine (Y), and Glutamine (Q). Each residue’s characteristics were analyzed to identify appropriate substitutions. For example, Gly lacks a side chain, and consequently does not impart any steric crowding to a peptide sequence; also, Gly makes the macrocyclic peptide ring more conformationally flexible at that position. An increase in HRP2 binding with the addition of a small, but sterically important methyl side chain in the Ala scan suggests that a more rigid ring could lead to an increase in binding affinity. Thus, Val was selected as an amino acid residue substitution for Gly. Tyrosine has an aromatic phenol chain whose hydroxyl group can accept and donate hydrogen bonds. Also, the hydroxy group uses resonance to increase the e- density of the aromatic ring overall. Exchanging the –OH group for a fluorine atom could result in stronger H-bonds with the His residues in HRP2.
Also, the small size and increased electronegativity of fluorine results in an electron- deficient aromatic ring. A reduction in electron density could increase the strength of anion-π interactions with the aspartate residues on HRP2. This effect could be enhanced with additional F on the same aromatic ring so both 4-fluorophenylalanine (4FF) and 3,4- difluorophenylalanine (3,4-FF) were chosen to replace Tyr. Glutamine is the uncharged
amide analogue of the charged amino acid glutamate (Glu). Exchanging an uncharged residue for an analogous charged residue could enhance the binding affinity with HRP2, due to more salt bridge interactions with HRP2. Thus, both Asp and Glu were chosen to replace Gln.
The second-generation ligand sets were prepared (Table A3C.2) and evaluated against the parent ligand as before (Figure 3.2). The Generation II hL1 single-point ELISA
revealed that exchanging the uncharged amide residue for a charged acidic residue did not result in any change in the binding affinity (Figure 3.2A). The His residues (pKa = 6.0) are uncharged in the binding buffer (pH = 7.4), so adding a residue that would encourage salt bridge interactions with the acidic form of His was not productive.
Figure 3.2. Testing the second-generation ligands. The 20 nM HRP2 single point ELISAs comparing the generation two ligands to a) hL1, b) hL2, and c) hL3. In the graphs the bottom dashed lines represent the background signal, and the top dashed lines represent the signal of the parent ligand. D.
The binding curve for the best performing second-generation ligand hL3V2 with an EC50 = 8.91 ± 2.5 nM.
Glutamine could also have been substituted with arginine (Arg), but since hL1 was the weakest binder of the three ligands studied, further modifications were not pursued. The Generation II hL2 ELISA (Figure 3.2B) did result in enhanced signal with the peptide hL2fF2, but as it was not as good a binder as the Y4FFYRV (JXL1 ligand) sequence developed by a coworker, this sequence was not subjected to further optimization. The ELISA for the second-generation hL3 ligands revealed that the addition of fluorinated analogues at the Tyr residues did not result in a significant increase of HRP2 binding (Figure 3.2C). This suggests that the cation-π interactions between the weakly charged His residues and the Tyr side chains play a strong role in hL3 binding HRP2. Tyr residues appearing in most of the original hits from the shifted Type 2 epitope click library screen further highlighted tyrosine’s significance. Surprisingly, the substitution of Gly for Val in ligand hL3V2 resulted in a dramatic increase in signal, which suggests that ring rigidity played a larger role in HRP2 binding affinity than previously expected. A full binding curve for hL3V2 was prepared, and it was found to have an EC50 of 8.91±2.5 nM (Figure 3.2D). The ligand hL3V2 was the only ligand carried onwards for further optimization.
3.3.3-Further Optimization of Ligand Hit hL3V2
The next round of optimization involved investigating the ideal ring size and closure for the macrocycle. The ligands to date have all been 27-atom macrocycles. A slightly larger macrocyclic ring could result in a binding pocket that better fits the shifted Type 2 HRP2 epitope. A ring-closing metathesis (RCM) ring closure, which gives a ring size of 33 atoms, is an unnatural ring closure that utilizes the non-canonical stapled peptides Fmoc-(S)-α-Me-2’-(7-octenyl)-alanine (Fmoc-Oct-OH) and Fmoc-(R)-α-Me-2’-(4- pentenyl)-alanine (Fmoc-Pen-OH).11,12 A pentameric peptide sequence that is ring closed
with stapled peptides does require adding a Gly residue to one end of the sequence in order to satisfy the i, i + 7 or i, i + 4 rule.13 As the RCM closure represents a change in ring flexibility, due to the introduction of quaternary centers and an increase in the hydrophobicity with the stapled peptide side chains, the RCM closure was chosen for ring size/closure optimization. A larger binding pocket could also spontaneously result from the click reaction used to close the macrocycle. The macrocyclic ring closure is the major product of the click reaction, but a side product can result from an intermolecular click reaction between two peptide sequences. The resulting ligand would possess two triazole closures for a ring size of 54 atoms (Figure A3B.38). The Type 2 epitope binder YKYYR (DNB ligand), which was identified by a colleague, had increased binding affinity for HRP2 in its dimer form.10 It has been shown in the literature that longer sequences favor intermolecular click reactions as a result of an increase in conformational flexibility.14 Adding a Gly residue to encourage dimerization also increases the triazole closed macrocyclic ring size up to 30 atoms, which would allow for testing if adding a conformationally flexible residue encouraged dimerization without depressing HRP2 binding affinity; also, the added Gly would provide a triazole analogue to compare to the RCM closed ligands. This comparison would determine whether the change in binding affinity was due to the larger ring size or to the change in macrocyclic ring closing. As a result the following isomers of the ring expanded and RCM-closed ligand variants of hL3V2 were prepared (Table A3C.3).
Although both the heterodimer and homodimer are possible side products of the RCM ring closing, only monomer was observed by MALDI-TOF analysis. Each ligand was isolated in multiple fractions, which results from the Grubbs I catalyst producing a
mixture of E/Z alkene isomers. The different ligand fractions were tested, and the best isomer was Ak-hL3G1V3 (Figure 3.3). This particular isomer has the stapled peptide with the shorter linker at the C-terminus and places the extra Gly residue away from the Tyr residues. The Tyr residues are heavily involved in binding HRP2, which suggests that optimal binding requires conformational rigidity near the residues that actively bind HRP2.
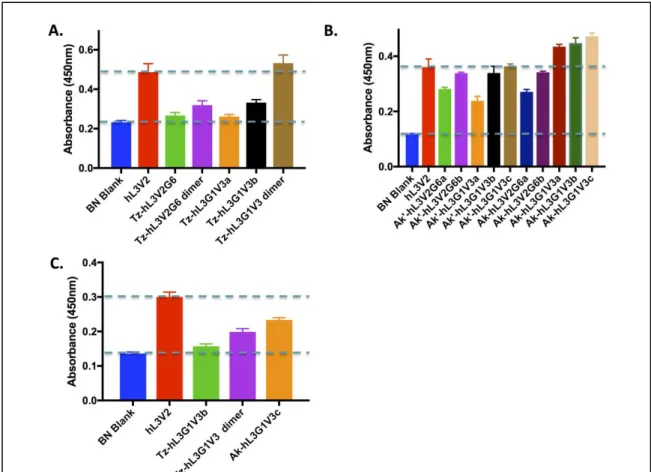
Preparing the ring-expanded triazole ligands did lead to the isolation of a significant amount of dimer in addition to the monomeric ligands. As expected, the dimeric ligands outperformed the monomeric ligands, likely as a result of cooperativity (Figure 4.3B).
Figure 3.3. Evaluating the stapled and ring expanded triazole ligands. Single point 20 nM HRP2 ELISAs. A. A comparison of the ring-expanded triazole-closed monomer and dimer with the parent ligand. B. A comparison of the RCM ligands with the parent ligand. C. Comparing the best ring- expanded triazole and RCM fractions with the parent ligand. In the graphs the bottom dashed lines represent the background signal, and the top dashed lines represent the signal of the parent ligand.
However, dimerizing the ring-expanded ligands did not result in a marked improvement compared to the parent ligand hL3V2. The drop in binding affinity, despite having two copies of the HRP2 binding sequence present, could result from the extra Gly residues.
Although having the Gly away from the active Tyr residues is preferred, the extra Gly may introduce enough conformational flexibility in the dimer’s ring to disfavor HRP2 binding. This suggests that small, conformationally rigid cycles are needed to bind HRP2 selectively. Directly comparing the best RCM ligand to the best ring-expanded triazole did show an increase in binding affinity for the RCM peptide, but overall both ligands behaved worse than the parent ligand hL3V2 (Figure 3.3C). This reinforced that, for targeting the shifted type 2 epitope, the original macrocycle ring size and ring closure was optimal.
3.3.4-Developing PCC Agent Biligands
Although the capture agents developed to bind select HRP2 epitopes have EC50 values in the 10-20 nM range, the best antibodies against HRP2 have much lower Kd values: 1 nM (C1-13 epitope, IgG antibody) and 160 pM (PTL3 epitope, IgM antibody).15 The difference in binding affinity between the antibodies and the much smaller capture agents can be explained by cooperativity. Improving the EC50 of the PCC agents further would require linking multiple copies of the cyclic peptides together. One such method would be to prepare a biligand composed of two monomeric PCC agents coupled through a spacer than can either be a flexible PEGn molecule or a rigid polypeptide linker. Thus, work was undergone collaboratively to identify the optimal amino acid spacer for linking together the best Type 2, shifted Type 2, N-term, and the C-terminal epitope targeting monoligands. Two linker libraries were prepared with the ligands JXL1 (EC50 = 538 pM) and DNB (type 2 epitope, EC50 = 218±44 nM) as anchors that were coupled to linkers
that were 0-5 amino acids in length. The amino acid pool for linker library split and mix synthesis was: glycine (G), D-proline (p), D-leucine (l), 2-amino isobutyric acid (Aib), or nothing. These linker libraries were individually screened against the following biotinylated ligands: DNB, JXL1, N-term (EC50 = 4 nM), and C-term (Figure 3.4).
The linker screens generated a total of 25 hits (Table A3C.4). Two of the hits (DNBvCtermH6 and DNBvCtermH8) were evaluated in a double-point ELISA against the monoligands and were found to outperform the anchors. The DNBCtermH8 biligand was found to have an EC50 = 540 pM, which represents a forty-fold increase over the EC50 value of the original DNB anchor.
At this stage the project leader wrapped up the HRP2 protein study by examining ligands’ ability to prevent complexation between free Heme and HRP2 protein. The functional study revealed that the N-term, DNB, and JXL1 ligands all inhibited the complexation, but that the JXL1-PEG-DNB biligand inhibited Heme: HRP2 complex formation even better than chloroquine, which is a commercially available malaria
Figure 3.4. Structure of the PCC anchors used in the linker study. The structures of the a) JXL1, b) DNB, c) C-term, and d) N-term PCC ligands screened against the JXL1 and DNB linker libraries.
prophylactic. The results of this functional study are summarized both in a recent publication under review16 and in JingXin Liang’s dissertation.
Section 3.4-Conclusion
In closing, this report disclosed efforts to optimize the library screen hits hL1, hL2, and hL3 to arrive at the ligand hL3V2. Further studies on changing macrocyclic ring closure and macrocyclic ring size revealed that low-conformational flexibility and a smaller ring size are optimal for binding the shifted Type 2 epitope AHHAADAHH. The best ligands discovered during the group effort to test and optimize all of the HRP2 epitope screen hits were tested for inhibition of the Heme: HRP2 complex and found to inhibit at a rate comparable to or better than chloroquine, a common anti-malarial.
Section 3.5-References
(1) WHO. WHO | Malaria http://www.who.int/mediacentre/factsheets/fs094/en/
(accessed Feb 21, 2018).
(2) Malaria Consortium. Malaria Consortium - Artemisinin-based Combination Therapy (ACT) (Pages) http://www.malariaconsortium.org/pages/112.htm (accessed Feb 21, 2018).
(3) Lynn, A.; Chandra, S.; Malhotra, P.; Chauhan, V. S. FEBS Lett. 1999, 459 (2), 267.
(4) Accardo, A.; Laurent, S. A.-L.; Mazarguil, H.; Meyer, M.; Robert, A.; Meunier, B.
J. Inorg. Biochem. 2007, 101, 1739.
(5) Pandey, A. V; Babbarwal, V. K.; Okoyeh, J. N.; Joshi, R. M.; Puri, S. K.; Singh, R.
L.; Chauhan, V. S. Biochem. Biophys. Res. Commun. 2003, 308 , 736.
(6) Kannan, R.; Sahal, D.; Chauhan, V. S. Chem. Biol. 2002, 9, 321.
(7) Baker, J.; McCarthy, J.; Gatton, M.; Kyle, D. E.; Belizario, V.; Luchavez, J.; Bell,
D.; Cheng, Q. J. Infect. Dis. 2005, 192, 870.
(8) Lee, N.; Baker, J.; Andrews, K. T.; Gatton, M. L.; Bell, D.; Cheng, Q.; McCarthy, J. J. Clin. Microbiol. 2006, 44, 2773.
(9) For detailed protocols of all experiments see the supporting information file.
(10) Das, S.; Nag, A.; Liang, J.; Bunck, D. N.; Umeda, A.; Farrow, B.; Coppock, M. B.;
Sarkes, D. A.; Finch, A. S.; Agnew, H. D.; Pitram, S.; Lai, B.; Yu, M. B.; Museth, A. K.; Deyle, K. M.; Lepe, B.; Rodriguez-Rivera, F. P.; McCarthy, A.; Alvarez- Villalonga, B.; Chen, A.; Heath, J.; Stratis-Cullum, D. N.; Heath, J. R. Angew.
Chemie Int. Ed. 2015, 54, 13219.
(11) Schafmeister, C. E.; Po, J.; Verdine, G. L. J. Am. Chem. Soc. 2000, 5891.
(12) Brik, A. Adv. Synth. Catal. 2008,1161.
(13) Blackwell, H. E.; Sadowsky, J. D.; Howard, R. J.; Sampson, J. N.; Chao, J. A.;
Steinmetz, W. E.; O’Leary, D. J.; Grubbs, R. H. J. Org. Chem. 2001, 66, 5291.
(14) Turner, R. A.; Oliver, A. G.; Lokey, R. S. Transform 2007, No. 13, 1.
(15) Kattenberg, J. H.; Versteeg, I.; Migchelsen, S. J.; González, I. J.; Perkins, M. D.;
Mens, P. F.; Schallig, H. D. F. H. MAbs 2012, 4, 120.
Appendix 3A
Materials and Experimental Procedures
Table of Contents
Materials 115
Methods
General Procedures for the Preparation of Ligands 118
Overnight ELISA Procedure 121
Room Temperature ELISA Procedure 122
Linker Library Pre-Clear 123
Linker Library Product Screen 125
References 125
Materials
Unless otherwise stated all chemicals were used as received.
Peptide Synthesis
The 9-Fluorenylmethoxycarbonyl (Fmoc) and t-butyl carboxy (Boc) protected amino acids were purchased from Anaspec, AAPTec, Bachem, ChemPep, and Sigma-Aldrich.
The Fmoc-protected stapled amino acids Fmoc-(S)-2-(7-octenyl) Ala-OH and Fmoc-(R)- 2-(pentenyl) Ala-OH used to prepare the RCM-closed peptides were purchased from Sigma Aldrich. Biotin NovaTag™ resin was obtained from EMD Chemicals, Inc. and used for synthesis of biotinylated peptides. The Seiber amide resin used for the synthesis of protected peptide fragments and the Rink Amide MHBA Resin used for the preparation of C-term amide peptides were purchased from AAPPTec. The peptide one- bead-one compound (OBOC) library was prepared on Tentagel Resin purchased from RAPP Polymere. The Fmoc-protected propionic acid polyethylene glycol (PEGn) linkers were purchased from ChemPep Inc. The L-Ascorbic Acid and copper (I) iodide (CuI) used for click reactions were purchased from Sigma Aldrich. The N-methyl pyrrolidine (NMP), 1-[Bis (dimethylamino) methylene]-1H-1, 2, 3-triazolo[4,5-b]pyridinium 3-oxid hexafluorophosphate (HATU), N, N’-dimethyl formamide (DMF), and N, N’- diisopropylethylamine (DIPEA) used in peptide synthesis were bought from EMD Chemicals, Inc., ChemPep, and Sigma-Aldrich respectively. The piperidine used for the removal of Fmoc protecting groups was purchased from Sigma-Aldrich. The Hydrazine (60 (% (v/v) in H2O) and 2-azido acetic acid used for the deprotection of 1-(4,4-dimethyl- 2,6-dioxocyclohex-1-ylidene)-3-ethyl (Dde) protecting groups and formation of Az4’
groups were purchased from Sigma Aldrich. The Benzylidene-bis
(tricyclohexylphosphine)-dichlororuthenium (Grubbs I) catalyst and 1,2-dichloroethane (DCE) used for the preparation of stapled peptides were purchased from Fischer Scientific.
Peptide Isolation and Purification
The trifluoroacetic acid (TFA), and triethylsilane (TESH) used for the cleavage of peptides from resin and global deprotection of side chains were purchased from Sigma- Aldrich. The diethyl ether used to precipitate crude peptide was purchased from JT Baker.
The Omnisolv grade acetonitrile (MeCN) used for peptide purification was purchased from EMD Millipore. Unless otherwise stated, peptide preparation was performed using a Titan 357 Automatic Peptide Synthesizer (AAPPTec, Louisville, KY). Mass analysis was performed using a Voyager De-Pro matrix assisted laser desorption ionization time-of- flight mass spectrometer (MALDI-TOF MS) (Applied Biosystems, California). The crude peptides were dissolved in either DMSO (Sigma Aldrich) or (1:1) MeCN/doubly distilled water (MQ H2O) w/ 0.1% TFA before purification by a gradient of 0% to 50%
acetonitrile in MQ H2O with 0.01% (v/v) TFA using a RP-HPLC (Beckman Coulter System Gold 126 Solvent Module and 168 Detector) using a C18 reversed phase semi- preparative column (Phenomenex Luna 10 µm, 250 × 10 mm). The concentration of peptides was determined using a Nanodrop 2000 Spectrophotomer (ThermoFischer Scientific Inc., Massachusetts).
ELISA Analysis of Peptides
The bovine serum albumin (BSA) and nonfat milk powder used in ELISAs was purchased from Sigma-Aldrich and Best Value respectively. The Glutathione S- transferase (GST)-labeled recombinant P. falciparum antigen HRP2 protein that was used
in the ELISAs was purchased from CTK Biotech Inc. The anti-GST HRP-conjugated antibody (ab58626) was purchased from Abcam. The ELISAs were run on either 96-well clear Pierce Neutravidin Plates (#15129) or Pierce Neutravidin Coated Plates (#15127) purchased from ThermoFischer Scientific. The tris (hydroxymethyl) aminomethane hydrochloride salt (Tris•HCl), sodium chloride, and magnesium chloride pentahydrate (MgCl2•5H2O) used to prepare the Tris buffer were purchased from Sigma Aldrich. The surfactant polysorbate 20 (Tween20) was purchased from Sigma Aldrich. The TMB Microwell Peroxidase Substrate System B (#50-76-00) that was used to develop ELISAs was purchased from KPL. The sulfuric acid (H2SO4(aq)) used to quench the enzymatic amplification reaction in the ELISAs was purchased from JT Baker. The 96-well ELISA plates were read using a Flexstation 3 plate reader (Molecular Devices LLC, Sunnyvale, CA).
Linker Library Screens
The recombinant, unlabeled HRP2 protein used for the linker screens was a generous gift from the Program for Appropriate Technology in Health (PATH). The mouse anti- biotin-alkaline phosphatase conjugated antibody (ab) (#A6561) pre-clear and the subsequent product screens were purchased from Sigma Aldrich. The combined 5- bromo-4-chloro-3-indoyl phosphate (BCIP)/ nitro blue tetrazolium (NBT) (#S3771) used to develop hits during the library screens was purchased from Promega. The concentrated hydrochloric acid used to quench the BCIP/NBT development was purchased from Sigma Aldrich. The methanol (MeOH) used to rinse the library beads was purchased from EMD Millipore. The guanidinium chloride (Guan•HCl) used to strip library beads was purchased from Sigma Aldrich. The sodium azide preservative was purchased from
Sigma Aldrich. Sequencing of bead hits occurred via Edman degradation sequencing on a Procise Protein Sequencer (Applied Biosystems, California).
Methods
General Procedures for the Preparation of Ligands
Preparation of Resin for Coupling
Novatag Biotin Resin (0.44 mmol amine/g, 300 mg, 0.132 mmol)was placed into a 8mL solid-phase peptide synthesis (SPPS) tube fitted with a stopcock and swelled in 4mL of NMP for a minimum of two hours.
Hand Deprotection of Fmoc Protecting Group
The resin was incubated with 4mL portions of Piperidine (20% (v/v) in NMP) for 2 min, 5 min, and 25 min before rinsing with NMP (5x).
Peptide Hand Couplings
The appropriate Fmoc-protected amino acid (2.00-4.00 equiv.) was added directly to the SPPS tube with HATU (2.00-4.00 equiv.). After solubilizing the coupling reagents in NMP, the solution was charged with DIPEA (6.00-12.0 equiv.) and allowed to react on a peptide shaker at room temperature (35 min → overnight) before washing with NMP (5x).
Titan Synthesis
Automated synthesis of the 5-mer and alkyne click handle was conducted on the Titan 357 Automatic Peptide Synthesizer. Wells were charged with 50mg each of Novatag resin following Fmoc-Az4-OH coupling. Titan synthesis prepared the peptides in a linear fashion: Fmoc-NH-Pra-X1X2X3X4X5-Az4-PEG5-Resin.
Click Reaction
The click reaction solution for each ligand (50mg, 0.0220 mmol) was prepared as a solution in 3mL of Piperidine (20% (v/v) in NMP): CuI (8.4 mg, 0.0440 mmol) and L- ascorbic acid (19.4 mg, 0.110 mmol). The solution was added to the resin and allowed to cyclize overnight with shaking at room temperature. A solution of click wash was prepared immediately before use: DIPEA (5% (v/v)) and sodium diethyl dithiocarbonate (5% (w/v)) in NMP. After draining the SPPS tube the resin was rinsed with click wash (3x), and incubated with click wash for ten minutes before rinsing with NMP (5x).
Ring-Closing Metathesis of Macrocyclic Peptide Ring
The resin (200 mg, 0.0880 mmol) was rinsed with DCM (5x) and left to dry for a minimum of one hour before reswelling in 1,2-DCE (4 mL) for one hour. An oven-dried 2-neck round-bottom flask (RBF) under Ar(g) was charged with the resin solution and degassed for thirty minutes. Grubbs I catalyst (50 mg) was added quickly and the reaction was left to stir until the solution went from purple to red-brown (about six hours). The solution was placed into an SPPS tube, drained, charged with fresh Grubbs I catalyst (50 mg) in 1,2-DCE (4 mL), and returned to the RBF under Ar(g) for another six hours. The resin was collected into an SPPS tube and rinsed with DCM until the washes were clear and colorless before adding 3 mL click wash for five-minute washes until the drained liquid came back colorless. The resin was Fmoc-deprotected (3 x 20 minutes) prior to cleavage from resin. The first coupling reaction after the RCM was run overnight to prevent incomplete formation of the amide bond due to Grubbs I catalyst interference.
MTT Deprotection
Prior to an MTT deprotection the resin was washed with DCM (3x). Deprotection occurred with washes of 2% TFA in DCM (5 mL, 9 times) until the drained solvent went
from bright yellow to colorless. The resin was washed with DCM (5x) then NMP (5x), and reswelled in NMP for at least thirty minutes before further manipulation.
Dde Deprotection and Formation of Az4’ Group
The Dde group was removed by incubating with Hydrazine (2 % (v/v) in DMF) (5 mL x 10 minutes) three times before rinsing with DMF (5x). The resin was then reacted with 2-azido acetic acid using the standard hand coupling procedure for a minimum of two hours (with regular venting for the first thirty minutes of shaking) and worked up by rinsing with NMP (5x).
Seiber Amide Resin Deprotection to Isolate Fully Protected Peptides
The resin (3.00 g, 2.01 mmol) was rinsed with DCM (5x), and dried under vacuum for a minimum of one hour. The resin was then washed with TFA (1% (v/v) in DCM) (25 mL x 1 minute once and 10 mL x 1 minute, 10 times) draining into a RBF containing 5mL of DIPEA to neutralize the solution. An additional 1 mL of DIPEA was added to the flask before isolating the crude protein by rotary evaporation and purifying by prep-scale HPLC, identification of pure protected peptides using electrospray ionization mass spectrometry (ESI-MS), and lyophilization of desired fractions.
Resin Cleavage, Global Side-Chain Deprotection, and Purification of Crude Peptide The resin was rinsed with DCM (5x) and dried under vacuum for a minimum of one hour. A 20 mL scintillation vial was charged with a stir-bar, resin and cleavage solution (95% TFA, 2.5% TESH, 2.5% MQ H2O) before stirring at room temperature for 2 hours.
The solution was then filtered into 40 mL of cold ether, vortexed briefly, and stored at 4 °C overnight. The precipitated protein was centrifuged into a pellet (4500 RPM, 10 minutes @ 4 °C) prior to decantation of the supernatant. After dissolving the crude
peptide in DMSO purification occurred by a gradient of 0% to 50% acetonitrile in water with 0.01% (v/v) TFA using an RP-HPLC (Beckman Coulter System Gold 126 Solvent Module and 168 Detector) using a C18 reversed phase semi-preparative column (Phenomenex Luna 10 µm, 250 × 10 mm), identification of pure peptide using MALDI- TOF mass spectrometry, and lyophilization of desired fractions.
Linker Library Synthesis
The peptide anchors DNB and JXL1 were synthesized on Tentagel resin and cyclized before a split and mix coupling of the linker library on Titan occurred. Each library was split into five wells and couple with Fmoc-D-Pro-OH, Fmoc-Gly-OH, Fmoc-D-Leu-OH, Fmoc-2-aminoisobutyric acid (Fmoc-Aib-OH), or nothing. Recombination of the resin preceded washing and Fmoc deprotection before repeating for an additional four cycles to get a linker library with a variable 0 to 5 amino acids linker length. A final coupling with Boc-Pra-OH preceded global deprotection of side chains with cleavage cocktail (95%
TFA, 2.5% TESH, 2.5% H2O) and storage under 0.05% sodium azide in water at 4 °C.
Overnight ELISA Procedure
Binding Buffer: TBS + 0.05% Tween20 + 0.1% BSA Blocking Buffer: TBS + 5-7% milk + 0.05% Tween20 All washing steps were 200μL/well
All incubation steps were 100μL/well except for the blocking step, which was 200μL/well
Prior to incubating with the blank and ligands the 96 well plate was washed with binding buffer (3 x 5 minutes). The wells were then loaded with 100 μL of either 0.5% (v/v) DMSO/ Biotin-PEG5 linker (2 μM in binding buffer) or biotinylated ligand (2 μM in binding buffer), and the plate was incubated at RT for two hours. The washing step was
repeated before adding blocking solution and the plate was incubated for 12-14 hours in the cold room. After washing the plate in the cold room, each well was charged with either binding buffer or HRP2 protein (20-40 nM in binding buffer), and the plate was left to incubate in the cold room for 7-8 hours. Unbound protein was washed away at room temperature before each well was charged with the anti-GST HRP-conjugated antibody (2000:1 dilution in binding buffer) before incubating at RT for one hour. The plate was then washed with binding buffer (3 x 5 minutes) then with TBS buffer (1 x 5 minutes) before adding developing solution (1:1 TMB Peroxidase Substrate: Peroxidase Substrate Solution B) and agitating until a blue color began to appear. Approximately five minutes after the initial appearance of color the reaction was quenched with 100 μL of 1M H2SO4(aq) at which point the color changed from blue to golden yellow. The absorbance was measured immediately at λ = 450nM, background corrected, and subsequently plotted in Graphpad.
A similar procedure to the above was utilized to prepare the LVYYY binding curve with the exceptions that the ligand was immobilized at a 200 nM concentration, and the plate was blocked with 3% BSA.
The cocktail ELISA experiments were run using a similar experimental protocol with the exception that the blank used was Biotin-Gly-NHAc and the plate was blocked with 3% BSA.
Room-Temperature ELISA Procedure1
Binding Buffer: PBS + 0.05% Tween20
Blocking Buffer: PBS + 2% BSA+ 0.05% Tween20 All washing steps were 200μL/well
All incubation steps were 100μL/well except for the blocking step, which was 200μL/well
Prior to incubating with the biotinylated blank and ligands the 96 well plate was washed with binding buffer (3 x 5minutes). The wells were then loaded with 100 mL of either Biotin-PEG5-NH2 (blank) (2 μM in binding buffer) or biotinylated ligand (2 μM in binding buffer) and the plate incubated with shaking at RT for two hours. The washing step was repeated before adding blocking solution and incubating with shaking for two hours at room temperature. After washing the plate, each well was charged with either binding buffer or a HRP2 protein solution (1-5 nM in binding buffer) and the plate was left to incubate at room temperature for two hours. Unbound protein was washed away at room temperature before each well was charged with the anti-GST HRP Antibody (2000:1 dilution in binding buffer), and the plate was incubated at RT for one hour. The plate was then washed with binding buffer (3 x 5 minutes) and PBS (1 x 5 minutes) before adding 100 μL of the developing solution (1:1 TMB Peroxidase Substrate:
Peroxidase Substrate Solution B) and agitated until a blue color began to appear.
Approximately five to ten minutes after the initial appearance of color the reaction was quenched with 100 μL of 1 M H2SO4(aq) at which point the color changes from blue to golden yellow. The absorbance was measured immediately at λ = 450nM, and subsequently plotted in Graphpad.
Linker Library Screens
The procedures described herein are a modification of the procedures given in reference 10 of the main text.
Linker Library Pre-Clear
Each anchor library was split into three aliquots and pre-cleared separately. Each aliquot was rinsed with MeOH (5x), MQ H2O (10x), and swelled in 500 μL of binding buffer (0.1% BSA, 0.1% Tween 20 in TBS) @ RT for three hours. The library aliquots were then mixed with 500 μL blocking buffer (1% BSA, 0.1% Tween 20 in TBS) and left to shake at 4 °C overnight. After draining and rinsing with 500 μL binding buffer the library was incubated for four hours @ RT with 500 μL of binding buffer containing 5 μM of one of the biotinylated ligands: JXL library DNB, C-term, or N-term; DNB Library JXL1, C-term, or N-term. The beads were then rinsed with binding buffer (3 x 500 μL) before incubation with 500 μL binding buffer containing a 10,000:1 dilution of the mouse anti-biotin conj. alkaline phosphatase antibody for one hour @ RT. Rinses with binding buffer (3 x 500 μL), TBS (1 x 500 μL) preceded incubations with a high salt (25 mM Tris•HCl, 10 mM MgCl2, 700 mM NaCl, pH = 7.4) TBS buffer @ RT (500 μL, 3 x 20 minutes). The beads were then rinsed with BCIP Buffer (3 x 500 μL) and dried under vacuum for eight minutes before transferring to a petri dish. The beads were developed with 13 μL of BCIP (50 mg/mL in 70% DMF) in 10mL of developing buffer (100 mM Tris•HCl, 150 mM NaCl, 1 mM MgCl2, pH=xx) and incubated with the library beads in a 20cm petri dish for ten minutes before adding 26 μL of NBT (50 mg/mL in 70%
DMF) and incubating for an additional thirty minutes. The development was quenched with 100 μL of 6 M HCl(aq) and the dark purple beads that represent promiscuous binders to the biotinylated ligand were removed using a 10 μL micropipette. Each individual library aliquot was prepared for a subsequent product screen by rinsing with NMP (5x), decolorizing with NMP overnight, rinsing with MeOH (5x), MQ H2O (10x), and stripping with 7.5 M Gua • HCl, pH = 2 for thirty minutes @ RT.
Linker Library Product Screens
The aliquots were screened individually against the ligand with which they had been pre-cleared. Each library aliquot was swelled in binding buffer for four hours @ RT before rinsing with binding buffer (10 x 500 μL) and incubating with 500 μL blocking buffer overnight at 4 °C. The beads were then incubated with 100 nM rHRP2 and 5μM of one of the following: N-term, C-term, JXL1, or DNB ligand in 500 μL binding buffer @ RT for six hours. After a quick rinse with binding buffer (500 μL), the beads were stripped with 500 μL of 7.5M Guan·HCl, pH=2.0 @ RT for one hour. A second overnight block with 500 μL of blocking buffer @ 4 °C preceded incubation with a 10,000:1 dilution of mouse anti-biotin-alkaline phosphatase conj. Ab in 500 μL binding buffer for one hour @ RT. The beads were washed with binding buffer (3 x 500 μL), TBS, pΗ = 7.4 (3 x 500 μL) before incubating with high salt buffer (4 x 15 minutes).
Finally they were rinsed with TBS (3 x 500 μL) and BCIP Buffer (pH = 9, 3 x 500 μL), and dried under vacuum for one minute before development in a 20 cm petri dish with 26 μL BCIP, 13 μL NBT in 15 mL of BCIP buffer for thirty minutes. The development reaction was quenched with 100 μL 6 M HCl(aq), and the dark purple beads were picked with a 10 μL micropipette. The beads were placed individually into Spinex tubes and washed with 250 μL 7.5 M Guan•HCl, pH = 2.0, MQ H2O (5 x 250 μL), and stored in NaN3 (0.05 % (m/v)) in MQ H2O at 4 °C until ready to be sequenced.
References
(1) J. N. Waitumbi, J. Gerlach, I. Afonina, S. B. Anyona, J. N. Koros, J. Siangla, I.
Ankoudinova, M. Singhal, K. Watts, M. E. Polhemus, N. M. Vermeulen, W.
Mahoney, M. Steele and G. J. Domingo, Trop. Med. Int. Heal., 2011, 16, 786–793.
Appendix 3B
Supplemental Figures
Table of Contents
Figure A3B.1-37 Characterization spectra 127
Figure A3B.38-Structure of the spontaneously formed heterodimer
in the click reaction. 164
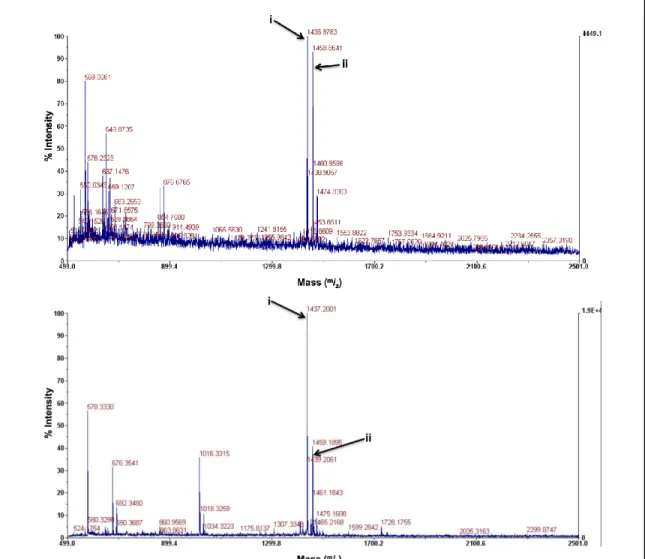
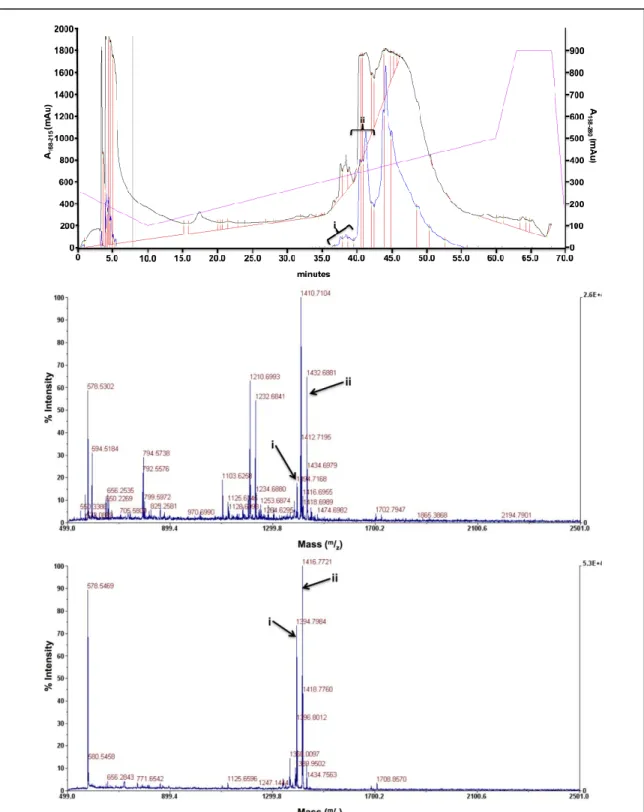
Figure A3B.1. Characterization spectra for ligand hL1A1. Ligand hL1A1: C65H106N16O17S. (Top) The HPLC trace for ligand hL1A1. The arrows correspond to the fractions with the correct mass.
(Middle) The MALDI-TOF spectra for the first fraction. The peak labeled “i” corresponds to the [M+H]
mass, expected [M+H]= 1416.677, and the peak labeled “ii” corresponds to the [M+Na] mass, expected [M+Na]= 1438.762. (Bottom) The MALDI-TOF spectra for the second fraction. The peak labeled “i”
corresponds to the [M+H] mass, and the peak labeled “ii” corresponds to the [M+Na] mass.
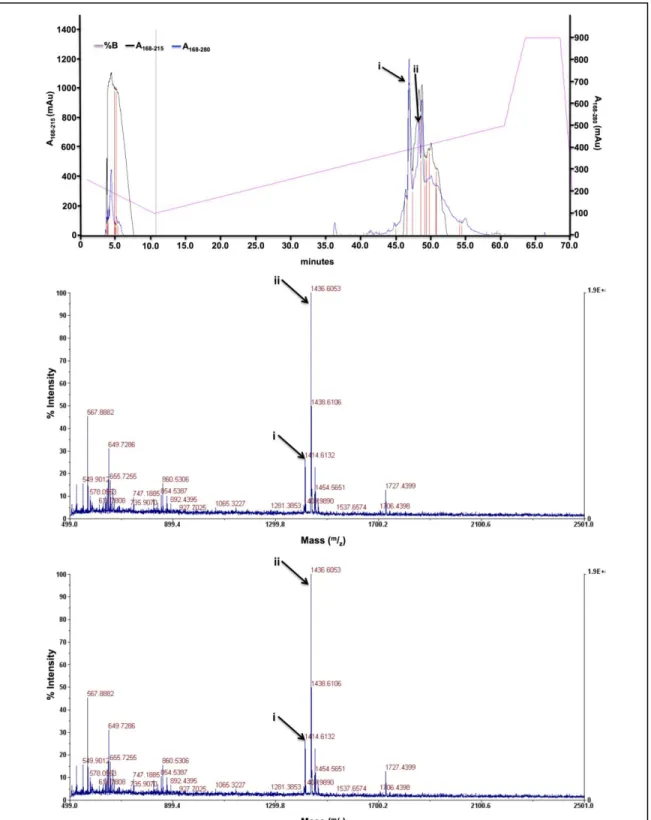
Figure A3B.2. Representative characterization spectra for ligand hL1A2. Ligand hL1A2 C65H106N16O17S. (Top) The HPLC trace for ligand hL1A2. The indicated regions correspond to fractions 1-4 that had the correct mass. (Middle and Bottom) The MALDI spectra for fractions 1 and 2 respectively. The peaks labeled “i” correspond to the [M+H] mass, expected [M+H] = 1416.677, and the peaks labeled “ii” correspond to the [M+Na] mass, expected [M+Na] = 1438.762.
Figure A3B.3. Representative characterization spectra for ligand hL1A3. Ligand hL1A3 C69H107N15O17S. (Top) The HPLC trace for ligand hL1A3. The indicated regions correspond to fractions 1-3 that had the correct mass. (Middle and Bottom) The MALDI spectra for fractions 1 and 2 respectively. The peaks labeled “i” correspond to the [M+H] mass, expected [M+H] = 1450.777, and the peaks labeled “ii” correspond to the [M+Na] mass, expected [M+Na] = 1472.759.
Figure A3B.4. Characterization spectra for ligand hL1A4. Ligand hL1A4 C68H104N16O18S. (Top) The HPLC trace for ligand hL1A4. The indicated regions correspond to the two fractions that had the correct mass. (Middle and Bottom) The MALDI spectra for fractions 1 and 2 respectively. The peaks labeled “i” correspond to the [M+H] peak, expected [M+H] = 1465.751, and the peaks labeled “ii”
correspond to the [M+Na] peak, expected [M+Na] = 1487.733.
Figure A3B.5. Representative characterization spectra for ligand hL1A5. Ligand hL1A5:
C68H104N16O18S. (Top) The HPLC trace for ligand hL1A5. The indicated regions correspond to the four fractions that had the correct mass. (Middle) The MALDI spectra for fraction 1. The peaks labeled
“i” correspond to the [M+H] peak, expected [M+H] = 1465.751, the peaks labeled “ii” correspond to the [M+Na] peak, expected [M+Na] = 1487.733, and the peak labeled “iii” corresponds to the [M+K]
peak, expected [M+K] = 1503.707. (Bottom) The MALDI spectra for fraction 2. The indicated peak corresponds to the [M+Na] peak.
Figure A3B.6. Characterization spectra for ligand hL2. Ligand hL2 C72H104N16O19S. (Top) The HPLC trace for ligand hL2. The indicated regions correspond to the two fractions that had the correct mass. (Middle) The MALDI spectra for fraction 1. The indicated peak corresponds to the [M+H] peak, expected [M+H] = 1530.765. (Bottom) The MALDI spectra for fraction 2. The peak labeled “i”
corresponds to the [M+H] peak, and the peak labeled “ii” corresponds to the [M+Na] peak, expected [M+Na]= 1552.747.
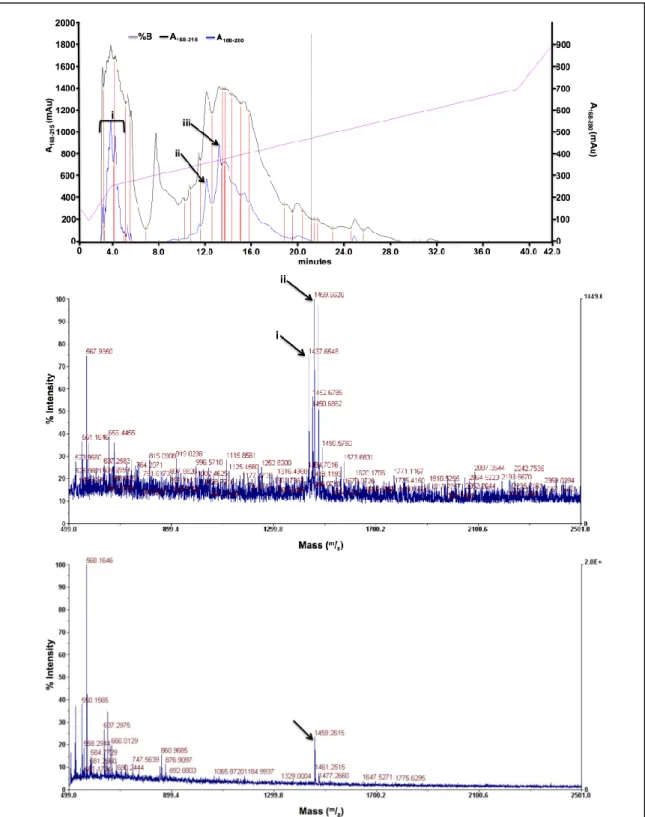
Figure A3B.7. Representative characterization spectra for ligand hL2A1. Ligand hL2A1 C66H100N16O18S. (Top) The HPLC trace for ligand hL2A1. The indicated regions correspond to the three fractions that had the correct mass. (Middle) The MALDI spectra for fraction 1. The peak labeled
“i” corresponds to the [M+H] peak, expected [M+H] = 1437.720, and the peak labeled “ii” corresponds to the [M+Na] peak, expected [M+Na]= 1459.702. (Bottom) The MALDI spectra for fraction 2. The indicated peak corresponds to the [M+Na] peak.
Figure A3B.8. MALDI for ligand hL2A2. Ligand hL2A2: C66H100N16O18S. The indicated peak corresponds to the [M+Na] peak, expected [M+Na] = 1459.702.
Figure A3B.9. MALDI spectra for ligand hL2A3. Ligand hL2A3: C66H100N16O18S. The MALDI spectra for fractions one and two of L2A3 respectively. The peaks labeled “i” correspond to the [M+H]
peak, expected [M+H] = 1437.720, and the peaks labeled “ii” correspond to the [M+Na] peak, expected [M+Na] = 1459.702.
Figure A3B.10. Characterization spectra for ligand hL2A4. Ligand hL2A4: C71H103N15O18S. (Top) The HPLC trace for ligand hL2A4. The indicated regions correspond to the two fractions that had the correct mass. (Middle, Bottom) The MALDI spectra for fraction 1 and fraction 2 respectively. The peaks labeled “i” corresponds to the [M+H] peak, expected [M+H]= 1486.740, and the peaks labeled
“ii” correspond to the [M+Na] peak, expected [M+Na]= 1508.722.
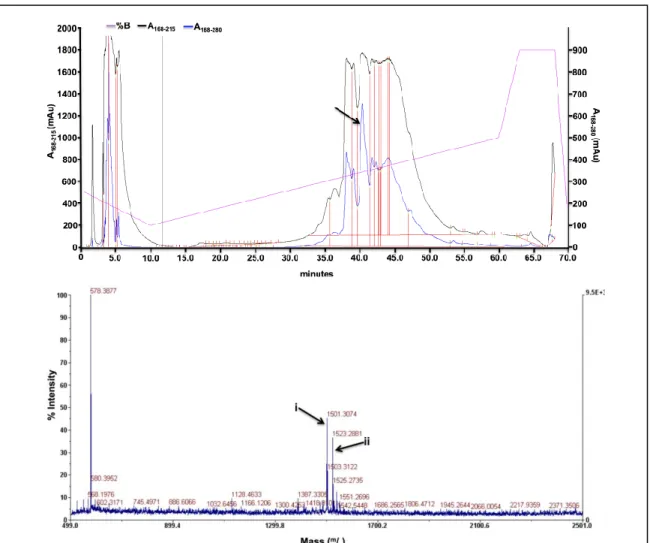
Figure A3B.11. Characterization spectra for ligand hL2A5. Ligand hL2A5 C70H100N16O19S. (Top) The HPLC trace for ligand hL2A5. The indicated regions correspond to the fraction that had the correct mass. (Bottom) The MALDI spectra for fraction 1. The peak labeled “i” corresponds to the [M+H]
peak, expected [M+H]= 1501.715, and the peak labeled “ii” corresponds to the [M+Na] peak, expected [M+Na]= 1523.697.
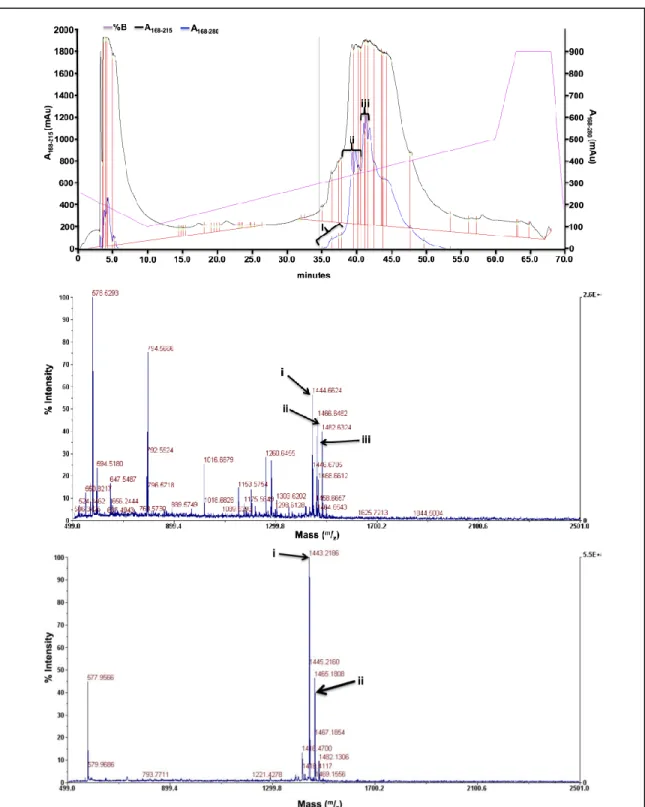
Figure A3B.12. Representative characterization spectra for ligand hL3A1. Ligand hL3A1:
C68H97N15O18S. (Top) The HPLC trace for ligand hL3A1. The indicated regions correspond to the three fractions that had the correct mass. (Middle) The MALDI spectra for fraction 1. The peaks labeled
“i” correspond to the [M+H] peak, expected [M+H] = 1444.693, the peaks labeled “ii” correspond to the [M+Na] peak, expected [M+Na] = 1466.675, and the peak labeled “iii” corresponds to the [M+K]
peak, expected [M+K] = 1482.649. (Bottom) The MALDI spectra for fraction 2. The peak labeled “i”
corresponds to the [M+H] peak, and the peak labeled “ii” corresponds to the [M+Na] peak.
Figure A3B.13. Representative characterization spectra for ligand hL3A2. Ligand hL3A2:
C72H105N15O18S r. (Top) The HPLC trace for ligand hL3A2. The indicated regions correspond to the two fractions that had the correct mass. (Middle, Bottom) The MALDI spectra for fraction 2 and fraction 3 respectively. The peak labeled “i” corresponds to the [M+H] peak, expected [M+H] = 1500.756 and the peak labeled “ii” corresponds to the [M+Na] peak, expected [M+Na] = 1522.738.
Figure A3B.14. Characterization spectra for ligand hL3A3. Ligand hL3A3: C65H99N15O17S. (Top) The HPLC trace for ligand hL3A3. The indicated regions correspond to the two fractions that had the correct mass. (Middle) The MALDI spectra for fraction 1. The peak labeled “i” corresponds to the [M+H] peak, expected [M+H] = 1394.714, the peak labeled “ii” corresponds to the [M+K] peak, expected [M+K] = 1432.670. (Bottom) The MALDI spectra for fraction 2. The peak labeled “i”
corresponds to the [M+H] peak, and the peak labeled “ii” corresponds to the [M+Na] peak, expected [M+Na] = 1416.696.
Figure A3B.15. Characterization spectra for ligand hL3A4. Ligand hL3A4: C65H99N15O17S. (Top) The HPLC trace for ligand hL3A4. The indicated regions correspond to the two fractions that had the correct mass. (Middle) The MALDI spectra for fraction 1. The peak labeled “i” corresponds to the [M+H] mass, expected [M+H] = 1394.714, and the peak labeled “ii” corresponds to the [M+Na] mass, expected [M+Na] = 1416.696. (Bottom) The MALDI spectra for fraction 2. The indicated peak corresponds to the [M+H] mass.
Figure A3B. 16. Characterization spectra for ligand hL3A5. Ligand hL3A5: C65H99N15O17S. (Top) The HPLC trace for ligand hL3A5. The indicated regions correspond to the two fractions that had the correct mass. (Middle, Bottom) The MALDI spectra for fraction 1 and fraction 2 respectively. The peak labeled “i” corresponds to the [M+H] peak, expected [M+H] = 1394.714, and the peak labeled “ii”
corresponds to the [M+Na] peak, expected [M+Na] = 1416.696.
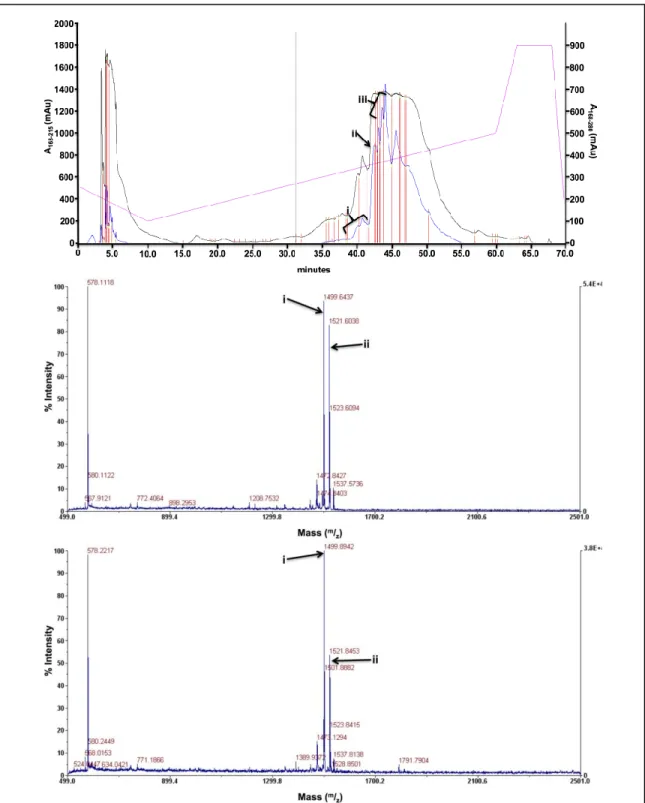
Figure A3B.17. Characterization spectra for ligand hL1D3. Ligand hL1D3: C70H107N15O19S. (Top) The HPLC trace for ligand hL1D3. The indicated regions correspond to the two fractions that had the correct mass. (Middle, Bottom) The MALDI spectra for fraction 1 and fraction 2 respectively. The peaks labeled “i” correspond to the [M+H] peak, expected [M+H] = 1494.767, the peaks labeled “ii”
correspond to the [M+Na] peak, expected [M+Na] = 1516.749, and the peaks labeled “iii” correspond to the [M+K] peak, expected [M+K] = 1532.723.
Figure A3B.18. Characterization spectra for hL1E3. Ligand hL1E3: C71H109N15O19S. (Top) The HPLC trace for ligand hL1E3. The indicated regions correspond to the fraction that had the correct mass. (Bottom) The MALDI spectra for ligand hL1E3. The indicated peak corresponds to the [M+H]
peak, expected [M+H] = 1509.787.
Figure A3B.19. Characterization spectra for ligand hL2fF1. Ligand hL2fF1: C72H103FN16O18S.
(Top) The HPLC trace for ligand hL2fF1. The indicated regions correspond to the two fractions that had the correct mass. (Middle, Bottom) The MALDI spectra for fraction 1 and fraction 2 respectively.
The peak labeled “i” corresponds to the [M+H] peak, expected [M+H]= 1531.742, and the peak labeled
“ii” corresponds to the [M+Na] peak, expected [M+Na] = 1553.724.
Figure A3B.20. Representative characterization spectra for ligand hL2f*F1. Ligand hL2f*F1 C72H102F2N16O18S. (Top) The HPLC trace for ligand hL2f*F1. The indicated regions correspond to the two fractions that had the correct mass. (Middle, Bottom) The MALDI spectra for fraction 2 and fraction 3 respectively. The peak labeled “i” corresponds to the [M+H] peak, expected [M+H]=
1549.733, and the peak labeled “ii” corresponds to the [M+Na] peak, expected [M+Na]= 1571.714.
Figure A3B.21. Characterization spectra for ligand hL2fF2. Ligand hL2fF2: C72H103FN16O18S.
(Top) The HPLC trace for ligand hL2fF2. The indicated regions correspond to the two fractions that had the correct mass. (Middle, Bottom) The MALDI spectra for fraction 1 and fraction 2 respectively.
The peaks labeled “i” correspond to the [M+H] peak, expected [M+H] = 1531.742, and the peaks labeled “ii” correspond to the [M+Na] peak, expected [M+Na] = 1553.724.
Figure A3B.22. Representative characterization spectra for ligand hL2f*F2. Ligand hL2f*F2:
C72H102F2N16O18S. (Top) The HPLC trace for ligand hL2f*F2. The indicated regions correspond to the two fractions that had the correct mass. (Middle) The MALDI spectra for fraction 2. The peak labeled
“i” corresponds to the [M+H] peak, expected [M+H] = 1549.733, and the peak labeled “ii” corresponds to the [M+Na] peak, expected [M+Na] = 1571.714. (Bottom) The MALDI spectra for fraction 3. The indicated peak corresponds to the [M+Na] peak.
Figure A3B.23. Characterization spectra for ligand hL3V2. Ligand hL3V2: C74H109N15O18S. (Top) The HPLC trace for ligand hL3V2. The indicated regions correspond to the fraction that had the correct mass. (Bottom) The MALDI spectra for fraction 1. The peak labeled “i” corresponds to the [M+H]
peak, expected [M+H] = 1528.787, and the peak labeled “ii” corresponds to the [M+Na] peak, expected [M+Na] = 1550.718.
Figure A3B.24. Characterization spectra for ligand hL3fF3. Ligand hL3fF3: C71H102FN15O17S.
(Top) The HPLC trace for ligand hL3fF3. The indicated regions correspond to the two fractions that had the correct mass. (Middle) The MALDI spectra for fraction 1. The peak labeled “i” corresponds to the [M+Na] peak, expected [M+Na] = 1510.718, and the peak labeled “ii” corresponds to the [M+K]
peak, expected [M+K] = 1526.692. (Bottom) The MALDI spectra for fraction 2. The peak labeled “i”
corresponds to the [M+H] peak, expected [M+H] = 1488.736, and the peak labeled “ii” corresponds to the [M+Na] peak.
Figure A3B.25. Characterization spectra for ligand hL3f*F3. Ligand hL3f*F3: C71H101F2N15O17S.
(Top) The HPLC trace for ligand hL3f*F3. The indicated regions correspond to the fraction that had the correct mass. (Bottom) The MALDI spectra for fraction 1. The peak labeled “i” corresponds to the [M+H] peak, expected [M+H]= 1506.727, and the peak labeled “ii” corresponds to the [M+Na] peak, expected [M+Na] = 1528.709.
Figure A3B.26. Characterization spectra for ligand hL3fF4. Ligand hL3fF4: C71H102FN15O17S.
(Top) The HPLC trace for ligand hL3fF4. The indicated regions correspond to the two fractions that had the correct mass. (Middle, Bottom) The MALDI spectra for fraction 1 and fraction 2 respectively.
The peaks labeled “i” correspond to the [M+H] peak, expected [M+H] = 1488.736, and the peaks labeled “ii” correspond to the [M+Na] peak, expected [M+Na] = 1510.718.
![Figure A3B.8. MALDI for ligand hL2A2. Ligand hL2A2: C 66 H 100 N 16 O 18 S. The indicated peak corresponds to the [M+Na] peak, expected [M+Na] = 1459.702](https://thumb-ap.123doks.com/thumbv2/123dok/10401995.0/37.918.166.802.108.386/figure-maldi-ligand-hl2a2-ligand-indicated-corresponds-expected.webp)