Supplementary Material:
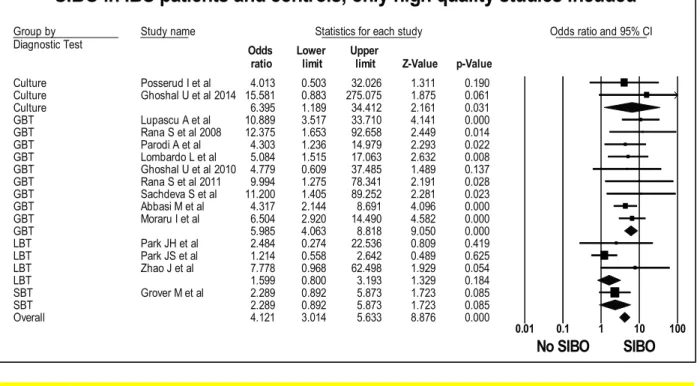
Figure 1: Forest plot of case control studies showing prevalence of SIBO in patients with IBS, when only high-quality studies are included (OR=4.1 (95%CI 3.0-5.6), p<0.001), (I2=27.7, p<0.15).
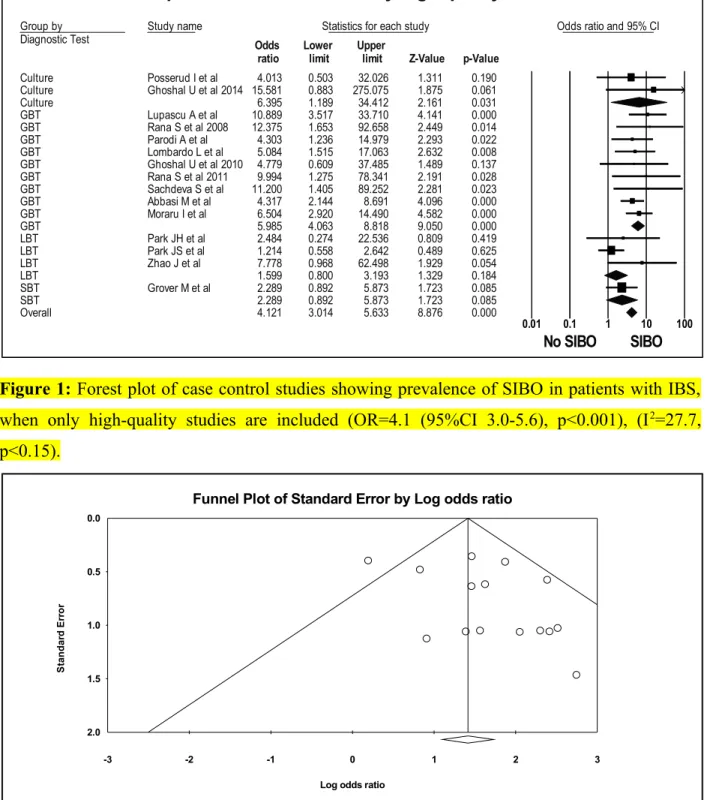
Figure 2: Funnel plot of SIBO in patients with IBS and controls, when only low risk bias studies are included.
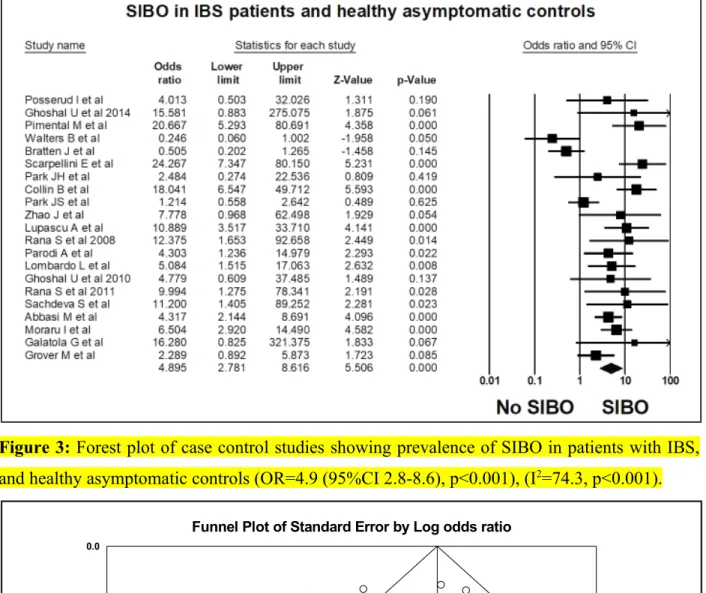
Figure 3: Forest plot of case control studies showing prevalence of SIBO in patients with IBS, and healthy asymptomatic controls (OR=4.9 (95%CI 2.8-8.6), p<0.001), (I2=74.3, p<0.001).
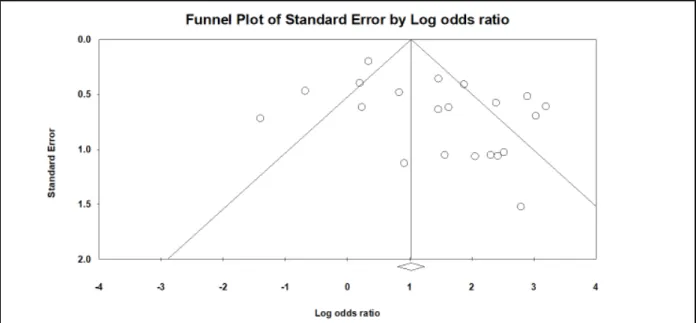
Figure 4: Funnel plot of SIBO in patients with IBS and healthy asymptomatic controls.
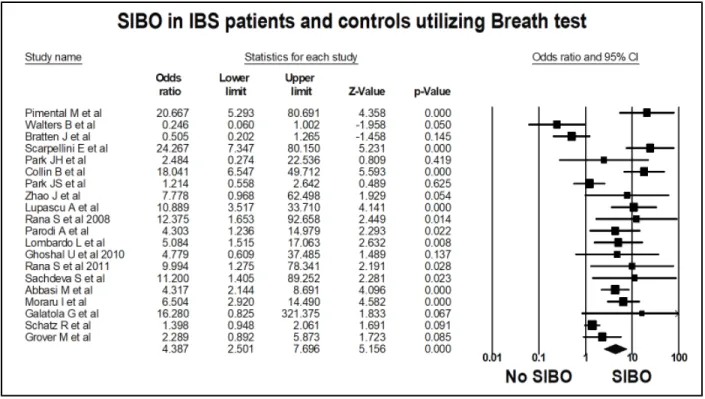
Figure 5: Forest plot of case control studies showing prevalence of SIBO in patients with IBS, utilizing breath tests (OR=4.4 (95%CI 2.5-7.7), p<0.001), (I2=80.2, p<0.001).
Figure 6: Funnel plot of SIBO in patients with IBS and controls, utilizing breath tests.
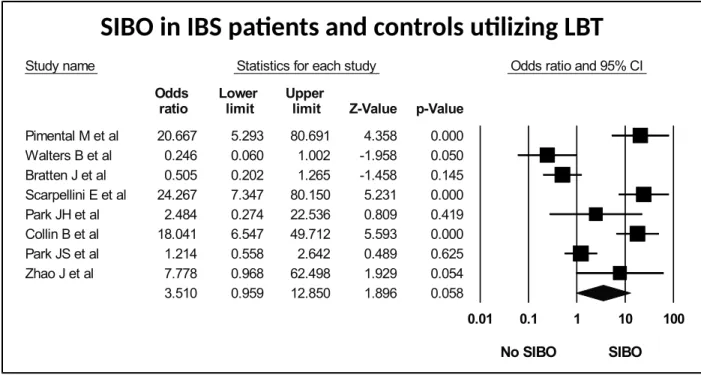
Figure 7: Forest plot of case control studies showing SIBO in patients with IBS and controls, utilizing lactulose breath test (OR=3.5(95%CI 1.0-12.9), p<0.06) (I2=89.1, p<0.001).
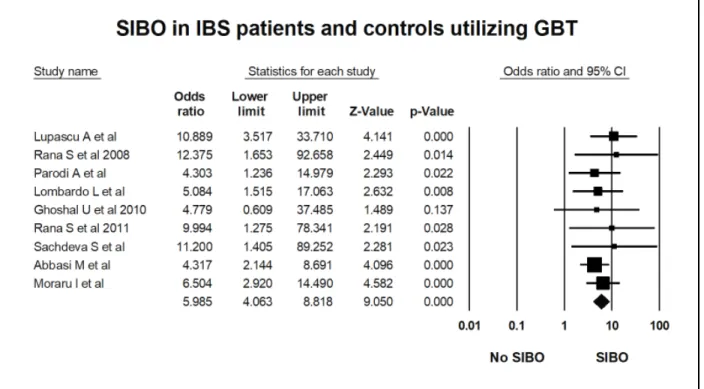
Figure 8: Forest plot of case control studies of SIBO in patients with IBS and controls, utilizing glucose breath test (OR=6.0(95%CI 4.1-8.8), p<0.001) (I2=0, p=0.9).
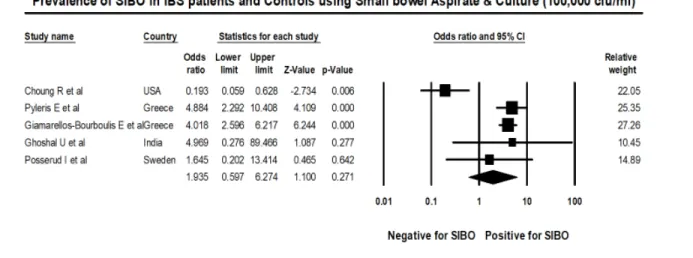
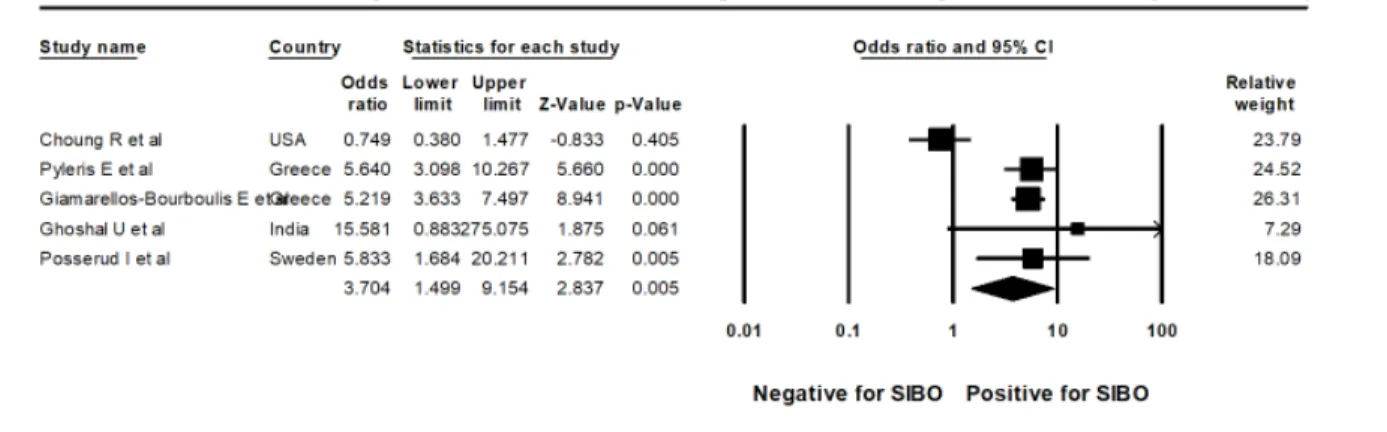
Figure 9: Forest plot of case control studies showing SIBO in patients with IBS and controls, utilizing small bowel culture and aspirate with cut off value of was 105 cfu/ml (OR=1.9(95%CI 0.6-6.3), p=0.271), (I2=83.7, p<0.001).
Figure 10: Forest plot of case control studies showing SIBO in patients with IBS and controls, utilizing small bowel culture and aspirate with cut off value of was 103cfu/ml (OR=3.7(95%CI 1.5-9.2), p<0.005), (I2=85.7, p<0.001).
Figure 11: Forest plot of case control studies of SIBO in IBS subtypes (IBS D versus IBS C), (OR=1.8(95%CI 1.8-2.8), p<0.00), (I2=26.6, p=0.17).
Figure 12: Forest plot of case control studies of SIBO in IBS subtypes (IBS D versus Non- diarrhoeal IBS (IBS M and IBS C)), (OR=1.6(95%CI 1.2-2.3), p<0.004), (I2=45.2, p<0.03).
Figure 13: Forest plot of case control studies showing of SIBO in IBS patients on PPI as compared to those not on PPI therapy. (OR=0.8(95% CI, 0.5–1.5, p=0.55), (I2=0, p=0.87).
Figure 14: Forest plot of case control studies showing Methane positive SIBO in patients with IBS and controls, (OR=1.2(95% CI, 0.8–1.9, p=0.38), (I2=0, p=0.43).
Figure 15: Forest plot of case control studies showing Methane positive SIBO in patients with IBS subtypes (IBS D versus IBS C), (OR=2.3(95% CI, 1.2–4.2, p<0.01), (I2=15.7, p=0.31).
Table 1: Assessment of risk factors for SIBO in case control studies included in the systematic review and meta-analysis.
Table 2: Assessment of cut off criteria for diagnosing SIBO in IBS patients and controls.
Table 3: Studies evaluating the effect of antibiotic treatment in IBS patients with SIBO.
Table 4: Case-control studies of methane-positive SIBO in IBS patients and control.
Table 5: Newcastle-Ottawa scale for assessment of quality of Case control studies included in the Systematic review and meta-analysis.
Group by
Diagnostic Test Study name Statistics for each study Odds ratio and 95% CI
Odds Lower Upper
ratio limit limit Z-Value p-Value
Culture Posserud I et al 4.013 0.503 32.026 1.311 0.190
Culture Ghoshal U et al 2014 15.581 0.883 275.075 1.875 0.061
Culture 6.395 1.189 34.412 2.161 0.031
GBT Lupascu A et al 10.889 3.517 33.710 4.141 0.000
GBT Rana S et al 2008 12.375 1.653 92.658 2.449 0.014
GBT Parodi A et al 4.303 1.236 14.979 2.293 0.022
GBT Lombardo L et al 5.084 1.515 17.063 2.632 0.008
GBT Ghoshal U et al 2010 4.779 0.609 37.485 1.489 0.137
GBT Rana S et al 2011 9.994 1.275 78.341 2.191 0.028
GBT Sachdeva S et al 11.200 1.405 89.252 2.281 0.023
GBT Abbasi M et al 4.317 2.144 8.691 4.096 0.000
GBT Moraru I et al 6.504 2.920 14.490 4.582 0.000
GBT 5.985 4.063 8.818 9.050 0.000
LBT Park JH et al 2.484 0.274 22.536 0.809 0.419
LBT Park JS et al 1.214 0.558 2.642 0.489 0.625
LBT Zhao J et al 7.778 0.968 62.498 1.929 0.054
LBT 1.599 0.800 3.193 1.329 0.184
SBT Grover M et al 2.289 0.892 5.873 1.723 0.085
SBT 2.289 0.892 5.873 1.723 0.085
Overall 4.121 3.014 5.633 8.876 0.000
0.01 0.1 1 10 100
No SIBO SIBO
SIBO in IBS patients and controls, only high quality studies incuded
Meta Analysis
Figure 1: Forest plot of case control studies showing prevalence of SIBO in patients with IBS, when only high-quality studies are included (OR=4.1 (95%CI 3.0-5.6), p<0.001), (I2=27.7, p<0.15).
-3 -2 -1 0 1 2 3
0.0
0.5
1.0
1.5
2.0
Standard Error
Log odds ratio
Funnel Plot of Standard Error by Log odds ratio
Figure 2: Funnel plot of SIBO in patients with IBS and controls, when only high-quality studies are included.
Figure 3: Forest plot of case control studies showing prevalence of SIBO in patients with IBS, and healthy asymptomatic controls (OR=4.9 (95%CI 2.8-8.6), p<0.001), (I2=74.3, p<0.001).
-4 -3 -2 -1 0 1 2 3 4
0.0
0.5
1.0
1.5
2.0
Standard Error
Log odds ratio
Funnel Plot of Standard Error by Log odds ratio
Figure 4: Funnel plot of SIBO in patients with IBS and healthy asymptomatic controls.
Figure 5: Forest plot of case control studies showing prevalence of SIBO in patients with IBS, utilizing breath tests (OR=4.4 (95%CI 2.5-7.7), p<0.001), (I2=80.2, p<0.001).
Figure 6: Funnel plot of SIBO in patients with IBS and controls, utilizing breath tests.
.
Study name Statistics for each study Odds ratio and 95% CI Odds Lower Upper
ratio limit limit Z-Value p-Value Pimental M et al 20.667 5.293 80.691 4.358 0.000 Walters B et al 0.246 0.060 1.002 -1.958 0.050 Bratten J et al 0.505 0.202 1.265 -1.458 0.145 Scarpellini E et al 24.267 7.347 80.150 5.231 0.000
Park JH et al 2.484 0.274 22.536 0.809 0.419
Collin B et al 18.041 6.547 49.712 5.593 0.000
Park JS et al 1.214 0.558 2.642 0.489 0.625
Zhao J et al 7.778 0.968 62.498 1.929 0.054
3.510 0.959 12.850 1.896 0.058
0.01 0.1 1 10 100
No SIBO SIBO
SIBO in IBS patients and controls using LBT
Meta Analysis
Figure 7: Forest plot of case control studies showing SIBO in patients with IBS and controls, utilizing lactulose breath test (OR=3.5(95%CI 1.0-12.9), p<0.06) (I2=89.1, p<0.001).
Figure 8: Forest plot of case control studies of SIBO in patients with IBS and controls, utilizing glucose breath test (OR=6.0(95%CI 4.1-8.8), p<0.001) (I2=0, p=0.91).
SIBO in IBS patients and controls utilizing LBT
Figure 9: Forest plot of case control studies showing SIBO in patients with IBS and controls, utilizing small bowel culture and aspirate with cut off value of was 105 cfu/ml (OR=1.9(95%CI 0.6-6.3), p=0.271), (I2=83.7, p<0.001).
Figure 10: Forest plot of case control studies showing SIBO in patients with IBS and controls, utilizing small bowel culture and aspirate with cut off value of was 103cfu/ml (OR=3.7(95%CI 1.5-9.2), p<0.005), (I2=85.7, p<0.001).
Figure 11: Forest plot of case control studies of SIBO in IBS subtypes (IBS D versus IBS C), (OR=1.8(95%CI 1.2-2.8), p<0.006), (I2=26.6, p=0.17).
Figure 12: Forest plot of case control studies of SIBO in IBS subtypes (IBS D versus Non- diarrhoeal IBS (IBS M and IBS C)), (OR=1.6(95%CI 1.2-2.3), p<0.004), (I2=45.2, p<0.03).
Figure 13: Forest plot of case control studies showing of SIBO in IBS patients on PPI as compared to those not on PPI therapy, (OR=0.8(95% CI, 0.5–1.5, p=0.55), (I2=0, p=0.87).
Figure 14: Forest plot of case control studies showing Methane positive SIBO in patients with IBS and controls, (OR=1.2(95% CI, 0.8–1.9, p=0.38), (I2=0, p=0.43).
Figure 15: Forest plot of case control studies showing Methane positive SIBO in patients with IBS subtypes (IBS C versus IBS D), (OR=2.3(95% CI, 1.2–4.2, p<0.01), (I2=15.7, p=0.31).
Table 1: Assessment of risk factors for SIBO in case control studies included in the systematic review and meta-analysis
Study
No Author
Prior antibiotic use
Concurrent PPI
Treatment with antibiotic
Duration of
treatment Treatment efficacy Prior Surgery Additional Comments
1
Pimentel M et al1
None within
prior 3 months NA NA NA NA
None (except appendisectomy, cholecystectomy or hernia repair) NA 2
Walters B et al2
None within
prior 2 weeks NA NA NA NA NA NA
3
Bratten J et al3
None within
prior 1 month NA NA NA NA
None (except appendisectomy, cholecystectomy or hernia repair)
IBS CH4 producers are more likely to have IBS C than IBS D
4
Scarpellini E et al4
None within
prior 2 months NA NA NA NA
No gastrointestinal
Surgeries NA
5 Park JH et al5
None within
prior 2 weeks NA NA NA NA NA
Intestinal permeability measured using polyethylene glycol (PEG) 3350/400 retrieval ratio was significantly increased in IBS patients as compared to controls, but this did not correlate with the occurrence of SIBO
6
Collin B et al6
None within prior 2 months
23(31) on PPI
or H2RB NA NA NA bowel resection
20/68(30%) children with FGIDs &
positive LBT were concomitantly taking H2RB or PPI as compared to 3/7(43%) with FGIDs and negative LBT, suggesting acid suppression did not increase prevalence of SIBO
7 Park JS et al7
None within
prior 2 weeks NA NA NA NA NA
8 Zhao J et al8 None within NA Rifaximin 10 days SIBO Positive IBS patients, NA NA
prior 4 weeks 600mg BD
particularly those with IBS D showed significant
improvement in overall severity(p=0.002). IBS-D patients without SIBO did not benefit
9
Lupascu A et al9
None within
prior 2 months NA NA NA NA
None (except appendisectomy, cholecystectomy or hernia repair) NA 10
Rana S et al10 2008
None within prior 1 month
None within
prior 8 weeks NA NA NA
prior gastric surgery/
vagotomy NA
11
Parodi A et
al11 NA
1 SIBO positive IBS patient was on PPI
Rifaximin
400mg TDS 10 days
GBT normalization was seen in 70%(17/24) of SIBO positive IBS patients, with significant symptom improvement in eradicated vs nor eradicated patients(p<0.001)
7/21 IBS patients who were SIBO positive had abdominal surgeries (5 appendisectomy and 2
cholecystectomy)
26% of GBT positive IBS patients were CH4 producers, not associated with any bowel pattern
12
Lombardo L et al12
None within prior 6 months
None within prior 3 years
Rifaximin
400mg TDS 2 weeks
The eradication rate (GBT 2 months after completion of treatment and improvement in75% symptom severity and frequency) of SIBO was 87% in PPI group and 91% in IBS group
No gastrointestinal Surgeries
SIBO was detected in 50% of current PPI users (patients with GERD),24.5%
in IBS patients and 6% in controls, with the increase in symptom severity being directly proportional to therapy duration.
13
Ghoshal U et al13 2010
None within prior 4 weeks
None within
prior 4 weeks NA NA NA NA
14
Rana S et al14 2012
None within prior 4 weeks NA
SIBO positive patients were treated with
antibiotics 4 weeks
Normalization of GBT in 9/9 patients who came back for follow up GBT with symptom
improvement None
Patients & controls underwent GBT &
LB. Using GBT as a gold standard for SIBO the sensitivity, specificity, PPV and NPV for SIBO in IBS was 63.6%,67.7%,11.7% & 96.6%
respectively.
15
Sachdeva S et al15
None within prior 6 weeks
None within
prior 6 weeks NA NA NA
No gastrointestinal
Surgeries NA
16
Abbasi M et al16
None within prior 8 weeks
None within
prior 8 weeks NA NA NA
None (except appendisectomy)
17
Moraru I et al17
None within prior 4 weeks NA
Rifaximin
1200mg/day 2 weeks
76 SIBO positive IBS patients and 5 SIBO positive healthy controls had normalization of
GBT NA
65/76(85.5%) and all controls had normalization of LBT 1 week after treatment with Rifaximin and the remaining after an additional 1 week of Rifaximin therapy.
18
Galatola G
et al18 NA NA NA NA NA NA
19
Schatz R et al19
None within prior 4 weeks
None within
prior 2 weeks NA NA NA
Patients included in the study had following surgery (besides appendisectomy, cholecystectomy, hernia repair) gastric bypass: 23, Fundoplication: 17, Bilroths procedure: 4
IBS (1.40 95% CI 0.95-2.06, p=0.09), PPI Use (OR: 0.76, 95% CI 0.57-0.96, p=0.02) or previous abdominal surgery was not associated with SIBO.
20
Grover M et
al20 NA NA NA NA NA
None (except appendisectomy, cholecystectomy or hernia repair)
CH4 production is associated with constipation
21
Posserud I et al21
None within prior 2 weeks NA
ciprofloxacin
500mg BD 10 days
3/7 patients reported >25%
symptom improvement.5/7 treated patients had decreased level of bacteria in cultures but 4 still fulfilled the standard definition for SIBO. NA
Signs of enteric dysmotility (fewer phase III activities) were seen in 86%
patients with SIBO and 39% without SIBO(p=0.02).
22
Choung R et al22
83(13%) were on antibiotics in the 3 months prior to duodenal aspirate
53(36%) were
on PPI NA NA NA
341(51%) patients had history of abdominal surgery, 65(10%) had gastric surgery and 94(14%) had intestinal surgery
No clear association was seen between SIBO and PPI use (OR 1.8, 95%CI 0.9-33, p=0.07) or IBS 0.2(95%CI 0.1-0.7)
23
Pyleris E et al23
None within prior 1 month
22(35.5%) with SIBO were on PPI as compared to 56(21.7%) without
SIBO(p=0.014) NA NA NA NA
Risk factors for SIBO: PPI use
(OR=1.95, 95% CI 1.00-3.78, p=0.049), history of T2DM (OR=2.69, 95% CI 1.34-5.40, p=0.005).
Presence of gastritis was found to be protective (OR=0.50, 95% CI 0.27- 0.93, p=0.028)
24
Giamarellos- Bourboulis E et al24
None within prior 1 month
184(20.50%)
were on PPI NA NA NA NA
Factors associated with SIBO: IBS (OR:
6.28,95%Cl 4.26-9.25
P<0.0001), age > 60 years (OR: 2.36, 95%Cl 1.45-3.84 p<0.001), T2DM (OR:1.59,95%Cl 1.04-2.45, p<0.032), gastritis (OR:0.47, 95%Cl 0.32-0.69, p<0.0001), PPI use did not increase risk of SIBO (OR: 0.76, 95%Cl 0.45- 1.42, p 0.765).
25
Ghoshal U et al252014
None within prior 8 weeks
None within
prior 8 weeks NA NA NA NA
4/15(27%) with and 0/65 without SIBO had a positive GBT (sensitivity 27%, specificity 100%), 0/15 with and 1/65 without SIBO had double peak on LBT (sensitivity 0%, specificity 98%), 5/15(33%) and 23/65(35%) with SIBO had an early peak on LBT (sensitivity 33%, specificity 65%) IBS: irritable bowel syndrome; IBS D: IBS diarrhoea; IBS C: IBS constipation; IBS M: IBS mixed; SIBO: small intestinal bacterial overgrowth; PPI: proton pump inhibitor;
H2RB: H2 receptor blocker; GBT: glucose breath test; LBT; lactulose breath test; T2DM: diabetes mellitus; FGIDs: functional gastrointestinal disorders; H2: hydrogen;
CH4: methane; GERD: gastroesophageal reflux disease; NA: not applicable; PPV: positive predictor value: NPV: Negative predictor value.
Table 2: Assessment of cut off criteria for diagnosing SIBO in IBS patients and controls
Stud
y No Author
Mode of diagnosis of SIBO
Dose of
substrate Cut off criteria for SIBO diagnosis
1
Pimental M
et al1 LBT 10g All abnormal, except no rise H2 or Ch4 within 90mins with a definitive rise <20 ppm during 180mins of test duration.
2
Walters B et
al2 LBT 10g >20 ppm H2 rise over baseline within 90mins & 2 distinct peaks
3
Bratten J et
al3 LBT 10g
No rise H2 within 90mins with a definitive rise <20 ppm during 180mins of test duration
>20 ppm H2 rise over baseline within 90mins & 2 distinct peaks of hydrogen production >12 ppm above basal value with decrease of
≥5 ppm before second peak or breath CH4 of >1ppm.
4 Scarpellini E et al4
LBT 10g >20 ppm H2/CH4 rise over baseline within 90mins
5 Park JH et al5 LBT 10g
>20 ppm H2 or CH4 rise over baseline that occurred 15 min before the colonic peak or an elevated fasting H2 and/or CH4 level (>12- 15 ppm).
6 Collin B et al6 LBT 10g
Normal test: H2 peak > 90mins after lactulose ingestion with a H2 peak <20pp over 180mins, anything beyond these criteria was abnormal.
7 Park JS et al7 LBT NA
(1) baseline H2 >20 ppm or rise of H2 >20 ppm above the baseline in <90 mins, or (2) baseline CH4 10 ppm or rise of breath CH4 > 10 ppm above the baseline in <90 mins.
8 Zhao J et al8 LBT 10g
Criteria 1/2: ≥20 ppm H2 rise over baseline within 90 or 180mins,
Criteria 3: dual breath H2 peaks, 12-ppm H2 rise over baseline with a decrease in ≥5 ppm before the second peak,
Criteria 4: initial H2 rise, involving at least two consecutive values ≥5 ppm above baseline, commenced at least 15mins before an increase in radioactivity (≥5% of administered dose) in the cecal region,
Criteria 5: initial H2 rise, involving at least two consecutive values ≥10 ppm above baseline, commenced at least 15mins before an increase in radioactivity (≥5% of administered dose) in the cecal region and
Criteria 6: initial H2 rise, involving at least two consecutive values ≥20 ppm above baseline, commenced at least 15mins before an increase in radioactivity (≥5% of administered dose) in the cecal region.
9
Lupascu A et
al9 GBT 50g >10 ppm H2 rise over baseline.
10
Rana S et al10
2008 GBT 50g >12 ppm H2 rise over baseline.
11
Parodi A et
al11 GBT 50g >12 ppm H2 rise over baseline.
12 Lombardo L et al12
GBT 50g >10 ppm H2 rise over baseline.
13 Ghoshal U et al13 2010
GBT 100g Persistent rise in breath hydrogen > 12 ppm above basal (at least two readings).
14
Rana S et al14
2012* GBT 80g ≥10 ppm H2 orCH4 rise over baseline within 120 min after glucose ingestion.
15
Sachdeva S et
al15 GBT 100g > 12 ppm persistent rise in H2 or CH4 over baseline.
16
Abbasi M et
al16 GBT 1g/Kg >20 ppm H2 rise over baseline, when the baseline was <10ppm or rise by >12ppm when the baseline was ≥10 ppm.
17
Moraru I et
al17 GBT 50g >20 ppm H2 peak over baseline within 120 min after glucose ingestion.
18
Galatola G et
al18 XBT 1g A rise of greater than 2 standard deviations above mean of healthy subjects on any timepoint in 30-60 min after xylose.
19
Schatz R et
al19 XBT 10 µCi
A positive test is defined as a greater than 2 standard deviation rise in CO2 (14C) value above the normal range at any one or more of the following points: 30 min (≥ 0.0014), 60 min (≥ 0.0029).
20
Grover M et
al20 SBT 50g
Baseline H2 > 20ppm or > 12ppm rise H2 or CH4 over baseline in 60 min or a peak of ≥12 ppm above baseline >60 min after ingestion followed by a second peak of ≥20 ppm above baseline after a gap of ≥15 min from the first peak.
21
Posserud I et al21
Jejunal
Culture 105 cfu/ml
22
Choung R et al22
DU
Culture 105 cfu/ml
23
Pyleris E et al23
DU
Culture 105 cfu/ml
24 Giamarellos- Bourboulis E et al24
DU Culture
105 cfu/ml
25
Ghoshal U et al252014
Proximal small bowel
culture 105 cfu/ml
ppm: parts per million; LBT: lactulose breath test; GBT: glucose breath test; XBT: xylose breath test; SBT: sucrose breath test; DU: duodenum;
H2: hydrogen; CH4: methane; cfu/ml: colony forming unit/ml, NA: not applicable *All patients and controls underwent both GBT and LBT, GBT was however considered as gold standard.
Table 3: Studies evaluating the effect of antibiotic treatment in IBS patients with SIBO.
Author Mode of diagnosis
SIBO positive
Antibiotic type Duration of
Post treatment
Post treatment normalization
Adverse effects
of SIBO
who underwent antibiotic treatment
n therapy
symptom improvement n
of BT or reduction in bacterial counts
n N
Zhao J et
al8 LBT
34 Rifaximin
600mg BD
10 days 34 NA NA
Parodi A
et al11 GBT
24 Rifaximin
400mg TDS
10 days 15 17 NA
Lombardo
L et al12 GBT 49
Rifaximin 400mg TDS
2 weeks 45 45
4(mild headache/
nausea) Posserud I
et al21
Culture, 105cfu/ml 7
ciprofloxacin 500mg BD
10 days 3 5 NA
Ghoshal U et al26 2014
Culture, 105cfu/ml 8
Norfloxacin
400mg BD 10 days 7
proportion of patients did not consent to repeat test 0 Rana S et
al142012 GBT 12
Antibiotic type
not specified 4 weeks 9* 9 NA
Moraru I
et al17 GBT
105** Rifaximin 1200mg OD
14 days 82*** 76 NA
BT: breath test; LBT: lactulose breath test; GBT: glucose breath test; cfu/ml: colony forming unit/ml, NA: not applicable. * only 9/12 SIBO positive patients attended follow up GBT after cesssation of antibiotic therapy. ** dropout rate was 29/105, 76 patients returned to have a GBT after completion of antibiotic therapy. ***49(46.6%) and 33(31.4%) had complete and partial symptomatic improvement following antibiotic therapy. 7 SIBO positive controls underwent antibiotic treatment with normalization of BT in all 5/7 who had a post treatment repeat BT.
Table 4: Case-control studies of methane-positive SIBO in IBS patients and control.
Stud
y no Author
Mode of diagnosi s
IBS n
CH4
Positiv e in IBS n
Total contro l n
CH4
positive in control s n
IBS-D n
CH4
Positiv e in IBS-D n
IBS- C n
CH4
Positive in IBS-C n
1 Parodi et al11 GBT
13
0 35 70 17 51 11 31 10
2
Rana S et al14
2012 GBT
17
5 0 150 0 175 0 0 0
3 Park JS et al7 LBT 76 25 40 13 45 14 12 4
4
Bratten J et
al3 LBT
22
4 44 40 6 114 13 92 25
5
Grover M et
al20* SBT
15
8 52 34 NA 47 0 43 6
6
Scarpellini E
et al4** LBT 43 4 56 0 NA NA NA NA
LBT: lactulose breath test; GBT: glucose breath test; SBT: sucrose breath test; NA: not applicable; IBS: irritable bowel syndrome; IBS D: IBS diarrhoea; IBS C: IBS constipation; *Study not included in analysing the prevalence of methane positive SIBO in IBS patients and controls
** Study not included in analysing the prevalence of methane-positive SIBO in IBS-C and IBS-D
Table 5: Newcastle-Ottawa scale for assessment of quality of Case control studies included in the Systematic review & meta-analysis
11 22 33 44 55 66 77 88 99 1010 1111 1212 1313 1414 1515 1616 1717 1818 1919 2020 2121 2222 2323 2424 2525 SELECTION
Is the case definition
adequate? * * * * * - * * * * * * * * * * * - - * * - - - *
Representativeness
of the cases - * * * * * * * * * * * * * * * * * * - * * * * *
Selection of
Controls * - * * * - * * * * * * * * * * * * - * * - - - *
Definition of
Controls - * * - * - - * - - - - - - - - - - - * - - - - -
COMPARIBILITY
Study controls for
single factor * * * * * - * * * * * * * * * * * * - * * - - - *
Study controls for
additional factors - * - * * - * * * * * * * * * * * - - * * - - - *
EXPOSURE Ascertainment of exposure (presence of
SIBO) * * * * * * * * * * * * * * * * * * * * * * * * *
Same method of ascertainment for cases and
controls * * * * * * * * * * * * * * * * * * * * * * * * *
Non-Response
rate - * - - - - - * - - - - - - - - - - - - * * * * -
Overall Quality Score
(Maximum = 9) 5 8 7 7 8 3 7 9 7 7 7 7 7 7 7 7 7 5 3 7 8 4 4 4 7
Reason for
exclusion a b c d e d b b e e
* each asterisk represents if individual criterion within the subsection was fulfilled.
a) Control group (fibromyalgia) inappropriate since it has increased prevalence of IBS b) Criteria for cases or controls insufficiently defined.
c) Control groups significantly younger as compared to patients
d) Control group heterogenous paediatric patients referred for routine medical care. Risk of concomitant conditions interfering with determining true SIBO prevalence in control group.
e) Controls include a variety of functional conditions. Thus, the study lacks appropriate control group.
Detailed assessment of quality of Case control studies included in the Systematic review & meta-analysis:
1. Pimentel et al 2004: Case definition based upon Rome I. However, IBS patients were recruited by advertisement. Controls were defined as ‘normal subjects’ and GI symptoms were not appropriately captured in this cohort. Key information was lacking for controls. Presence or absence of GI symptoms could have influenced the likelihood of participation.
2. Walters et al 2005: Adequate definition of cases (Rome II). However, unclear how many patients were consecutive patients seen in outpatients and how many were recruited from a cohort of study patients enrolled in a clinical trial on acupuncture. Control patients without GI symptoms as measured by standardised questionnaire). Control group not matched for gender (all controls female) and age of controls and patients different (median of controls 46 vs. patients 51.4 + 12.8 yrs). Variable criteria applied for the diagnosis of SIBO.
3. Bratten et al 2008: Patients and controls are well defined, and gender matched. There is a significant difference in relation to age between controls and patients, which increases the risk on bias.
4. Scarpelli et al 2009: Cases were appropriately defined and controls patients without history of IBS (‘admitted for routine medical care’). Well controlled for age, gender and other parameters. Symptoms in controls were not assessed by a VAS.
5. Park et al 2009: Patients and controls are well defined, and symptoms were assessed with standardised questionnaire. However, it is unknown if patients or controls with specific symptoms or clinical features were more likely to be included into the study.
6. Collins et al. 2011: Patients with abdominal symptoms were recruited and classified as IBS (patient cohort) and compared with those with functional dyspepsia, functional abdominal pain, or abdominal migraine (patient controls). The lack of proper asymptomatic healthy controls exposes this study to an extreme risk of false negative findings.
7. Park et al 2010: included were patients with IBS, functional bowel disorders and healthy controls, recruited by advertisement. No standardized assessment of GI symptoms in the control group.
8. Zhao et al 2014: 94 consecutive patients with IBS (Rome III) and 13 asymptomatic controls were recruited in this study. Structural lesions excluded in patients. Symptoms were assessed with a standardised 5-point scale.
9. Lupascu et al 2005: This study included 65 patients with IBS (Rome II) and 102 (first degree relatives) as controls, clinical assessment, but no standardised questionnaires were used to assess symptoms in controls. It is also unclear how many were excluded because of underlying disease.
10. Rana at al 2009: Consecutive IBS patients, predominantly male, no precise case definition (i.e. Rome I). Healthy controls, but no symptom assessment was done.
11. Parodi et al 2009: Well defined and characterised IBS patients (Rome III). No standardized symptom assessment of the control population (healthy subjects). Matched for age and gender.
12. Lombardo et al 2010: Consecutive patients with defined disease condition (GERD, IBS (Rome III)) and healthy controls.
Controls did not undergo standardised symptom assessment.
13. Ghoshal et al 2010: Retrospective study of appropriately defined patients and controls. Unclear how symptoms assessed in control population.
14. Rana et al 2012: Prospectively enrolled patients with IBS-D and age and gender matched health controls. Controls matched for age and gender, but symptoms not properly assessed. Tests were interpreted by an experienced faculty member blinded to conditions and symptoms.
15. Sachdeva et al. 2011: Prospectively enrolled IBS (Rome III) patients and controls. Controls did not undergo standardised symptom assessment.
16. Abbasi et al 2014: IBS patients according to Rome III, age and gender matched controls (healthy blood donors). However, no standardized symptom assessment was done in controls.
17. Moraru et al. 2014: Consecutive IBS patients (Rome III). Controls age and gender matched healthy subjects. However, no standardized symptom assessment was done in controls.
18. Galatola et al 1991: This study included a cohort of patients with a variety of GI diseases. The cases and control groups are not well defined.
19. Schatz et al 2015: Retrospective study (audit). Criteria for cases and controls insufficiently defined.
20. Grover et al 2008: This study included clinically diagnosed IBS patients (Rome II) and controls without significant GI conditions.
It is unclear if subjects are representative for IBS patients, (recruited by advertisement). Standardised symptom assessment questionnaires were used for cases and control groups.
21. Posserud et al 2007: This study included IBS patients according to Rome II and control group were healthy subjects without any GI symptoms. However, there was no standardised assessment of GI symptoms.
22. Choung et al 2011: This is a retrospective study of all patients who underwent duodenal aspirate and culture for a variety of clinical indications or symptoms and did not included any healthy asymptomatic controls. No standardised assessment of symptoms (‘diagnosis was obtained from physician notes’) for cases or control group.
23. Pyleris et al 2012: This is a prospective study of patients undergoing outpatient endoscopy. Diagnosis of IBS based upon clinical assessment and Rome II criteria. The study used a questionnaire, assessing abdominal pain or discomfort and the relationship with bowel habits to classify patients with IBS and without IBS (who were used as a control group).
24. Giamarellos-Bourboulis et al 2016: This study included a large cohort of patients undergoing upper GI endoscopy. IBS was diagnosed based upon clinical assessment and Rome criteria. Controls were poorly defined (most likely patients undergoing endoscopy who did not have IBS).
25.Ghoshal et al 2014: This study included a cohort of patients with IBS (Rome III) and Historic controls, which were not well defined.
References:
1. Pimentel M, Wallace D, Hallegua D, et al. A link between irritable bowel syndrome and fibromyalgia may be related to findings on lactulose breath testing. Ann Rheum Dis 2004;63:450-2.
2. Walters B, Vanner SJ. Detection of bacterial overgrowth in IBS using the lactulose H2 breath test: comparison with 14C-D-xylose and healthy controls. Am J Gastroenterol 2005;100:1566-70.
3. Bratten JR, Spanier J, Jones MP. Lactulose breath testing does not discriminate patients with irritable bowel syndrome from healthy controls. Am J Gastroenterol 2008;103:958- 63.
4. Scarpellini E, Giorgio V, Gabrielli M, et al. Prevalence of small intestinal bacterial overgrowth in children with irritable bowel syndrome: a case-control study. J Pediatr 2009;155:416-20.
5. Park JH, Park DI, Kim HJ, et al. The Relationship between Small-Intestinal Bacterial Overgrowth and Intestinal Permeability in Patients with Irritable Bowel Syndrome. Gut Liver 2009;3:174-9.
6. Collins BS, Lin HC. Double-blind, placebo-controlled antibiotic treatment study of small intestinal bacterial overgrowth in children with chronic abdominal pain. J Pediatr
Gastroenterol Nutr 2011;52:382-6.
7. Park JS, Yu JH, Lim HC, et al. [Usefulness of lactulose breath test for the prediction of small intestinal bacterial overgrowth in irritable bowel syndrome]. Korean J
Gastroenterol 2010;56:242-8.
8. Zhao J, Zheng X, Chu H, et al. A study of the methodological and clinical validity of the combined lactulose hydrogen breath test with scintigraphic oro-cecal transit test for diagnosing small intestinal bacterial overgrowth in IBS patients. Neurogastroenterol Motil 2014;26:794-802.
9. Lupascu A, Gabrielli M, Lauritano EC, et al. Hydrogen glucose breath test to detect small intestinal bacterial overgrowth: a prevalence case-control study in irritable bowel
syndrome. Aliment Pharmacol Ther 2005;22:1157-60.
10. Rana SV, Sinha SK, Sikander A, et al. Study of small intestinal bacterial overgrowth in North Indian patients with irritable bowel syndrome: a case control study. Trop
Gastroenterol 2008;29:23-5.
11. Parodi A, Dulbecco P, Savarino E, et al. Positive glucose breath testing is more prevalent in patients with IBS-like symptoms compared with controls of similar age and gender distribution. J Clin Gastroenterol 2009;43:962-6.
12. Lombardo L, Foti M, Ruggia O, et al. Increased incidence of small intestinal bacterial overgrowth during proton pump inhibitor therapy. Clin Gastroenterol Hepatol
2010;8:504-8.
13. Ghoshal UC, Kumar S, Mehrotra M, et al. Frequency of small intestinal bacterial
overgrowth in patients with irritable bowel syndrome and chronic non-specific diarrhea. J Neurogastroenterol Motil 2010;16:40-6.
14. Rana SV, Sharma S, Kaur J, et al. Comparison of lactulose and glucose breath test for diagnosis of small intestinal bacterial overgrowth in patients with irritable bowel syndrome. Digestion 2012;85:243-7.
15. Sachdeva S, Rawat AK, Reddy RS, et al. Small intestinal bacterial overgrowth (SIBO) in irritable bowel syndrome: frequency and predictors. J Gastroenterol Hepatol 2011;26 Suppl 3:135-8.
16. Abbasi MH, Zahedi M, Darvish Moghadam S, et al. Small bowel bacterial overgrowth in patients with irritable bowel syndrome: the first study in iran. Middle East J Dig Dis 2015;7:36-40.
17. Moraru IG, Moraru AG, Andrei M, et al. Small intestinal bacterial overgrowth is
associated to symptoms in irritable bowel syndrome. Evidence from a multicentre study in Romania. Rom J Intern Med 2014;52:143-50.
18. Galatola G, Grosso M, Barlotta A, et al. [Diagnosis of bacterial contamination of the small intestine using the 1 g [14C] xylose breath test in various gastrointestinal diseases].
Minerva Gastroenterol Dietol 1991;37:169-75.
19. Schatz RA, Zhang Q, Lodhia N, et al. Predisposing factors for positive D-Xylose breath test for evaluation of small intestinal bacterial overgrowth: A retrospective study of 932 patients. World Journal of Gastroenterology : WJG 2015;21:4574-4582.
20. Grover M, Kanazawa M, Palsson OS, et al. Small intestinal bacterial overgrowth in irritable bowel syndrome: association with colon motility, bowel symptoms, and psychological distress. Neurogastroenterol Motil 2008;20:998-1008.
21. Posserud I, Stotzer PO, Bjornsson ES, et al. Small intestinal bacterial overgrowth in patients with irritable bowel syndrome. Gut 2007;56:802-8.
22. Choung RS, Ruff KC, Malhotra A, et al. Clinical predictors of small intestinal bacterial overgrowth by duodenal aspirate culture. Aliment Pharmacol Ther 2011;33:1059-67.
23. Pyleris E, Giamarellos-Bourboulis EJ, Tzivras D, et al. The prevalence of overgrowth by aerobic bacteria in the small intestine by small bowel culture: relationship with irritable bowel syndrome. Dig Dis Sci 2012;57:1321-9.
24. Giamarellos-Bourboulis EJ, Pyleris E, Barbatzas C, et al. Small intestinal bacterial overgrowth is associated with irritable bowel syndrome and is independent of proton pump inhibitor usage. BMC Gastroenterol 2016;16:67.
25. Ghoshal UC, Srivastava D, Ghoshal U, et al. Breath tests in the diagnosis of small intestinal bacterial overgrowth in patients with irritable bowel syndrome in comparison with quantitative upper gut aspirate culture. Eur J Gastroenterol Hepatol 2014;26:753-60.
26. Ghoshal UC, Srivastava D, Misra A, et al. A proof-of-concept study showing antibiotics to be more effective in irritable bowel syndrome with than without small-intestinal bacterial overgrowth: a randomized, double-blind, placebo-controlled trial. European Journal of Gastroenterology & Hepatology 2016;28:281-289.