CHAPTER I INTRODUCTION
This chapter describes: (a) background, (b) problem of the study, (c) objective of the study, (d) significances of the study, (e) hypotheses, and (f) criteria of testing the hypothesis.
A. Background
English is the universal language which is used in several segment, such as in the society, business and communication, and education. Ahmed (2010:1) states that in globalization, English holds the important role and considered as universal language in several segment, those are in society, especially in economics and trade, business and communication, and education. There are two main reasons which made English as global or universal language. Firstly, English language can be made the official language of a country, to be a link of communication in governmental area, the law courts, the media, and the educational system. Secondly, English can be made as a priority of foreign language teaching in each countries, eventhough the language has no official status in the country (Crystal, 2003:4).
English has dominated global language teaching in Indonesia. Mahrum (2009:1) states that “in recent years, the teaching and use of a global language, English, in Indonesia has dominated language education”. It can be seen from the government’s policy which is includes English as a foreign language into National
Examination standard as some special subjects such as Bahasa Indonesia, Science, and Mathematics in Junior High School and Senior High School (Khoiriyah, 2011:2). Furthermore, in National Examination, there are some important subjects which is the material of the test has prepared by the government, those are English, Bahasa Indonesia, and Mathematic (Depdiknas, 2004:i). Each important subjects had different skills to be achieved.
English had four skills that can be developed, those are listening, speaking, reading, writing. Khameis (2006:111) states that “the four skills (reading, writing, speaking and listening) naturally appear together in every English class, even in the EFL context”. Moreover, there are receptive and productive skills in English (Siahaan, 2008:3). Receptive skills are the ways how people acquire the meaning from the discourse that they see or hear, this kind of processing which apply in reading and listening. (Harmer, 2001:199). Meanwhile, the productive skills are known as active skill which the learners need to produce the language by their own, speaking and writing are included in this productive skills (Masduqi, 2012:2).
In the classroom, the priority for many second and foreign language learners are mastering the speaking skill. Richards (2008:19) says that the mastery of speaking skills in English is a priority for many second language or foreign language learners. Speaking skill also become one of target skill in English that most often used by the teachers and students in teaching and learning first and foreign languages. Naggar, et.al, (2002:142) states that “Speaking is the target
skill in both first and foreign languages”. It is recognized as critical for functioning in an English language context both by teacher and learner.
There are some problems that usually appears in speaking class. Mounira cited in Naggar, et.al., (2002:142) gives the main reasons in speaking difficulties, those are: shyness, lack of appropriate language (vocabulary and structures), fear of making mistakes, lack of confidence, having nothing to say. Moreover, Febrianti (2009:7) gives the different problems in speaking class. Those problems were Students do not want to talk or say anything, students keep using their own language, difficult to handle students in large classroom, students are not discipline in classroom, the materials do not fulfill the need of students, and students have low motivation to learn English. Those problems make the student didn’t want to practicing their speaking in the classroom.
Beside the problems of speaking that were found by Mounira and Febriyanti, the writer also found some problems of speaking at SMP N 2 Tanjung Lago Banyuasin. The writer got the problems by doing informal interview to the teachers and the students. And the result of the informal interview showed that there were some speaking problems faced by teachers and students at this school, especially to the seventh grade students of SMP N 2 Tanjung Lago Banyuasin.
The teacher of English said that, there were some problems that appeared in teaching speaking. First, students could understand what people said in English but the students could not speak English well. Second, the students never did communication in English well, the students are passive and the students were not able to give the answer orally in English. Third, the students want result
immediately and even after their first lesson, the students want to show other student in the school or their family that they could speak English. Furthermore, the writer also got some problems that faced by students in learning speaking.
First, the students felt bored in learning speaking because of uninteresting srategy that used by teachers. Second, the students worried for making mistakes in English. Third, the students were shy to practice their English orally.
To overcome those problems, the teachers should use effective teaching strategy that encourage students to take part actively in the class. Khameis (2006:
112) states that the strategies that used by the teacher should be interesting and should capture students’ attention. Teachers need to teach the material by using good strategy and organize teaching and learning process as good as possible, so teaching and learning process can run well, that can make student master in English skill, especially in speaking skill, successfully.
In this study, one of teaching strategies that used to overcome the problems is Jazz Chants Strategy. Jazz Chants is special chants written to help with English language learning (Naggar, et.al, 2002:71). Jazz chants is the innovative way to improve the student’s speaking skill. Peralta and Quito (2010:11) say that “Jazz Chants provide an innovative and exciting way to improve your students´ speaking and listening skills while reinforcing the language structures of everyday situations.” Jazz Chants are communicative, interactive, and creative way. They include repetition given in a situational context based on everyday life situation. Jazz Chants can give the students motivation because of the rhythms and humor.
Therefore, in this study, the writer is interested in doing a research entitled
“ Teaching speaking by using jazz chants strategy to the seventh grade students of SMP N 2 Tanjung Lago Banyuasin”. The writer want to know whether or not there is a significant difference on students’ speaking achievement who are taught by using jazz chants startegy and who are taught using strategy that used by teacher at the school to the seventh grade students of SMP N 2 Tanjung Lago Banyuasin.
B. Problem of the study
The problem of the study is formulated in the following question :
Is there any significant difference on students’ speaking achievement who are taught by using jazz chants strategy and who are taught by using strategy used by teacher at the school to the seventh grade students of SMP N 2 Tanjung Lago Banyuasin?
C. Objective of the study
Based on the problem above, the objective of this study is:
To find out whether or not there is a significant difference on students’
speaking achievement who are taught by using jazz chants startegy and who are taught by using strategy used by teacher at the school to the seventh grade students of SMP N 2 Tanjung Lago Banyuasin.
D. Significances of the study
The significance of the study is expected that the results of this study will give some beneficial inputs
1) For the teachers of English at SMP N 2 Tanjung Lago, this study will give a new strategy that can be applied in teaching speaking.
2) For the teachers of English, the result of this study is expected would be useful for the English teacher especially in developing and improving the students’ speaking skill by using Jazz chants strategy.
3) For the students, the result of this study is expected to enchanced the competence of the students at SMP N 2 Tanjung Lago Banyuasin in English especially in speaking skill, encourage to speak verbally, and the students can give the respons in every communication.
4) For writer, by doing this study, the writer can get more information in applying Jazz Chants strategy and it will be useful for the writer when being a teacher in the future life.
E. Hypothesis
Fraenkle et. al (2012:83) state that a hypothesis is often described as the prediction of the possible outcomes of the study. In doing this study, the hypotheses are formulated as follow :
(Ho) : There is no a significant difference on students’ speaking achievement who are taught by using jazz chants and who are taught by using strategy that
used by teacher at the school to the seventh grade students of SMP N 2 Tanjung Lago Banyuasin
(Ha) : There is a significant difference on students’ speaking achievement who are taught using jazz chants and who are taught using strategy that used by teacher at the school to the seventh grade students of SMP N 2 Tanjung Lago Banyuasin.
F. Criteria of testing the hypothesis
To test the hypotheses, the writer use the criteria of testing the hypothesis are as follow:
1) The null hypothesis (Ho) is accepted whenever the p-output is higher than 0.05. It means that the alternative hypothesis (Ha) is rejected.
2) The alternative hypothesis (Ha) is accepted whenever the p-output is equal or lower than 0.05. It means that the null hypothesis (H0) is rejected.
CHAPTER II LITERATURE REVIEW
This chapter discusses (a) theoritical framework (b) previous related studies, and (c) research setting.
A. Theoritical framework
In this part, it deals with (1) Concept of Teaching, (2) Concept of Speaking, (3) Concept of Teaching Speaking, (4) Concept of Speaking Expression, (5) Concept of Jazz Chants, (6) the Adventages of Jazz Chants, (7) Procedures of Teaching Speaking by using Jazz Chants.
1. Concept of Teaching
Teaching is central of education, it could be called the central educational activity (Stanton, 1977:1). In addition, Moore (2000:4) states that teaching is the action of someone who trying to help others in developing their total potential.
Moreover, Brown (2007:8) states that teaching may be defined as showing or helping someone to learn how to do something, giving instructions, guiding in the study of something, providing with knowladge, causing to know or understand.
Teaching is the critical profession. A teacher influences every person who goes on to further study, training or employment. Teachers have been prominent people in at least the formative years of the lives of all the state’s citizens. The
quality of their work matters in ways matched by few professions (Ramsay, 2000:
2) cited in (Whitton et al, 2004: 45).
From the previous definitions, the writer can assume that teaching is one of the process of education done by teacher and students for helping, transferring, guiding, and sharing the knowledge, skills and potential in all aspects of development.
2. Concept of Speaking
Improving speaking skill is one of the target skill for ESL and EFL learners. Bahrani and Soltani (2012:1) states that “one of the main concerns of most of the language learners in both ESL and EFL contexts is how to improve speaking skills”. Moreover, developing proficiency in speaking is the target of the most English language learners. Richards and Renandya (2002:201) state that “a large percentage of the world’s language learners study English in order to develop proficiency in speaking.”
There are some concepts of speaking that have been proposed by experts in language learning. Brown (2004:140) states that speaking is a productive skill that can be observed directly and empirically. When someone can speak a language it means that he can carry on a conversation competently (Brown, 2001:267). The qualifying of the ability to speak fluently, is not only a knowladge features, but also the ability to process the information and language directly (Harmer, 2001:269).
Richards and Renandya (2002:204) state that effective oral communication requires the ability to use the language appropriately in social interactions that involves not only verbal communication but also paralinguistic elements of speech such as pitch, stress, and intonation. Moreover, nonlinguistic elements such as gestures, body language, and face expressions are needed in conveying messages directly without any accompanying speech.
From some definitions, it can be assumed that speaking skill is always related to communication. Speaking skill itself can be stated as the skill to use the language accurately to express meanings directly in order to transfer or to get knowledge and information orally from other people in the whole life situation.
a. Basic Types of Speaking
There are five types of classroom speaking performance that students are expected to carry out in the classroom Brown (2004:141). Each type has different purpose of speaking
1. Imitative
A very limited portion of classroom speaking time may legitimately be speech generating human tape recorder speech, where, for example, learner practice an intonation contour or try to pinpoint a certain vowel sound. Imitation of this kind is carried out the purpose of meaningful interaction, but for focusing on some particular element of language form.
2. Intensive
Intensive speaking goes one step beyond imitative to include any speaking performance that is designed to practice some phonological or grammatical aspect of language. Intensive speaking can be self initiated or it can even form part of some pair work activity, where learners “going over” certain forms of language, for example reading aloud, sentence, and dialogue completion.
3. Responsive
A good deal of student speech in the classroom is responsive: short replies a teacher or student. Responsive assessment tasks include interaction and test comprehension but in short conversation, standard greetings, small talk, and simple request.
4. Interactive
Interactive can take the two forms of transactional language, which has the purpose of exchanging specific information or interersonal exchanges, which has purpose of maintaining socil relationship.
5. Extensive (monologue)
Students at intermediate to advanced levels are called on to give extended monologues in the form of oral reports summaries or perhaps short speeches.
From five basic types of speaking above, the writer used responsive type.
Because the learners will replies the teacher’s and other learners’ questions or giving comment for teacher’s statement with a short response or short talk.
3. Concept of Teaching Speaking
Students often think that the ability to speak a language is the product of language learning, but speaking is also a crucial part of the language learning process. According to Harmer (1998:87), there are three main reasons for getting students to speak in the classroom. Firstly, speaking activities provide rehearsal opportunities – chance to practice real-life speaking in the safety of the classroom.
Secondly, speaking tasks in which students try to use any or of the language they know provide feedback for both teacher and students. Everyone can see how well they are doing: both successful they are, and also what language problems they are experiencing. And thirdly, the more students have opportunities to be active the various elements of language they have stored in their brains, the more automatic their use of these elements become. This means that they will be able to use words and phrases fluently without very much conscious thought.
In teaching speaking, the teachers are willing their students to be able to speak fluently. Tumova (2002:10) states that speaking fluently represents one of the targets which teachers are willing to achieve with their students at any stage of their studies, using various approaches, techniques and activities to have more students successful and fluent in using English. Hughes (1989:101) states that the objective of teaching spoken language is the development of the ability to interact successfully in that language. In addition, Bahrani and Soltani (2012:1) state that the major goal of teaching speaking skills is communicative efficiency. It can be assumed that teaching speaking means teach the learners to be able to communication or make interaction effectively and successfully in that language.
4. Concept of Speaking Expression
Expression commonly used to show someone’s feelings in a communication both witten and orally. Bull (2008:156) states that “expression is things that people say, write or do to show their feelings”. In addition, William (1993:99) states that “Expression is the act of putting thought into verbal form, which involves the encoding or creation of a text or utterance.” From the previous definition, it can be assumed that expression is the way of someone to show what they feel or they think both in written or oral language.
In this study, the writer used some expression as the material of teaching speaking. It means that, the expressions that used in this study is oral expressions.
The expressions that used by te writer are greeting expression, command expression, gratitude expression, apologizing expression, politeness expression, and asking and giving information expression (see appendix I). The material was taken from English in Focus for Grade VII book.
a) Greeting expression
Akindele (2007:3) states that greetings can be described as the exchanging good expressions between two people or a group interacting for the purpose of fulfilling social relationship or for the establishing interpersonal relationship. The examples of greeting expression are Hello, Jean. How are you today? And good morning Ann.
b) Command expression
Davis (2010:2) states that command expression is used to give instruction(when asking someone to do something) and give direction (telling someone to find the place or helping someone completing the task). The example of command expression are wake up! And put it away.
c) Gratitude expression
Gratitude is an expression to express greatful feeling to other people (Dyta, 2012:3). In addition, Lyubomirsky (2008:1) states that “the practice of gratitude involves a focus on the present moment, on appreciating your life as it is today and what has made it so.” The examples of gratitude expression are thank you very much and I want to express my gratitude to my teacher.
d) Apologizing expression
Apologizing is polite speech act used to restore social relations which is caused by mistakes or violation (Juhana, 2011:2). Jacobsson (2004:188) adds the definition of apologizing expression, he says that apologizing is the strategy to express regret to offer an apology or to request forgiveness. The example apologizing expression are I am sorry and please accept my apology.
e) Politeness expression
Politeness in English includes well-mannered behaviour and showing consideration to feeling and position of others to maintaning the
relationship between people with smoth communication (Haugh, 2008:6). From the definition, it can be assumed that politeness expression is used to express polite manner in communication with others. The examples are Could I speak to Tom Lee, please?and Excuse me, I’d like a box of chocolates for my friend.
f) Asking and giving information expression
There are so many information that can be asked. For example personal information, place information, and price detailed information. Bull (2008:228) states that information is facs or details of somebody or something. The example of the expression are can you tell me where do you live? And do you know where the bank is ?.
5. Concept of Jazz Chants
Graham discovered jazz chants accidentally while playing the piano.
Holbova (2008:14) states that Graham discovered Jazz Chants only by accident while playing the piano in one bar. Graham’s friend came to her said several words in which she could feel exactly the music beat she was playing. Graham found the connection between traditional American jazz and spoken American English.
Jazz chants is the rhytmical expression which is included a combination of repetition and learned response. According to Graham (1986:vi) “Jazz Chants is a rhythmic expression of Standard American English as it occurs in situational contexts.” Jazz chants consist of the combination of repetition and learned
response (Graham, 1986: ix). The important elements in presenting a Jazz chants are the clear, steady, beat and rhytm (Graham 1978:xi). In addition, Tang and Loyet (2002:1) stated that Jazz chants are meaningful and communicative, the chants look like a pattern drill because of the repetition and the response which was included in the chants. Jazz Chants are innovative and exciting way to improve students’ speaking and listening skills while reinforcing the language structures of everyday situations (Peralta and Quito, 2010:11).
The primary purpose of jazz chants is the improvement of speaking and listening comprehension skill, jazz chants also reinforcing specific structures in the situational context (Graham, 1978:ix). Chant means sing or shout the same words many times (Bull, 2008:67). Furthermore, chants are suitable for all level students of English, learning strategies, intelligence, interests or learning problems they have (Zhang, 2011:564).
From the explanation above, it can be assumed that jazz chant strategy is the strategy to practice the English utterance by singing or shouting the same words many times by using jazz rhyme. Learners enjoyed interacting with questions and answers along the chant. And they also practice speaking. For example is “Where can I buy a ticket?”
Where can I buy a ticket Excuse me, where’s the coffee shop?
Not here! It’s behind the ticket office.
Excuse me, where’s the coffee shop?
Not here! It’s across from the exit.
Excuse me, where’s the coffee shop?
Not here! It’s between the phone booths and the luggage lockers.
Excuse me, where’s the coffee shop?
Not here! It’s in front of the restrooms.
Excuse me, is this the coffee shop?
Yes, it is. But sorry, it’s closed!
6. The Advantages of Applying Jazz Chants
There are some advantages of applying jazz chants in the classroom.
Zhang (2011:564) mentioned some advantages of applying jazz chants in the classroom:
1) Jazz Chants considerably improve students’ listening and speaking skills.
This is probably the most important point.
2) They practice stress and rhythm, are highly motivating and encourage role playing and pair activities.
3) They strengthen language structures and the ability to speak every day spoken English. Chants are simple, provide the language children really use and are repetitive, which, mainly in case of very young learners, is quite necessary.
4) They are suitable for all ages, teachers must only choose the right accompanying activities.
5) They help students to remember difficult words or phrases. And last but not least, children are themselves while singing, clapping or shouting.
Moreover, There are some reasons for applaying jazz chants in the classroom. Naggar et. al, (2002:61) give some variety reasons for jazz chants:
a. To teach the natural rhythm, stress and intonation of conversational English.
b. To recall a grammatical point, for example: present simple, past simple, pronouns, questions, etc.
c. To teach language functions, for example: asking for information, giving explanations, etc.
d. To develop students' listening and speaking skills.
e. To create an interesting, relaxing atmosphere that helps students in acquiring the new language.
Based on the adventages and the reasons that mentioned before, the writer used jazz chants to develop student’s speaking skill. Because Jazz Chants could create an interesting, relaxing atmosphere that help students acquiring the new language. Those reasons could make the students practicing their speaking comfortably and applying jazz chants effectively in the classroom.
7. Procedures of Teaching Speaking by using Jazz Chants
The following steps is the method to apply Jazz Chants in the classroom by Carolyn Graham (Holbova, 2008: 16).
STEP 1: Preview
a) Teacher talks about the title of the chant, what the students think it is about,
b) Teacher explains connection to cultural context. The mother tongue can be used for young learners, and the simple English can be used for older students.
STEP 2: Listen
a) Teacher familiarizes students with the chant, sings the chant or plays the chants on a CD player,
b) Teacher stresses the rhythm of the chant by using different rhythmic instruments (drums, tambourines or just hands, pencils or feet).
STEP 3: Choral chanting
a) Teacher writes the text of the chant on the blackboard or students open their books, so the students can read it and repeat it after the teacher or recording.
b) Teacher separates the difficult words or phrases from the rest of the text and practice it with learners only with some small chunk of the text.
STEP 4: Group/ individual chanting
a) Students try the chant as a whole class,
b) Teacher divides them into several groups in order to practice different parts of it (for example questions and answers),
c) Students may get into pairs and sing and chants for the class in turns.
B. Previous Related Study
The are two previous related studies which was related to the writer’s study. First, The thesis entitled ‘‘Improving students’ speaking competence by using jazz chants (an action research to the third semester students of English education study program, Muhammadiyah University, Purwokerto). ” written by Ardani (2013). The objectives of the study were (1) to find out whether jazz chants can improve students’ speaking competence and (2) to find out the strengths and the weaknesses of the implementation of jazz chants to improve the students’ speaking competence. The result of her research were (1) jazz chants could improve the students’speaking competence with pronunciation, grammar, vocabulary, fluency, and comprehension as the speaking aspect, and (2) the strengths of jazz chants in teaching speaking in this research were: Jazz chants gave experiences of learning by using chants and rhytm, and gave the opportunities to express their creativity through the activity of making jazz chants on their own. Meanwhie, the weaknesses of jazz chants were: they are topic- oriented, inflexible, and tend to be monotonous.
There are some similarities and differences between Ardani’s study and the write’s study. The similarities of both studies were (1) use the same teaching
strategy in the study, that is jazz chants strategy, (2) use the same skill in the study, that is speaking skill. And the differences between Ardani’s study and the writer study were: (1) Ardani’s research was an action research, meanwhile the writer’s research is an experimental research, (2) the population of Ardani’s study was the third semester of English education study program, Muhammadiyah University, Purwokerto, meanwhile the population of the writer’s study is the seventh grade students of SMP N 2 Tanjung Lago, Banyuasin, (3) the objectives of Ardani’s study were to find out whether jazz chants can improve students’
speaking competence and to find out the strengths and the weaknesses of the implementation of jazz chants to improve the students’ speaking competence.
Meanwhile, the writer’s study are to find out whether or not there is a significant difference on students’ speaking achievement who are taught by using jazz chants startegy and who are taught by using strategy that used by teacher at the school to the seventh grade students of SMP N 2 Tanjung Lago Banyuasin.
Second, the title of the thesis is “Teaching English Grammar Through Jazz Chants to the Seventh Grade Students at SMP N 1 Inderalaya” written by Rakhmanina (2006). The objective of the study was to find out whether teaching grammar through Jazz Chants had a significant effect on the students’ grammar achievement or not. The result of her research is teaching english grammar through Jazz chants had significant effect on students’ grammar achievement.
There are some similarities and differences between Rakhmanina’s study and the writer’s study. The similarities are (1) both studies use the same teaching strategy that is jazz chants strategy, (2) both studies use the experimental research.
The differences between Rakmanina’s study and the writer study are (1) the writer choose speaking skill in the study, meanwhile Rakhmanina chose grammar in the study, (2) the population of Rakhmanina’s study was the seventh grade students of SMP N 1 Inderalaya, meanwhile the population of the writer’s study is the seventh grade students of SMP N 2 Tanjung Lago, Banyuasin, (3) the objectives of Rakhmanina’s study was to find out whether teaching grammar through Jazz Chants had a significant effect on the students’ grammar achievement or not, meanwhile the objective of the writer’s study is to find out whether or not there is a significant difference on students’ speaking achievement who are taught by using jazz chants startegy and who are taught by using strategy that used by teacher at the school to the seventh grade students of SMP N 2 Tanjung Lago Banyuasin.
C. Research Setting
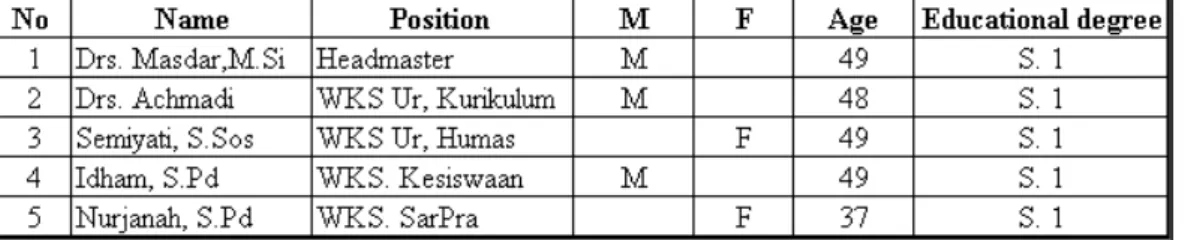
The writer conducted her research at SMP Negeri 2 Tanjung Lago, Banyuasin that was located on Jl. Tanjung Siapi-api KM 34. SMP Negeri 2 Tanjung Lago has been built in 1984. The present headmaster of SMP Negeri 2 Tanjung Lago is Drs. Masdar, M.Si. The total number of the teachers and staffs of SMP Negeri 2 Tanjung Lago are 44 person. The following table shows the data of the headmaster and the teachers of SMP N 2 Tanjung Lago.
Table 1 Headmaster
Source: Administration of SMP N 2 Tanjung Lago
Table 2
Total Teachers and Staff of SMP N2 Tanjung Lago
Source: Administration of SMP N 2 Tanjung Lago
This school has 14 classrooms which are permanent building with the total of the students in academic year 2013/2014 are 441 students. There are some facilities in this school, such as Mushalla, library, school healt center, language laboratory, science laboratory, computer laboratory and toilets. In addition, this school has one headmaster room, one teachers room, and one administration room.
Table 3
The Data of the Students and Classroom for Four Years
Source: Administration of SMP N 2 Tanjung Lago Table 4
The Data of Facility and Other Rooms
Source: Administration of SMP N 2 Tanjung Lago
CHAPTER III
METHODS AND PROCEDURES
This chapter presents: (a) method of the study, (b) operational definitions (c) variables of the study, (d) population and sample, (e) techniques for collecting data, and (f) techniques for analyzing data.
A. Method of Research
Experiment refers to any action on process designed to find out whether something is effective, workable, and valid. According to Greenwod in Singh ( 2006:135), experiment is the proof of a hypothesis which seeks to make up two factors into a casual relationship through the study of contrasting situations which have been controlled on all factors the one of interest, the latter being either the hypothetical cause or the hypothetical effect. In order to find the necessary data related to the research, the writer herself conducted the experiment of teaching speaking by using jazz chants strategy to the seventh grade students of SMP N 2 Tanjung Lago Banyuasin.
In conducting her study, quasi-experimental with pre-test and post-test non-equivalent group designs was used. The non-equivalent group design with pretest and posttest is suggested by Best and Khan (1995: 151) is as follows:
O1 X O2
O3 C O4
Where:
O1 : Pre-test of experimental
X : Treatment (Jazz Chants Strategy) O2 : Post-test of experimental
O3 : Pre-test of control group
C : Strategy that used by teacher at the school O4 : Post-test of control group.
B. Research Variables
In this study there were two kinds variables, those are independent variables and dependent valiable. Best and Kahn (1995:137) state that variables are the conditions or characteristics that the experimenter manipulates, controls or observes.
Independent variable is the major variable which you hope to investigate ( Hatch and Farhady,1982:15). In this study, the independent variable of the study were Jazz Chants strategy and the strategy that used by teacher at the school.
Dependent variable is the variable which you observe and measure to determine the effect of the independent variable ( Hatch and Farhady,1982:15). In this study, the dependent variable of the study was students’s speaking achievement.
C. Operational Defintions
The title of this study is “teaching speaking by using jazz chants strategy to the seventh grade students of SMP N 2 Tanjung Lago”. The terms that need to explain are Teaching speaking, jazz chants, and students’ achievement.
Teaching speaking means teach the students to do communication orally.
The teacher helps the students to develop their ideas orally. The teachers are willing the students to be able to communicate fluently. Speaking fluently is the goal of teaching speaking.
Jazz Chants is a rhythmic expression of Standard American English as it occurs in situational contexts. The rhythmic expressions were recorded as a model that was imitated by the students in jazz tempo and beat. So Jazz Chants strategy is the strategy to practice the English utterances in short jazz beats that is easy to be followed by the students.
Students’ achievement is the achievement that the students need to achieve in particular skill. In this study the students need to achieve their ability in speaking skill. In this study, the measurement of the students’ speaking achievement is the score in pretest and posttest.
D. Population and Sample 1. Population
A population is a group of individuals who have the same characteristic (Creswell, 2012:142). The population of the research was the seventh grade students of SMP N 2 Tanjung Lago 2013-2014 consisted of five classes with 162 students. The distribution of the population can be seen in table 5.
Table 5
The Population of the research
No Classes Number of students
1. V11. A 33
2. V11. B 31
3. V11. C 32
4. V11. D 34
5. V11. E 32
Total 162
Source : Administration SMP N 2 Tanjung Lago in the academic year of 2013-2014
2. Sample
A sample is a group in a research study on which information is obtained (Frankel et.al, 2012:91). The sample consisted of the students from the population who are chosen to participate in the study. The total amount of population is 162 students which were divided into five classes, then two classes were selected as the sample.
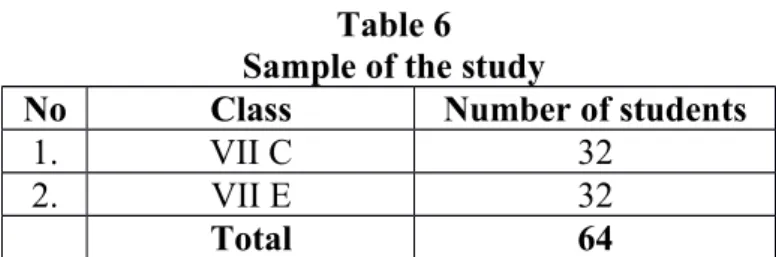
In this study, the writer used convenience sampling method. According to Creswell (2012:145), in convenience sampling the researcher selects participants because they are willing and available to be studied. The writer got two classes that was chosen by the headmaster of the school, those are VII C which was treated as control group and VII E which was treated as experimental group. The sample of the study was shown in Table 6.
Table 6 Sample of the study
No Class Number of students
1. VII C 32
2. VII E 32
Total 64
E. Technique for collecting the data
To obtain the data needed for the study, the writer collected them by giving test or exercise. The test that used by the writer was oral test instrument.
1. Tests
In this study, the writer gave oral test . According to Brown (2004:3), test in simple terms, is a method of measuring a person’s ability, knowladge, or performance in a given domain. There were two kind of tests, those are pretest and posttest. The pre-test used for starting point of the investigation and to know the students’ competence in speaking before they give treatment. Then, the post- test was given to find out the students improvement after the teacher give the treatment. In this process, the writer gave test item was form of oral test item, and 5 minutes as allocated time for each of the students to perform in front of class.
2. Research Instruments a. Content Validity
In this research, the writer also did a content validity to estimate the validation of the test. A test is said to have content validity if its content constitutes a representative sample of the language skills, structures, etc. with which it is meant to be concerned, ( Hughes, 1989:22). The writer estimates the content validity by the table of test specification which was appropriate for the material to the students. The material got from English in Focus book for Grade VII, published by Departemen Pendidikan Nasional (2008).
Table 7
Table of test specification N
o Objective Material Indicator
Numbe r of Items
Type of Test 1. The students
are able to :
Response the utterance correctly.
Use the correct utterance in appropriate situations
Discussions of the topic:
Indicator of the study:
1
Oral Test
Greetings
The students are able to response greeting.
The students are able to use the correct utterance in appropriate situations.
Expressing of politeness
The students are able to response the politeness expression.
The students are able to use the correct utterance in appropriate situations.
1
Asking and giving information
The students are able to asking
and giving
information.
The students are able to use the correct utterance in appropriate situations.
1
Command expression
The students are able to use command expression.
The students are able to use the correct utterance in appropriate situations.
1
Apologizing The students are able to response the aologize expression and
1
speak in front of the class.
The students are able to use the correct utterance in appropriate situations.
Expressing thanking
The students are able to response the expresing thanking or gratitude and speak in front of the class.
The students are able to use the correct utterance in appropriate situations.
1
Total 6
b. Reliability of the test
Reliability refers to the consistency of the scores obtained how consistent they are for one administration of an instrument to another and from one set of items to another (Fraenkel et. al, 2012:154). Reliability means the stability of the test score.
To find out the reliability of the test, the writer held the try out test to give to non sample students. The writer conducted the try-out before the test. The witer used inter-reater reliability to know whether the test is reliable or not. Inter-rater reliability occours when two or more scores yield inconsistent scores of the same test, possibly for lack of attention to scoring criteria, inexperience, inattention, or even preconceived biases ( Brown, 2004:21). In addition, Phelan and Wren (2005:
2) state that inter-rater reliability is a measure of reliability used to assess the degree to which different judges or raters agree in their assessment decisions.
There were two raters in scoring students’ speaking test, they were Dewi Ashma, S. Pd and Revi, S. Pd. . The writer had done try out of oral test instruments, in July 22, 2013 at SMP Nurul Amal Palembang to the seventh grade students with 31 students.
The scoring system that used in this study was speaking scoring rubric suggested by Hughes (1989:111).There were six components that should be scored, those were pronunciation (2-15), grammar (5-25), vocabulary (3-20), fluency (3-20), comprehension (3-20). The scorers of students’ speaking test was calculated by two raters. Then the two sets of score are calculated by using rank order correlation formula suggested by Hatch and Lazaraton (1991:453) to find out whether or not the instruments are reliable. The formula is shown as follow:
Where:
ρ : Spearman rank-order correlation (Rho) d2 : Different Score
N : The Number of the Students
The result of try out for speaking test to the 31 students of SMP Nurul Amal Palembang was described in the following table:
ρ = 1 – 6x(∑ d2) N(N2−1)
Table 8
The distribution of Students’ Speaking Score in Reliability of the Test
The Spearman’s rank order correlation was calculated to find the differencess between the two sets of rankings, the results of calculation is as follows:
ρ = 1 – 6x(∑ d2) N(N2−1) ρ = 1 – 6x1101.25
31(312−1) ρ = 1 – 6607.5
31(960)
ρ = 1 – 6607.5 29760 ρ= 1 – 0.22 ρ= 0.78
Based on the calculation of students’ speaking score in reliability test, it found 0.78 as the result. It can be stated that the score of the try out test was considered reliable. The test would be reliable if the result of the data measurement was higher than 0.70. According to Franken et. al, (2012:157) for the purpose a rule of thumb is that reliability should be at least 0.70 and preferably higher.
3. Research Treatment
Research treatments were done for twelve meeting, started from September 26, 2013-October 26, 2013. In this study, the writer gave the treatment by applying jazz chants strategy in the teaching of speaking. In this part, the writer presented the schedule of research treatment including the number, topics, themes and time allocation of her research treatments. The table of teaching materials for research treatments was shown in Table 9.
Table 9
Schedule of Teaching Materials for Research Treatment N
o
Day/date Topic/material Treatment meeting
Theme Time
allocations 1 Thu /Sep
26, 2013
Greetings 1 st Nice to meet
you
1x40
2 Tue /Oct Greetings 2 nd How’ve you 1x40
01, 2013 been 3 Wed /Oct 02,
2013
Command expressions
3 rd Buy ticket 1x40
4 Thu / Oct 03, 2013
Command expressions
4 th Wake up!
Wake up!
1x40 5 Tue / 0ct
08, 2013
Expression gratitude or thank
5 th I got engage 1x40 6 Wed/ Oct
09, 2013 Expression
gratitude or thank 6 th Thanks a lot 1x40 7 Thu/ Oct
10, 2013 Expression
apology 7 th I’m sorry
but... 1 x 40’
8 Tue/ Oct 15, 2013
Expression apology
8 th I’m sorry taht’s all
right
1 x 40’
9 Wed/ Oct
16, 2013 Expressions
politeness 9 th May I switch
off the light 1 x 40’
10 Thu/ Oct 17, 2013
Expressions politeness
10 th Add some salt and
pepper
1 x 40’
11 Tue/ Oct
22, 2013 Asking and giving
information 9 th Basic
questions 1x40 12 Wed/ Oct
23, 2013
Asking and giving information
10 th Banker’s wifes blue
1x40
F. Techniques for Analyzing Data
For anlyzing the data, the writer used SPSS (Statistic Package for the Social Science). Version 16.0. The writer got the data from pre-test and post-test between two groups experimental and control groups. Then the writer presented the data by using some steps and techniques as follows:
1. The Analysis of Sudents’ Pretest and Posttest Scores in Control Group 1.1 The Analysis of Students’ Pretest Scores in Control Group
a. Distributions of Frequency Data on Students’ Pretest Scores in Control Group
Distributions of frequency data, the students’ scores are described by presenting a number of student who can got a certain score, and its score’s percentage. In this part, the distributions of frequency data are got from students’ pretest score in control group. Then, the distribution of data was displayed in the table of analysis.
b. Descriptive Statistic on Students’ Pretest Scores in Control Group.
In this part, the data is obtained to get the lowest score (minimun), the highest score (maximum), mean score and the score of standard deviation. Descriptive statistics were got from students’ pretest score in control group.
c. Normality Test of Students’ Pretest Score in Control Group Normality test is used to measure the obtained data whether it is normal or not. According to Basrowi and Soenyono (2007:85) the data is obtained from students’ pretest in control The data can be classified into normal when p-output was higher than 0.025. In analyzing the normality test, 1-sample kolmogronov-smrinov test is used.
1.2 The Analysis of Students’ Posttest Scores in Control Group
a. Distributions of Frequency Data on Students’ Posttest Score in Control Group.
Distributions of frequency data, the students’ scores are described by presenting a number of student who can got a certain score, and its
score’s percentage. In this part, the distributions of frequency data are got from students’ posttest score in control group. Then, the distribution of data was displayed in the table of analysis.
b. Descriptive Statistic on Students’ Posttest Scores in Control Group
In this part, the data is obtained to get the lowest score (minimun), the highest score (maximum), mean score and the score of standard deviation. Descriptive statistics were got from students’ posttest score in control group.
c. Normality Test on Students’ Posttest Scores in Control Group Normality test is used to measure the obtained data whether it is normal or not. According to Basrowi and Soenyono (2007:85) the data is obtained from students’ posttest in control The data can be classified into normal when p-output was higher than 0.025. In analyzing the normality test, 1-sample kolmogronov-smrinov test is used.
2. The Analysis of Students’ Pretest and Posttest Scores in Experimental Groups
2.1 The Analysis of Students’ Pretest Scores in Experimental Group a. Distributions of Frequency Data on Students’ Pretest Scores in
Experimental Group
Distributions of frequency data, the students’ scores are described by presenting a number of student who can got a certain score, and its score’s percentage. In this part, the distributions of frequency data
are got from students’ pretest scores in experimental group.. Then, the distribution of data was displayed in the table of analysis.
b. Descriptive Statistic on Students’ Pretest Scores in Experimental Group
In this part, the data is obtained to get the lowest score (minimun), the highest score (maximum), mean score and the score of standard deviation. Descriptive statistics were got from students’ pretest scores in experimental group.
c. Normality Test on Students’ Pretest Scores in Experimental Group
Normality test is used to measure the obtained data whether it is normal or not. According to Basrowi and Soenyono (2007:85) the data is obtained from students’ pretest in experimental group. The data can be classified into normal when p-output was higher than 0.025. In analyzing the normality test, 1-sample kolmogronov- smrinov test is used.
2.2 The Analysis of Students’ Posttest Scores in Experimental Group a. Distributions of Frequency Data on Students’ Posttest Scores In
Experimental Group
Distributions of frequency data, the students’ scores are described by presenting a number of student who can got a certain score, and its score’s percentage. In this part, the distributions of frequency data
are got from students’ posttest scores in experimental group.. Then, the distribution of data was displayed in the table of analysis.
b. Descriptive Statistic On Students’ Posttest Scores In Experimental Group
In this part, the data is obtained to get the lowest score (minimun), the highest score (maximum), mean score and the score of standard deviation. Descriptive statistics were got from students’ posttest scores in experimental group.
c. Normality Test on Students’ Posttest Scores in Experimental Group
Normality test is used to measure the obtained data whether it is normal or not. According to Basrowi and Soenyono (2007:85) the data is obtained from students’ pretest in control The data can be classified into normal when p-output was higher than 0.025. In analyzing the normality test, 1-sample kolmogronov-smrinov test is used. In this part, the normality test is used to measure students’
posttest in experimental group.
3. Homogeneity analysis
a. Homogeneity Test on Students’ Pretest Scores in Control and Experimental Groups
Homogenity test is used to measure the obtained data whether it is homogen or not. The data can be categorized homogenous whenever it is
higher than 0.05 (Basrowi and Soenyono, 2007:106). The obtained data are achieved from students’ pretest scores in control and experimental groups. In analyzing the homogenity test, levene statistics in SPSS is used.
b. Homogeneity Test of Students’ Posttest Scores in Control and Experimental Groups
Homogenity test is used to measure the obtained data whether it is homogen or not. The data can be categorized homogenous whenever it is higher than 0.05 (Basrowi and Soenyono, 2007:106). The obtained data are achieved from students’ posttest scores in control and experimental groups. In analyzing the homogenity test, levene statistics in SPSS is used.
4. The Result of Independent T-Test Analysis.
In measuring means significant difference between students’ postest scores in control and experimental groups, the writer used an independent sample t-test to compare score of students’ posttest in experimental and control groups.
Significant difference is found whenever the p-output is lower than mean significant difference at 0.05 levels.
CHAPTER IV
FINDING AND INTERPRETATION
This chapter presents (a) Finding of the Study, (b) Interpretation of the study are presented.
A. Finding of the Study
The findings of the study were; (1) analysis of pretest and posttest in control group; (2) analysis of pretest and posttest in experimental groups (3) homogeneity analysis; (4) result of hypohesis testing.
1. The Analysis of Pretest and Posttest in Control Group
Analyzed data in control group were; (1) analysis data of pretest in control group, (2) analysis data of posttest in control group.
1.1 The analysis data of students’ pretest scores in control group
Analyzed data in pretest control group, the score were obtained were; (1) distributions of frequency data in pretest sores in control group; (2) descriptive
statistic of students’ pretest scores in control group; (3) Normality Analysis Scores in Pretest Control Group.
a. Distribution of frequency data on students’ pretest scores in control group
In distribution of frequency data, it was found that there were 1 student (3.1%) who got 48, 2 students ( 6.2%) who got 50, 1 student ( 3.1%) who got 52, 1 student (3.1%) who got 53, 3 students (9.4%) who got 55, 1 student (3.1%) who got 57, 2 students (6.2%) who got 58, 7 students(21.9%) who got 60, 1 student (3.1%) who got 61, 2 students (6.2%) who got 62, 1 student (3.1) who got 63, 2 students (6.2%) who got 65, 1 student (3.1%) who got 66, 3 students (9.4%) who got 72, 2 students (6.2%) who got 75, and 2 students (6.2%) who got 76.
The result of the pretest scores in control group was described in Table 10.
Table 10
Distribution of Frequency Data on Students Pretest scores In control Group
Statistics
PRE_CONTROL
N Valid 32
Missing 0
PRE_CONTROL
Frequency Percent Valid Percent
Cumulative Percent
Valid 48 1 3.1 3.1 3.1
50 2 6.2 6.2 9.4
52 1 3.1 3.1 12.5
53 1 3.1 3.1 15.6
55 3 9.4 9.4 25.0
57 1 3.1 3.1 28.1
58 2 6.2 6.2 34.4
60 7 21.9 21.9 56.2
61 1 3.1 3.1 59.4
62 2 6.2 6.2 65.6
63 1 3.1 3.1 68.8
65 2 6.2 6.2 75.0
66 1 3.1 3.1 78.1
72 3 9.4 9.4 87.5
75 2 6.2 6.2 93.8
76 2 6.2 6.2 100.0
Total 32 100.0 100.0
b.Descriptive statistic on students’ pretest scores in control group
In descriptive statistics on students’ pretest in control group, it was found that the total number of students were 32
with the minimum score was 48.00, the maximum score was 76.00, mean score was 61.9688, and the score of standard deviation was 7.87599. The result analysis of descriptive statistics of students’ pretest scores in control group was described in Table 11.
Table 11
Descriptive Statistics on Students’ Pretest Scores In Control Group
Descriptive Statistics
N Minimum Maximum Mean Std. Deviation
pre_control 32 48.00 76.00 61.9688 7.87599
Valid N (listwise) 32
c. Normality test on students’ pretest scores in control group
After the data obtain was measured to the 32 students in control , it was found that the normality score on students’
pretest score in control group was 0.735. From the result of the output, it can be stated that the students’ scores of pretest in control group was normal. Since it was higher than mean significance different at 0.025. Then, a table of analysis was figure out in Table 12.
Table 12
Normality Test of Students’ Pretest Scores In Control groups
One-Sample Kolmogorov-Smirnov Test
pre_control
N 32
Normal Parametersa Mean 61.9688
Std. Deviation 7.87599
Most Extreme Differences Absolute .130
Positive .130
Negative -.117
Kolmogorov-Smirnov Z .735
Asymp. Sig. (2-tailed) .652
a. Test distribution is Normal.
1.2 The analysis data of students’ posttest scores in control group
Analyzed data in posttest control group, the score were obtained were; (a) distributions of frequency data in posttest sores in control group; (b) descriptive statistic of students’ posttest scores in control group; (c) Normality Analysis Scores in Posttest Control Group.
a. Distributions of frequency data on students’ posttest sores in control group
In distribution of frequency data, it was found that there were 2 students (6.2%) who got 52, 4 students (12.5% ) who got 55, 7 students ( 21.9%) wo got 60, 1 student (3.1%) who got 61, 3 students ( 9.4%) who got 62, 1 student (3.1%) who got 63, 1 student ( 3.1%) got 64, 3 students ( 9.4%) who got 65, 1 student (3.1%) who got 67, 1student (3.1%) who got 68, 1 student (3.1%) who got 70, 1 student (3.1%) who got 71, 2 students (6.2%) who got 76, 3 students (9.4%) who got 78, and 1 student (3.1%) who
got 79. The result of the posttest scores in control group was described in Table 13.
Table 13
Distribution of Frequency Data on Students Posttest scores In control Group
Statistics
post_control
N Valid 32
Missing 0
POSTTEST_CONTROL
Frequency Percent Valid Percent
Cumulative Percent
Valid 52 2 6.2 6.2 6.2
55 4 12.5 12.5 18.8
60 7 21.9 21.9 40.6
61 1 3.1 3.1 43.8
62 3 9.4 9.4 53.1
63 1 3.1 3.1 56.2
64 1 3.1 3.1 59.4
65 3 9.4 9.4 68.8
67 1 3.1 3.1 71.9
68 1 3.1 3.1 75.0
70 2 6.2 6.2 81.2
71 1 3.1 3.1 84.4
76 1 3.1 3.1 87.5
78 3 9.4 9.4 96.9
79 1 3.1 3.1 100.0
Total 32 100.0 100.0
b. Descriptive statistic of students’ posttest scores in control group
In descriptive statistics on students’ posttest scores in control group, it was found that the total number of students were 32 with the minimum score was 52.00, the maximum score was 79.00, mean score was 64.0000, and the score of standard deviation was 7.72929. The result analysis of descriptive statistics in experimental group was described in Table 14.
Table 14
Descriptive Statistics on Students’ Posttest Scores In Control Group
Descriptive Statistics
N Minimum Maximum Mean Std. Deviation
posttest_control 32 52.00 79.00 64.0000 7.72929
Valid N (listwise) 32
c. Normality test on students’ posttest scores in control group
After the data obtain was measured to the 32 students in control , it was found that the normality score on students’
posttest in control group was 0.769. From the result of the output, it can be stated that the students’ scores of posttest in control group was normal. Since it was higher mean significance different at 0.025. Then, a table of analysis was figure out in Table 15.
Table 15
Normality Test of Students’ Posttest Scores In Control groups
One-Sample Kolmogorov-Smirnov Test
posttest_control
N 32
Normal Parametersa Mean 64.0000
Std. Deviation 7.72929
Most Extreme Differences Absolute .136
Positive .136
Negative -.115
Kolmogorov-Smirnov Z .769
Asymp. Sig. (2-tailed) .594
a. Test distribution is Normal.
2. The analysis of students’ pretest and posttest scores in experimental group
Analyzed data in control group were; (1) the analysis data of pretest in experimental group, (2) the analysis data of posttest in experimental group.
2.1 The analysis data of pretest in experimental group
Analyzed data in control group, the score were obtained were; (1) distributions of frequency data in pretest sores in experimental group; (2) descriptive statistic of students’ pretest scores in experimental group; (3) Normality Analysis Scores in Pretest experimental Group
a. Distribution of frequency data on students’ pretest scores in experimental group
In distribution of frequency data, it was found that there were 1 student (3.1%) who got 45, 1 student (3.1%) who got 48,
3 students (9.4%) who got 50, 1 student (3.1%) who got 53, 3 students (9.4%) who got 55, 1 student (3.1%) who got 57, 2 students (6.2%) who got 58, 3 students (9.4%) who got 60, 3 students (9.4%) who got 62, 1 student (3.1%) who got 63, 1 student (3.1%) who got 65, 1 student (3.1%) who got 67, 2 students (6.2%) who got 69, 1 student (3.1%) who got 70, 2 students (6.2%) who got 72, 2 students (6.2%) who got 75, 1 student (3.1%) who got 77, 1 student (3.1%) who got 78, and 2 students (6.2%) who got 79. The result of the pretest scores in experimental group was described in Table 16.
Table 16
Distribution of Frequency Data on Students Pretest scores In Experimental Group
Statistics
PRE_EXP
N Valid 32
Missing 0
PRE_EXP
Frequency Percent Valid Percent
Cumulative Percent
Valid 45 1 3.1 3.1 3.1
48 1 3.1 3.1 6.2
50 3 9.4 9.4 15.6
53 1 3.1 3.1 18.8
55 3 9.4 9.4 28.1
57 1 3.1 3.1 31.2
58 2 6.2 6.2 37.5
60 3 9.4 9.4 46.9
62 3 9.4 9.4 56.2
63 1 3.1 3.1 59.4
65 1 3.1 3.1 62.5
67 1 3.1 3.1 65.6
69 2 6.2 6.2 71.9
70 1 3.1 3.1 75.0
72 2 6.2 6.2 81.2
75 2 6.2 6.2 87.5
77 1 3.1 3.1 90.6
78 1 3.1 3.1 93.8
79 2 6.2 6.2 100.0
Total 32 100.0 100.0
b. Descriptive statistic of students’ pretest scores in experimental group In descriptive statistics on students’ pretest scores in experimental group, it was found that the total number of students were 32 with the minimum score was 45.00, the maximum score was 79.00, mean score was 62.8125, and the score of standard deviatio