INTRODUCTION
Choice of implant material
Sol gel prepared metal oxide coatings
Biocompatibility and cytotoxicity of coatings
Corrosion in biological environment
Electrochemical analysis
- Open circuit potential
- Linear Polarization resistance
Correlation of bioactivity and corrosion resistance
Infection during implanation
Sol gel coatings embedded with therapeutic drugs
Drug release experiments
Antibacterial study
NIOBIUM AND SILICON OXIDE COATED 316L FOR
- Introduction
- Materials and Methods
- Results
- Substrate and Coatings Structure, Morphology and Composition (pre-SBF
- Substrate and Coatings Structure, Morphology and Composition (post-SBF
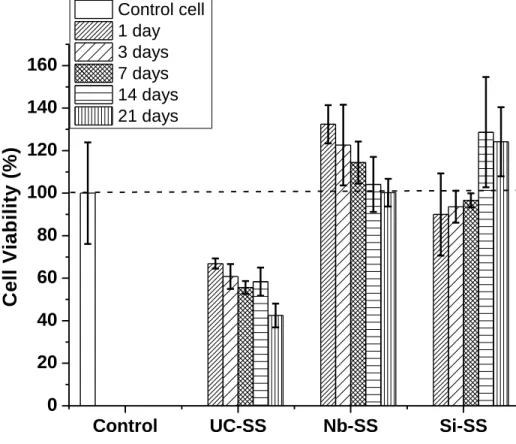
- Cell Viability Analysis
- Cellular Adhesion
- Discussion
- Processing of submicron oxide coatings on surface 316L substrates
- Bioactivity
- Osteoblast Cell Response
- Conclusion
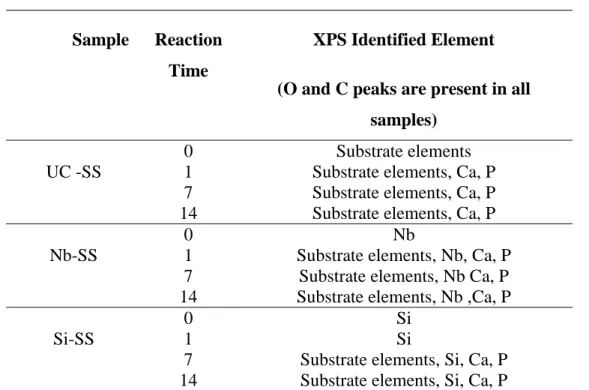
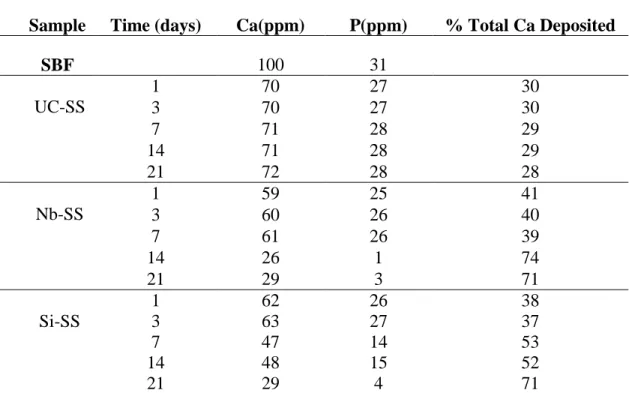
Qualitative surface composition of UC-SS, Nb-SS and Si-SS after reaction in SBF for different time periods.
CORROSION BEHAVIOR OF NIOBIUM AND SILICON OXIDE
Preparation of substrate
Sol preparation and film deposition
Preparation of corrosive media
Surface Characterization of Coatings
- Scanning Electron Microscopy/Energy-Dispersive X-ray spectroscopy
- X-ray Photoelectron Spectroscopy (XPS) analysis
Electrochemical measurements of the coatings
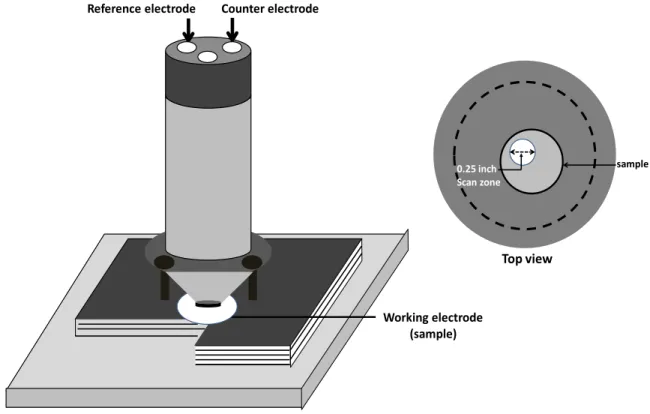
- Electrochemical Cell Set-up
- Open Circuit Potential (OCP)
- Measurement of Linear Polarization resistance (LPR)
The base of the cylinder consisted of a circular hole with a diameter of ~6.35 mm, through which the selected area of the sample surface was exposed to the electrolyte. During each measurement of this study, the working electrode/sample was mounted exposing a geometric surface of 0.32 cm2 to the corrosive media. A PTFE top was placed over the cell and the reference electrode (RE) and counter electrode (CE) were placed through holes in the top.
An Ag/AgCl reference electrode with 1 cm2 surface areas and standard platinum counter electrode wire was inserted into the electrolyte chamber. Measurements were taken from three individual circular sections on the sample surface with the same geometric surface area. The linear polarization resistances (Rp) were determined at scan rate of 0.1 mVs-1 within the potential range -20 to 20 mV vs. EOCP.
It is a simple technique in which the sample is immersed in electrolyte and the measurements are recorded for a period of time until a stable potential value is obtained. The polarization resistance of a material is defined as the slope of the potential-current density at corrosion potential (Ecorr). B is the Stern-Geary constant, Rp is the polarization resistance and icorr is the corrosion current.
The proportionality constant, B, for a given system can be determined from ba and bc, the slopes of the anodic and cathodic Tafel. The LPR value is referred to as Rp and is related to the corrosion current through. The default values for Ba and Bc in the previous equation can be considered 120 mV/decade.
Considering that the test is performed on samples with equal surface area, the highest Rp value (lowest corrosion rate) corresponds to higher corrosion resistance.
Results
- Characterization Pre-immersion in test Media
- Uncoated stainless steel
- Niobium oxide
- Silicon oxide
- Characterization Post-immersion in test Media
- Changes in morphology and surface eemental composition
- Electrochemical analysis
- Validation of LPR data
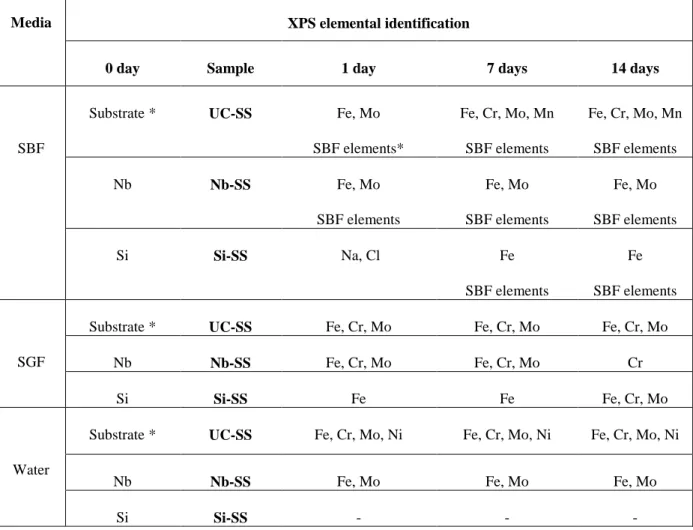
Elemental composition of UC-SS, Nb-SS and Si-SS after immersion in SBF, SGF and water for 1, 7 and 14 days. Figure 3(a) & (d) showed the surface morphology and corresponding XPS spectrum of UC-SS after immersion in water for 7 days. Figure 3(b) & (e) shows the surface morphology and corresponding XPS spectrum of Nb-SS after immersion in water after 7 days.
Figure 3(c) and (f) show the surface morphology and corresponding XPS spectrum of Si-SS after immersion in water after 7 days. Figure 4(a) and (d) show the surface morphology and corresponding XPS spectrum of UC-SS after incubation in SBF for 7 days. The peaks obtained in XPS survey scans of UC-SS after 1 day of immersion in SBF were identified as Fe, Mo (substrate elements), Ca, P and some other elements (Na, Mg, Cl, K) deposited from SBF.
Figure 4(b) and (e) show the surface morphology and corresponding XPS spectrum of Nb-SS after incubation in SBF for 7 days. Peaks observed in XPS scans for Nb-SS after 1–21 days of immersion in SBF were identified as Fe, Mo (from the substrate), Ca, P and other “SBF elements”. Figure 4(c) and (f) show the surface morphology and corresponding XPS spectrum of Si-SS after incubation in SBF for 7 days.
FESEM images of (a) UC-SS (b) Nb-SS (c) Si-SS after 7 days of immersion in SBF and their corresponding XPS survey scans. Figure 6(b) and (e) show the surface morphology and corresponding XPS spectrum of Nb-SS after 7 days of immersion in SGF. Figure 6(c) and (f) show the surface morphology and corresponding XPS spectrum of Si-SS after 7 days of immersion in SGF.
The XPS study scans for Si-SS after 1 day of reaction in SGF identified peaks for Fe from substrate After 3 days, peaks for both Fe &. OCP and Ecorr values with respect to Ag/AgCl for UC-SS, Nb-SS and Si-SS after immersion in SBF, SGF and water for 1–21 days. Corrosion rate of UC-SS, Nb-SS and Si-SS after immersion in SBF, SGF and water for 1-21 days.
Discussion
- Preparation of substrate and coatings
- Reaction of samples in water
- Reaction of samples in SBF
- Reaction of samples in SGF
In this case, there is a possibility that the Mo complex is formed in those nanopores where water can cause Fe dissolution and therefore the Rp value is high. A high Rp value indicated that the coating was intact and durable during immersion. However, the value of Rp for 1-7 days did not drop drastically, which could be due to the presence of Mo.
This may have caused the presence of Fe & Mo peaks in XPS after 1 day. Furthermore, the presence of Ca and P peaks after 1 day confirmed the biocompatibility of the Nb-SS surface. The increase in Rp value after 3 days can be attributed to the presence of the CaP layer, which limited the interaction of Fe with SBF.
Therefore, although the CaP layer is still predominant between 3–7 days, the Rp value decreased after 7 days due to dissolution of Fe from microcracks on freshly exposed substrate. This is supported by highest Rp value, which acted as a strong barrier preventing the dissolution of Fe ions in the physiological fluid. The degradation of films can be facilitated by the formation of small holes on the surface, presumably due to the presence of Cl ions.
It shows that the presence of a barrier layer on UC-SS can limit dissolution of Fe. The presence of Cr, Mo and Fe together with Nb after 1–3 days indicated that the underlying substrate interacting with SGF did not allow easy dissolution of Fe into the solution. Although the damage due to pitting is evident, the total area fraction of pitting was estimated to be negligible (not shown), as evidenced by the increase in the Rp value after 3 days.
This is evident from the presence of only Cr peaks in XPS scans after 14 days. This layer will interact with SGF at a different rate, evident by drop in Rp value. Finally, after 21 days, the presence of Mo and Cr limits the dissolution of Fe causing an increase in Rp value.
Conclusion
This results in Fe, Mo and Cr substrate ions detected in XPS on the surface after 14 days. Hansen, "Corrosion of metals in the human body: the ultimate bio-corrosion scenario," The Electrochem.Soc. Hiromoto, "Electrochemical Study of Type 304 and 316L Stainless Steels in Simulated Body Fluids and Cell Cultures."
Chu, “Corrosion behavior and electrical conductivity of 316L stainless steel implanted niobium used as bipolar plates in polymer electrolyte membrane fuel cells,” Surf. 34; Improvement of osseointegration and bone-implant interface by incorporating bioactive particles into sol-gel coatings of stainless steel implants," Acta Biomaterialia. Li, "Electrochemical Corrosion Behavior of 300M Ultra High Strength Steel in Chloride-Containing Environment,” Acta Metall.
Men, "Influence of lepidocrocite film formed in situ on the corrosion behavior of weathering steel in the solution without Cl", Int.
SOLGEL PREPARED NIOBIUM OXIDE COATINGS ON 316L
- Coating Processing and Deposition
- Coating Release of Erythromycin
- Coating Performance vs. S. aureus
- Results and Discussion
- Coating Processing and Deposition
- Conclusion
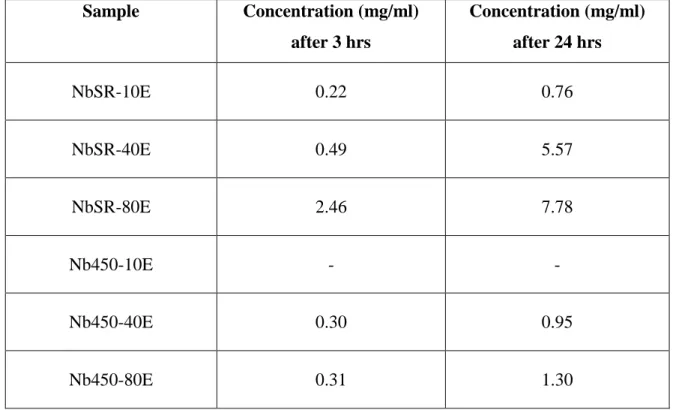
The release of erythromycin in PBS was measured using UV-Vis spectroscopy, and short-term antibacterial properties were analyzed for 3 and 24 hours. The concentration of erythromycin released in PBS after 3 and 24 h as a function of processing method, erythromycin concentration and immersion time is shown in Table I. For IWIR coatings with 40 and 80 mg/l erythromycin, the released concentration was found. to increase with higher loading concentrations after 24 hours.
The release of erythromycin in PBS for both SR and IWIR coatings increased with immersion time. Concentration of erythromycin released from coatings after 3 and 24 hours of immersion in PBS as determined using UV-Vis spectrophotometer. For SR coatings, the reduction in bacterial viability was highest for NbSR-80E coatings (~63%) and lowest for NbSR-10E (~19.3%) after 24 hours compared to the control.
SR coatings were observed to provide greater bacterial resistance compared to IWIR coatings for both 3 and 24 hours. From the SEM image, it is clear that the dark spots are more prominently present on the surface of UC-SS than SR and IWRI coatings for both 3 and 24 h. Under SR coatings, the area covered by dark spots was relatively larger for NbSR-10E surface than both NbSR-40E and NbSR-80E for both 3 and 24 h.
For the IWRI coatings, the area covered by dark spots was relatively larger for the Nb450-10E surface than for both Nb450-40E and Nb450-80E for both 3 and 24 hours. The SEM images indicated that the appearance of dark spots decreased significantly after 24 hours instead of after 3 hours. The release from SR coatings containing 80 mg/mL erythromycin was greater than MIC (0.5 mg/mL) after 3 hours and was highest among all drug-loaded coatings after 24 hours.
This is consistent with an antibacterial study where coatings with 80 mg/l erythromycin showed maximum reduction in bacterial viability and bacterial adhesion to the surface after 24 hours. The release from IWRI coatings containing 10 mg/ml erythromycin was undetectable after 3 and 24 hours and the release from 40 and 80 mg/ml erythromycin was virtually identical. For both SR and IWIR coatings, the concentration of erythromycin released increased with immersion time and, accordingly, antibacterial properties were higher after 24 hours.


![Table II. Ratio of Cr/Fe on Surface of UC-SS in Different Environments for 1-21 Days Ratio of [Cr/Fe] from XPS spectra](https://thumb-ap.123doks.com/thumbv2/123dok/10519243.0/64.918.146.825.145.442/table-ratio-surface-different-environments-days-ratio-spectra.webp)

