This shows that there is any positive and significant influence of Buzz Group technique on the speaking performance of students in the eighth grade of SMPN 5 Metro. This undergraduate thesis entitled "The effect of using the Buzz Group technique on the speaking performance of students in the eighth grade of SMPN 5 Metro.".
Problem Identification
Another case of students speaking performance of the eight grade of SMP N 5 Metro is: (1) the student has a low motivation in the English Learning Process; (2) The student struggles to explore their idea in English; (3) they lack vocabulary. Based on the problem above, the author will conduct a research with the title The influence ofusing Buzz Group technique on the students'.
Problem Limitation
Problem Formulation
The Objectivesand Benefits of the Research 1. The objectives
A speaking performance measure or a discourse analytical measure is defined, adapted from Ellis, as a measure derived from the quantification of target aspects in utterances and computational values that reflect a certain dimension of language use (e.g. the number of error-free clauses divided by the number of clauses for accuracy).6. Based on the statement above, the researcher can conclude that there are five variations of Buzz group.
Hypothesis Formulation
On the contrary, if the Buzz Group technique is poor and the students' speaking performance is poor, then there is no positive and significant effect of using the Buzz Group technique on the students' speaking performance.
Statistical Hypothesis
According to Daniel Muijs, quantitative research is research that explains phenomena by collecting numerical data that will be analyzed using mathematically based methods (in particular statistics)18. According to Daniel, experimental designs are known as the "scientific method" because of their popularity in the scientific research from which they originated.19.
Population and Sampling Technique 1. Population
Sample
A sample is a part of a population that is taken as a source of data and may represent the entire population. The sample of this research will be taken by two classes namely experimental class and control class. The sample of this research is 29 students as experimental class which is 8.B class and control class is 8.C class.
Sampling Technique
The Operational Definition of Variables
Independent Variables
Dependent Variable
The students are able to express and explore their background knowledge and ideas through speaking.
Data Collection Method
- Observation
- Test
- Tape Recording
- Documentation
Arsenault concluded that “the instrument includes a test and questionnaire, an observation schedule, and any other tool used to collect data.”26 Test is a means used to measure a person's ability or knowledge in a particular domain. The pre-test is held in the first pre-treatment meeting to know the ability of the students before doing the action research. The post-test is held in the last meeting after doing treatments to find out if the treatment makes any contribution to the students' performance in class or if there is a significant difference between the scores of the experimental class and the control class .
A tape recording is made when the student speaks in front of the class, to know how they speak, the teacher can easily give a value. Documentation is a method used to find data about things or variables in the form of notes, transcripts, books, newspapers, magazines, inscriptions, minutes of meetings, agenda. The researcher used this method to obtain data on the history of the school, the conditions of teachers and official employees, the number of students and the organizational structures of SMP N 5 METRO.
Research Instrument
Instrument Blueprint
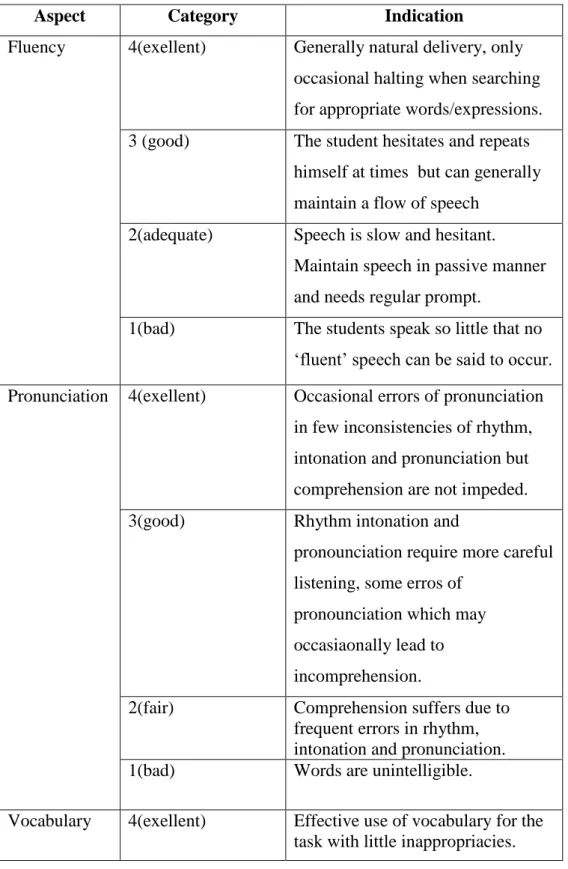
Based on the criteria above, the researcher used the assessment indicators integrated with the standard scores whose validity and reliability were tested to measure students' speaking performance. 3 (good) The student hesitates and repeats himself at times, but can generally maintain a flow of speech. Pronunciation 4 (excellent) Occasional pronunciation errors in few inconsistencies of rhythm, intonation and pronunciation, but understanding is not hindered.
3(good) Mostly effective use of vocabulary for the task, some examples not appropriate. 3(good) Some errors in the use of sentence structures and grammatical forms, but these do not interfere with understanding. 3(good) The use of interactive strategies is generally adequate, but sometimes there are difficulties in maintaining the interaction.
Instrument Calibration
Data analysis Technique
Research Setting
The research was conducted in SMP N 5 Metro located at Rejomulyo, Metro Selatan, Lampung. At the beginning of the admission of new students, SMP Negeri 5 received 120 students because at that time there were only 3 classes built and until now SMP Negeri 5 has built 20 classes and has a student body of 614 students. Poniran, S.Pd as the sixth Headmaster (6), and next year 2012 is led by Suyono, S.Pd as the Head of School until the Seven and until now.
Achieve excellence in management, structuring and cultural care for a clean environment, healthy and asri (comfortable, cool, shady, beautiful).
Research Instrument
Research Data
Frequency distribution as a result of Experimental Class Pre-Test at eighth grade of SMP N 5 Metro. Based on the table of frequency distribution above, it can be deduced that most students got scores below 75. The graph of the frequency distribution of the table above described that the result of the students' pre-test scores (control class).
The data above shows that students' speaking performance was dissatisfied during the pre-test. The result of the control class of the students in the eighth grade of SMP N 5 Metro.
Frequency distribution as a result of the pre-examination of the control class in the eighth grade of SMP N 5 Metro. Based on the frequency distribution table above, we can conclude that most of the students scored below 75. From the above data, we can conclude that the speaking score of the students in the control class is better than the experimental one.
The researcher conducted post-test in the last session of the research to compare the students' speaking performance before and after a treatment was given. The result of the students' experimental class after testing in eighth grade in SMP N 5 Metro.
Frequency distribution as a result of experimental class after testing in eighth grade of SMP N 5 Metro. Based on the frequency distribution table above, it can be inferred that 22 (76%) students scored more than 75, which was the minimum criteria for mastery (MMC). Therefore, it can be inferred that the students' speaking performance was increased or, to put it simply, was good.
The frequency distribution graph of the table above described the result of the students' score after the test (experimental class). The result of the post-test of the control class students can be identified as follows. The result of the control class post test of students in the eighth grade of SMP N 5 Metro.
Frequency distribution as the result of the control class posttest in the eighth grade of SMP N 5 Metro. The graph of the frequency distribution in the table above described the result of the students' score after the test (control class). The above data shows that the speaking performance of the students in the post-test was good.
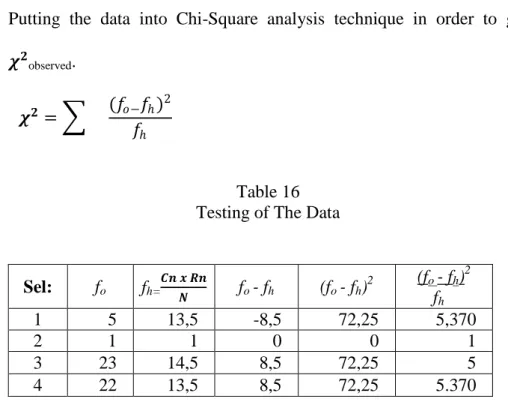
Hypothesis Testing
Moreover, after putting the above data into Chi-Square analysis, the researcher observed 𝝌𝟐 was 22.74.
Interpretations
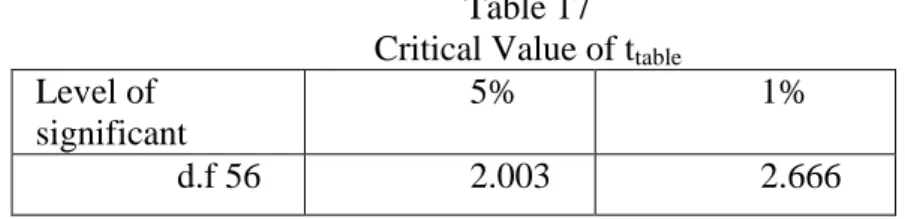
Interpretation of t observed
It can be concluded that there is a positive and significant influence of the use of Buzz Group technique on the students. The hypothesis applied in this current research is that the use of Buzz Group technique has a positive and significant influence on the students' speaking performance at the eighth grade of SMP N 5 Metro. This means that there is a positive influence of the use of Buzz Group technique on the students' speaking performance at the Eighth Grade of SMP N 5 Metro.
It can be inferred that there is a significant impact on students by using the Buzz Group technique. This means that there is a significant impact on students by using the Buzz Group technique. In other words, there is a positive and significant influence on the students by using the Buzz Group technique.
Suggestion
By using Buzz Group, students can become interested so that students become more active in the learning process. Furthermore, Buzz Group Technique can be solution for the teacher to teach the students about speaking performance, the students will be more active in the learning process. By using this technique, the teaching and learning process becomes more interesting, pleasant and relaxed, and all the students will participate actively in the teaching and learning process.
The students should be more active in learning English, if they do not understand the lesson delivered by their teacher, they should ask the teacher. Arifa Bunglowala, "Non-verbal communication: an integral part of the teaching learning process", (Bandung: International Journal of Research in Advent Technology), No March 2015, p. Wallen, How to Design and Evaluate Research in Education, New York: McGraw-Hill, 7th ed., 2009.
APPENDIXES
KOMPETENSI DASAR DAN INDIKATOR
MATERI PEMBELAJARAN
KEGIATAN PEMBELAJARAN
Siswa melihat gambar dan beberapa ekspresi tentang menghargai kinerja yang baik dan mengajukan pertanyaan dan mengungkapkan pendapat. Siswa memberikan komentar dan pandangan tentang fitur, tindakan, penghargaan hasil yang baik, dan mengajukan pertanyaan dan mengungkapkan pendapat. Siswa membaca lebih cermat semua ungkapan untuk menilai kinerja yang baik dan mengajukan pertanyaan dan mengungkapkan pendapat pada gambar untuk memberikan komentar dan pandangan tentang fungsi sosial, struktur teks, dan unsur kebahasaan.
Siswa membandingkan fungsi sosial, struktur teks, dan unsur kebahasaan dari berbagai ungkapan apresiasi terhadap penampilan yang baik, serta bertanya dan mengungkapkan pendapat. Siswa membuat kalimat ekspresi tindakan untuk menghargai kinerja yang baik, dan untuk bertanya dan mengungkapkan pendapat dalam bahasa Inggris untuk fungsi sosial yang nyata di kelas, sekolah dan rumah. Siswa mendiskusikan kesulitan-kesulitan yang dihadapi dalam membuat kalimat mengungkapkan tindakan menghargai kinerja yang baik, dan bertanya serta mengungkapkan pendapat dan menuliskannya dalam jurnal pembelajaran sederhana dalam bahasa Inggris.
METODE PEMBELAJARAN
MEDIA DAN ALAT PEMBELAJARAN
PENILAIAN HASIL PEMBELAJARAN K RITERIA P ENILAIAN
- Please come forward one by one in front of class!
- Please give your opinion about your school condition!
- Please speak up fluently!
- Please use good pronounciation!
- Please use suitable vocabulary!
- Please use grammar correctly!
- Please use comprehension!
- Please give your opinion about the theme below!
- Please tell us about the topics based on your group!
Pronunciation 3(good) Occasional pronunciation errors in few inconsistencies of rhythm, intonation and pronunciation, but understanding is not hindered. Tell us and give your opinion about "If the phone is used in the classroom".
The Document of The Research