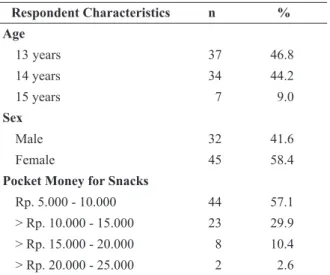
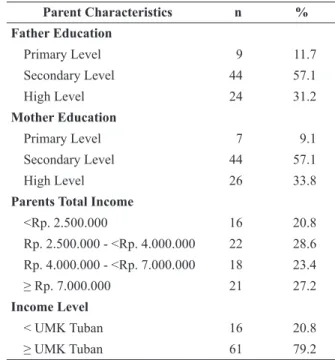
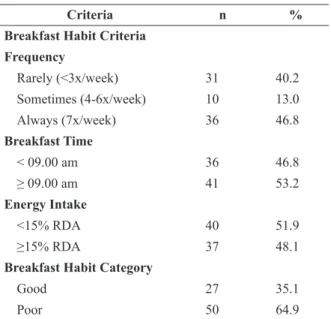
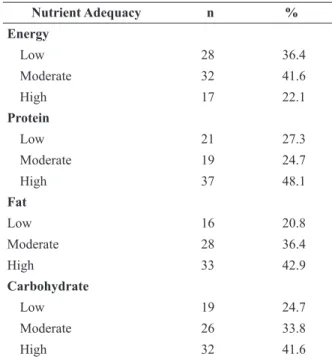
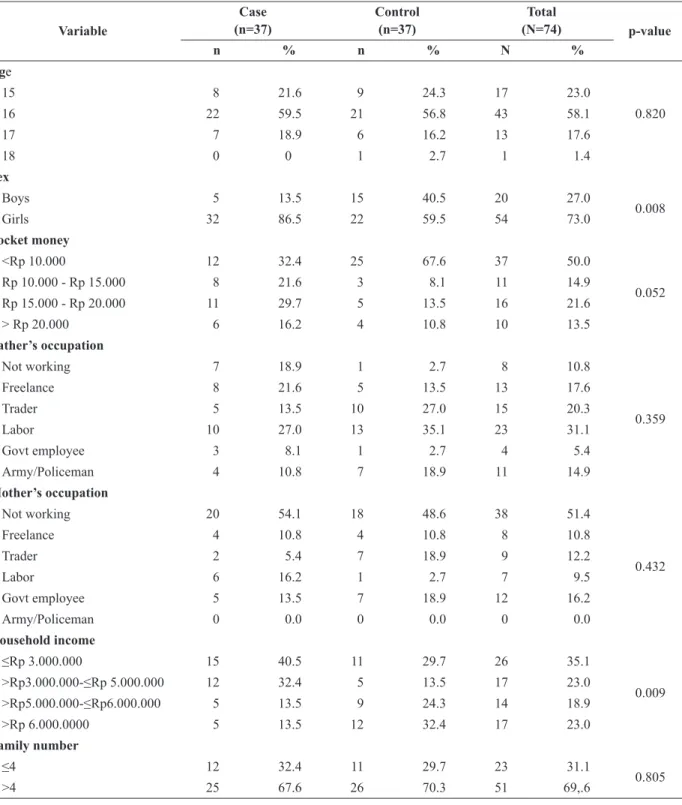
Most of the subjects in the control group and 50% of the subjects in the treatment group had normal nutritional status. Nutrition and health - the association between eating behavior and various health parameters: a matched sample study.
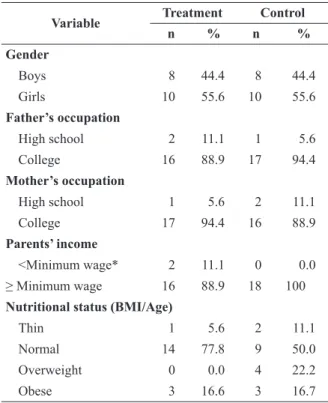
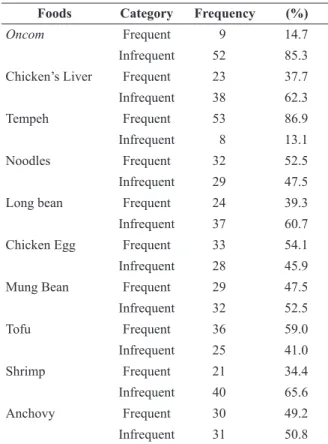
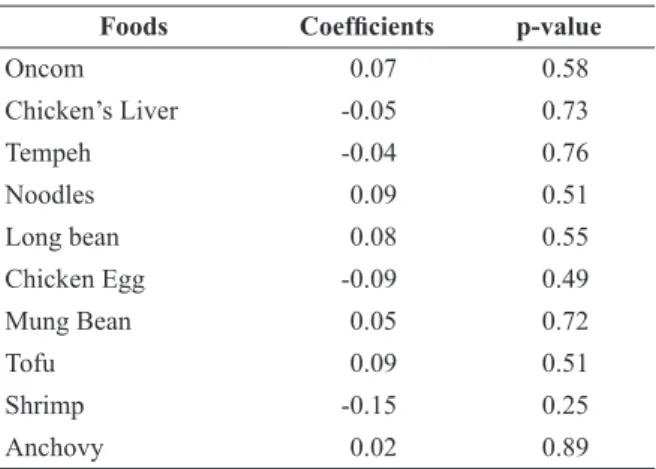
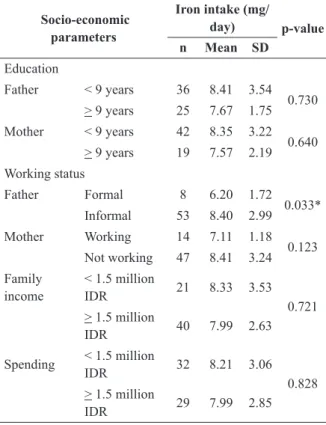
IRON INTAKE AMONG ADOLESCENT GIRLS BASED ON FAMILY SOCIO-ECONOMIC, FREQUENT HIGH-IRON FOODS CONSUMED
However, the impact of knowledge about anemia on iron intake in adolescent girls has not been fully investigated. However, this study found that there was a negative correlation between iron intake and knowledge of anemia (r=-0.259, p=0.043).
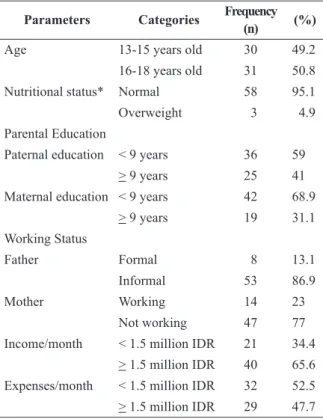
HOUSEHOLD FOOD INSECURITY IS ASSOCIATED WITH BINGE EATING DISORDER AMONG ADOLESCENT IN SEMAMPIR
DISTRICT, SURABAYA, INDONESIA
This study aims to analyze the relationship between household food security and eating disorder among adolescents in Semampir District, Surabaya, Indonesia. Household food security status was assessed using the Household Food Insecurity Access Scale (HFIAS) instrument. However, the presence of toddlers and the elderly among family members can increase the risk of food insecurity.
Based on Table 4, the food security variables are divided into two categories, namely food resistance and food insecurity. Due to the uncertain availability of food, physiological and psychological hunger can increase the likelihood of binge eating (West et al., 2019). The existence of a pattern of food restriction and binge eating is a cycle commonly experienced by many low-income people (Rasmusson et al., 2019).
Early-onset binge eating and purging eating disorders: course and outcome in a population-based study of adolescents. Gender and racial/ethnic differences in binge eating symptoms in a nationally representative sample of adolescents in the United States. Evidence and potential mechanisms for mindfulness practices and energy psychology for obesity and binge eating disorder.

SLEEP DURATION AND METABOLIC SYNDROME IN OBESE ADOLESCENTS
This study aimed to analyze the differences in sleep duration between obese adolescents with and without metabolic syndrome. There was no difference in sleep duration between obese adolescents with metabolic syndrome and adolescents without metabolic syndrome (p = 0.446). Chronic lack of sleep duration affects adipose tissue in children, which is associated with metabolic risks (Cespedes et al., 2014).
In this study, there was no difference in sleep duration between obese adolescents with or without metabolic syndrome (Table 2). Previous studies explaining the relationship between sleep duration and metabolic syndrome were mainly conducted in adolescents in European countries (Garaulet, et al., 2011b). Studies in Korea explained that there was no difference in metabolic syndrome in adolescents based on sleep duration (Seo & Shim, 2019).
There were no differences in sleep duration among obese adolescents with metabolic syndrome compared to obese adolescents without metabolic syndrome. The association of sleep duration with metabolic syndrome and its components in children and adolescents; propensity score matching analysis: the CASPIAN-V study. Associations of sleep duration with obesity and serum lipid profile in children and adolescents.

ACADEMIC STRESS IS ASSOCIATED WITH EMOTIONAL EATING BEHAVIOR AMONG ADOLESCENT
Therefore, this study aims to analyze the relationship between academic stress and emotional eating behavior among teenagers in SMAN 6 Surabaya. The independent variable in this study is academic stress, while the dependent variable is emotional eating behavior and frequency of food consumption. The Spearman correlation analysis in Table 7 shows that there is a significant relationship between academic stress and emotional eating behavior (p < 0.001).
A full 64.5% of students with high academic stress also experienced emotional eating, while only 28.8% of students with low academic stress experienced emotional eating. Emotional eating behavior is known to have a significant relationship with stress that comes from academic performance factors (Kim. and Kye 2017). The results of Penaforte's (2016) study conducted on students using a three-factor eating questionnaire also showed a link between stress and emotional eating and uncontrolled eating.
Based on the scatter plot, there was a positive pattern between emotional eating behavior with fast food or cans, sweet food or pastries, milk and derivatives, and sweet drinks. A study by Nguyen et al. (2007) showed that emotional eating was significantly associated with the frequency of salty, sugary and high-calorie foods. It is known that there are still students with high study stress who show emotional eating behavior and that there are students who have the desire to eat when they are anxious, worried or fearful.
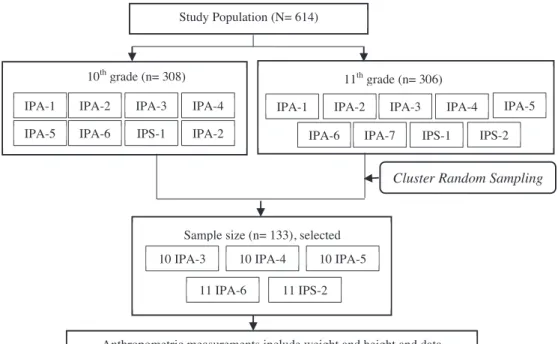
ASSOCIATION OF MACRONUTRIENT INTAKE WITH
PERCENTAGE OF VISCERAL FAT IN INTERNATIONAL STUDENT AT UNIVERSITAS AIRLANGGA SURABAYA
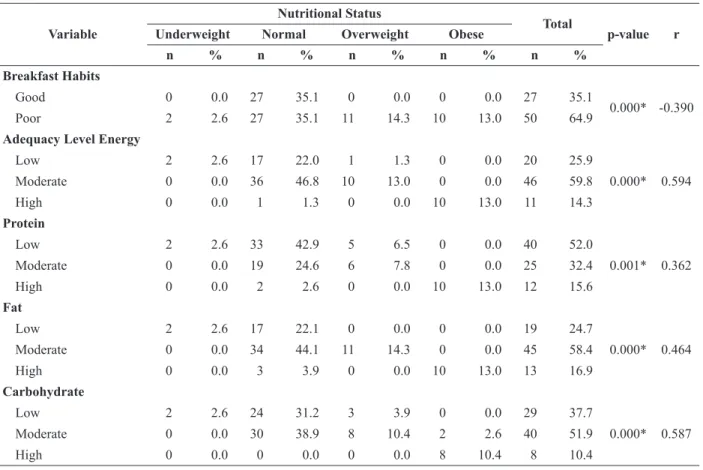
Visceral fat percentage data of foreign students was obtained by direct measurement using Bioimpedance Analysis (BIA) Omron HBF-375. High visceral fat affects waist circumference and may increase the risk of central obesity (Gadekar et al., 2018). The results of this study indicated a significant relationship (p < 0.05) between energy and fat intake and percentage of visceral fat among foreign students at Universitas Airlangga, Surabaya.
For every additional 1% of energy adequacy level, the respondent's visceral fat percentage will increase by 3.589. For every 1% increase in adequate fat levels, the percentage of visceral fat will increase by 1.712. Another study conducted by Sholuhiyah (2018) showed a significant association between energy adequacy level and visceral fat (p = 0.037).
The size of the waist circumference can be affected by the level of visceral fat. The risk of experiencing central obesity may increase due to the higher percentage of visceral fat (Gadekar et., 2018). The higher the intake of energy and fat that is not used by the body, it will be stored and accumulated into fat and the higher the level of visceral fat.
CORRELATION BETWEEN PERCENTAGE OF BODY FAT WITH SPEED AND CARDIORESPIRATORY ENDURANCE AMONG
FUTSAL ATHLETES IN SURABAYA
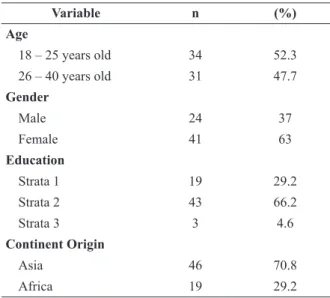
Measuring body fat percentage is done by measuring the thickness of the subcutaneous or subcutaneous fat. In addition, there was a significant relationship between body fat percentage and cardiopulmonary endurance in soccer players (r = –0.4; p = 0.004). Athletes under the age of 17 have a lower percentage of body fat than adults (Joshua, 2017).
Based on the results of the Spearman analysis test in Table 4, it is known that there was a correlation between the percentage of body fat and the respondent's speed (p <0.001). In Figure 2, the direction of the correlation between the percentage of body fat (%) and speed (seconds) was positive, namely R = 0.732. Meanwhile, respondents who had an excess percentage of body fat had a relatively low running speed (100.0%).
Meanwhile, respondents with a lower percentage of body fat had less heart and lung resistance. Body fat percentage with heart-lung rate and endurance in indoor athletes in Surabaya. Athletes with a normal body fat percentage usually have sufficient heart-lung rate and endurance.
ACCEPTABILITY AND NUTRIENT CONTENT OF INSTANT DRINK MADE FROM YELLOW SWEET POTATO AND RED KIDNEY BEAN
AS AN ALTERNATIVE SUPPLEMENTARY DRINK FOR PREGNANT WOMEN WITH CHRONIC ENERGY DEFICIENCY
This study aims to analyze the acceptability and nutritional content of instant drinks from a combination of yellow sweet potato (Ipomoea batatas L.) and red beans (Phaseolus vulgaris L.) for pregnant women with chronic energy deficiency (CED). This is necessary to be able to meet the energy-protein balance in additional drinks for pregnant women in chronic energy deficiency. The product acceptance test included 100 pregnant women, a combination of pregnant women with normal and chronic energy deficiency as panelists.
The nutritional content in the selected formula also met the nutritional content requirements of additional foods or beverages for pregnant women with chronic energy deficiency based on the SNI for special beverages for pregnant women and Figure 1. Value of ash content in instant beverage products it is still classified as normal because it does not exceed 6% ash content based on SNI for special drinks for pregnant women (BSN RI, 2005). Based on Utami, et al. 2017), nuts and dairy drink products for pregnant women also have a relatively low fat content, 1-3.8% each.
Energy content of the yellow sweet potato and red bean powder drink products is 429 kcal. This value met the requirements for energy content of beverage products or additional food for pregnant women with chronic energy deficiency, which is a minimum. Based on this, instant drinks based on yellow sweet potato and red beans can be used as an alternative complementary drink for pregnant women because they meet the nutritional needs of pregnant women in a day for drinks or snacks.

THE CORRELATION BETWEEN ENERGY, CARBOHYDRATE, FAT AND PROTEIN CONSUMPTION LEVEL WITH DEMENSIA IN
ELDERLY
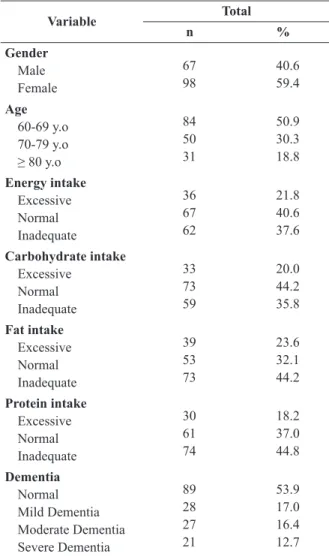
The aim of this study was to investigate the correlation between sex, age, level of energy, carbohydrate, fat and protein consumption with the prevalence of dementia in the elderly in Tulungagung district. Based on the results of this study, data on the prevalence of dementia in the elderly in Tulungagung district was obtained by 46.1%. Age is related to the prevalence of dementia in the elderly, where the risk of dementia will increase with increasing age (Gibbons et al., 2014).
Relationship between subject characteristics, energy intake, carbohydrates, fat and protein with dementia in the elderly in Tulungagung Regency in 2020. There was an association between energy intake and dementia in the elderly (p = 0.026), low energy intake increased the incidence of dementia in the elderly. This is different from the results of the study by Creavin et al. 2012), where high energy intake in the elderly was associated with an increased risk of cognitive dysfunction.
Fat intake was not associated with the incidence of dementia (p = 0.735), meaning that the adequacy of fat consumption did not influence dementia in the elderly. There was a positive correlation between age and the incidence of dementia and there was a negative correlation between the level of energy and protein consumption with dementia in the elderly. The older people are and the lower the level of energy and protein consumption, the higher the incidence of dementia in the elderly.
ACCEPTABILITY AND NUTRIENTS CONTENT (VITAMIN B12 AND FOLIC ACID) OF SUBTITUTED SNACK BAR WITH PURPLE SWEET
POTATO (IPOMOEA BATATAS L.) ENRICHED WITH NUTRITIONAL YEAST AS HEALTHY VEGAN FOOD
ACCEPTABILITY AND NUTRITIONAL CONTENT (VITAMIN B12 AND FOLIC ACID) OF SUBSTITUTE SNACK BREW WITH PURSE SWEET. This study used 1 snack bar control formula (F0) and 2 snack bar formulas that replaced purple sweet potato flour and added nutritional yeast (F1 and F2). Research sample was a snack replacement of purple sweet potato flour enriched with nutritional yeast using developed formula.
The formulation of purple sweet potato flour snack substitute enriched with nutritional yeast is presented in Table 1. The results of organoleptic testing by consumer panel experts on snack color preferences are presented in Table 2. The darker color of the modified snack bar and the control is was the result of a combination of purple sweet potato flour and soy flour.
Fiber from purple sweet potato flour and water mixed with chia seeds influences the structure of a modified snack bar. Snack bar F2 is a formula with purple sweet potato replacement and the correct addition of nutritional yeast. Replacing purple sweet potato and adding nutritional yeast had a significant effect on the acceptability and nutritional value (vitamin B12 and folic acid) of the snack bar.

