First, we examined the effect of the ratio of titanium to niobium metal ions on the phase association. Finally, the influence of composition and heat treatment temperature on phase transformation temperature and assembly was investigated.
Motivation and Statement of Objectives
Material Systems of Interest
Titanium Dioxides
Niobium Oxides
Titanium Niobium Oxides
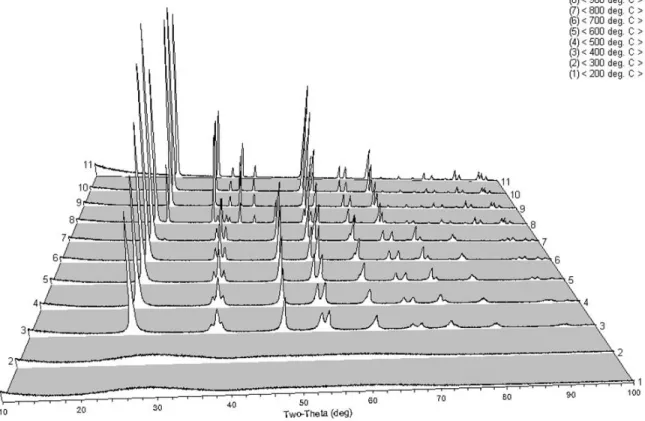
High temperature x-ray diffraction (HTXRD) can systematically study the distorted crystal structures and the mixed phase materials.59 The phase formation temperature can be related to processing parameters such as heat treatment temperatures and holding time. For example, in TiO2/Nb2O5 materials the crystallization temperature and anatase can be adjusted to rutile phase transformation temperature.60 The additional materials can change the activation energies for the phase formations.
Sol-gel Processing
Introduction
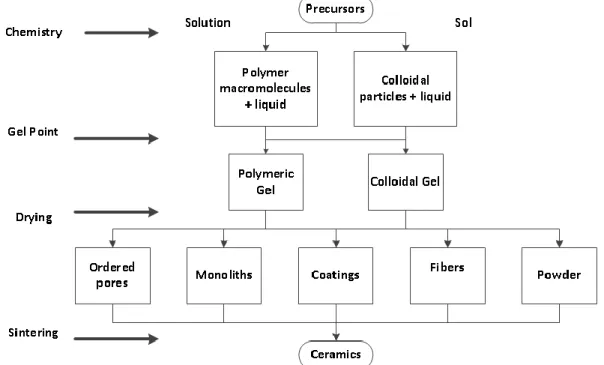
For example, titanium isopropoxide, niobium ethoxide, nitric acid, water, isopropanol, and ammonium carbonate can be used to form titanium niobium oxides.9 Before precursor materials are selected, sol-processing techniques must be described. gel. On the right, the pathway is the sol pathway where colloidal particles mix with liquid to form a colloidal gel.64 Once the gel is obtained, different shapes can be formed during the drying process.
Advantages and Disadvantages of Sol-Gel Processing
Oxide Systems formed by Sol-Gel Processing
The sintering temperature depends on several factors such as metal oxide materials, particle size and sample dimensions, and heating profiles. The main purpose of such preheating treatment is to dissociate and remove some organic materials to prevent volatile degassing in HTXRD instruments.
X-Ray Diffraction
- Principles
- Applications of X-ray Diffraction
- Rietveld Refinement
- Quantification
- Limitations
Fourth, the Scherrer equation expressed in Equation (5) can be used to determine the crystallite size L, regardless of the microstrain. With DTA/TGA (differential thermal analysis/thermogravimetric analysis) and HTXRD, these materials can be analyzed.
Processing
Sample Analysis Equipment
DTA/TGA
HTXRD
MDI Jade and Bruker Topas
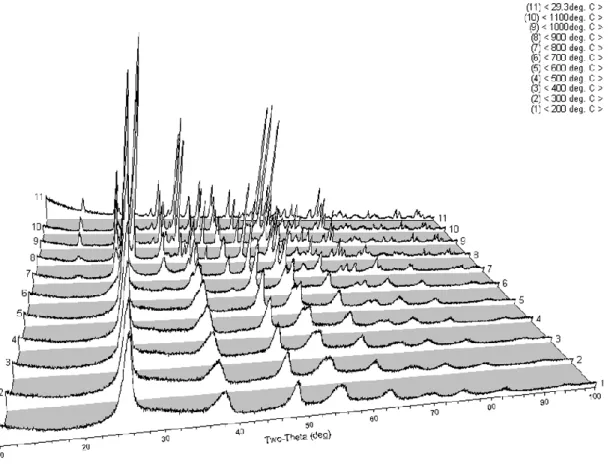
Using PDF matching, Table III summarizes the phase identification of the 75:25 sample as a function of temperature. Rietveld refinement was performed to determine crystallite sizes and relative phase percentages as a function of temperature.
Thermal Analysis
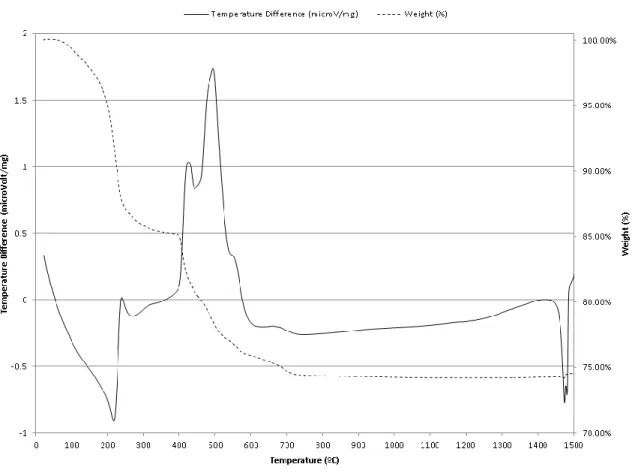
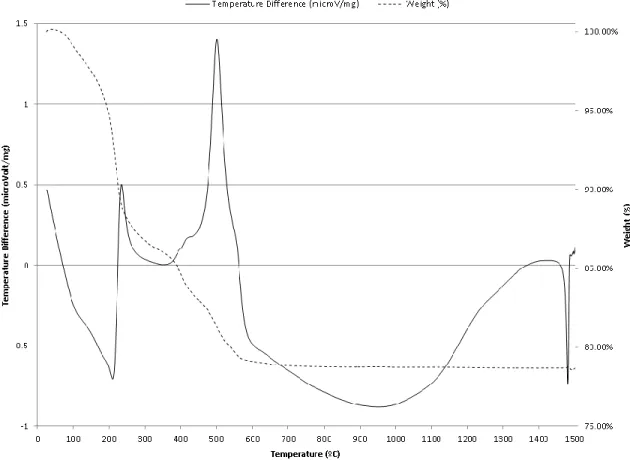
For anatase, the crystallite size was 29 nm at 200ºC and the growth rate between 200ºC and 800ºC could be roughly approximated as 0.1% per 1ºC. 113,114 The second endothermic peak at 205ºC in the DTA, and the ~5% weight loss in the temperature range 150ºC-220ºC in TGA, can be attributed to the removal of organic compounds such as ethanol and butanol. 3% weight loss in the temperature range of 220ºC-300ºC in TGA could be attributed to the decomposition of organic substances such as acetic acid, removal of hydrolyzed isopropoxide ligands bound in the titanium precursors and oxidation. The exothermic peak at 501ºC in the DTA, and the ~6.6% weight loss in the temperature range 370ºC-600ºC in TGA can be attributed to the crystallization of metal oxides. The feature near 1480ºC was due to the instrumentation limitation when the heating rate suddenly changed from 20ºC/min to 0.1ºC/min. 130.
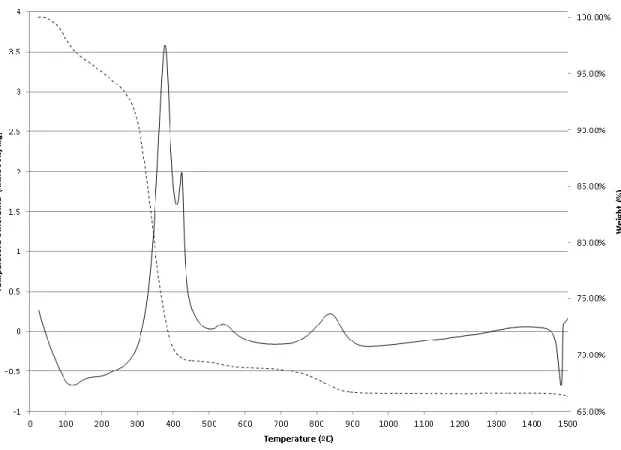
For anatase, the crystallite size is 10 nm at 600ºC and the growth rate between 600ºC and 900ºC can be roughly approximated as 4% per 1ºC. The exothermic peaks between 447ºC and 550ºC can be attributed to the crystallization of niobium oxides. The last exothermic peak at 1117ºC could be attributed to the orthorhombic to monoclinic Nb2O5 transformation.143 The feature near 1480ºC was due to the instrumentation limitation when the heating rate suddenly changed from 20ºC/min to 0.1ºC/min.130.
Ti:Nb Metal Ion Ratio Influence on Phase Assemblage
Similarly, in Ghic's electrochemical process, Nb-doped anatase TiO2 materials were fabricated at 450 °C for 1 h; where the characteristic peaks were shifted down and the volume was expanded.147 Furthermore, in Stengel's thermal hydrolysis process of titanium oxo-sulfate, niobium pentoxide and hydrogen peroxide were used as precursors, and Nb-doped anatase was produced at 600 ° C.148 A volume increase was observed due to Nb substitution when the Ti:Nb ratio was between 96:4 and 87:13. When the Ti:Nb ratio was between 100:0 and 94:6, Nb-doped rutile was formed and the lattice parameters increased as the Nb concentration increased. In addition, Nb-doped rutile was fabricated at 1000 °C in Stengel's thermal hydrolysis process and volume expansion was observed.
In Gao's work, Nb-doped rutile was formed via molecular beam epitaxy and heat treated at 600ºC. 149,150 Using RHEED and LEED, it was determined that Ti4+ is replaced by Nb4+. In the work of Morris, Nb-doped rutile was obtained by mixing TiO2 with NbO2, heating at 650ºC for 1 day, 950ºC for 2 days, and 1000ºC for 5 days.151 Due to the prolonged heat treatment, Morris suggested that Nb4+ in his experiment it was useless. is oxidized to 5+ and the charge difference can be compensated by creating Ti vacancies or oxygen interstitials. Such observations are consistent with previous publications In Trenczek's sol-gel process, when the Nb concentration was above 10%, TiNb2O7 and Nb-doped rutile exist.
Crystallization Temperature Influence on Phase Assemblage
For the 50:50 sample, the initial crystallization temperature was close to 600ºC and the full crystallization temperature was 800ºC. For 0:100, the initial crystallization temperature was close to 500ºC and the complete crystallization temperature was close to 600ºC, which can be compared with the literature. In Schmitt's sol-gel process, niobium chloride, ethanol and acetic acid were mixed and heat treated at different temperatures. The initial crystallization temperature for niobium oxide was close to 500ºC.
In Pawlicka's sol-gel process, niobium chloride, butanol, and acetic acid were mixed and heat treated at 400ºC–600ºC for 10 minutes.160 The initial crystallization temperature of niobium oxide was approximately 500ºC. The initial crystallization temperature of the 25:75 sample was 500ºC similar to the 0:100 sample; and the full crystallization temperature was close to 800ºC similar to the 50:50 sample. In De Costa's sol-gel process, isopropanol, titanium isopropoxide, and acetic acid were mixed with a Ti:Nb ratio of 25:75 and heated at 400ºC–600ºC for 3 h.162 The initial crystallization temperature was close to 500ºC.
Phase Transformation Temperatures Influence on Phase Assemblage
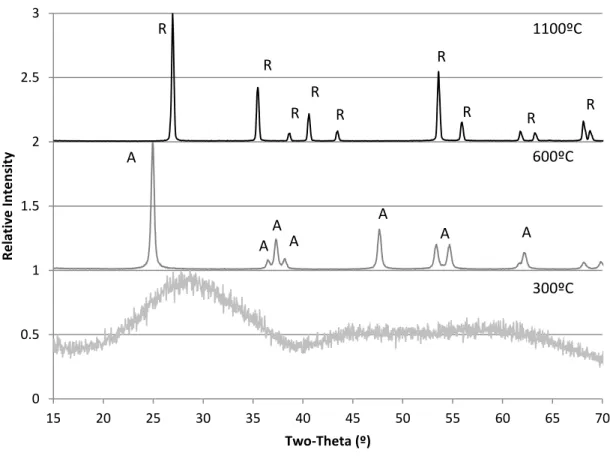
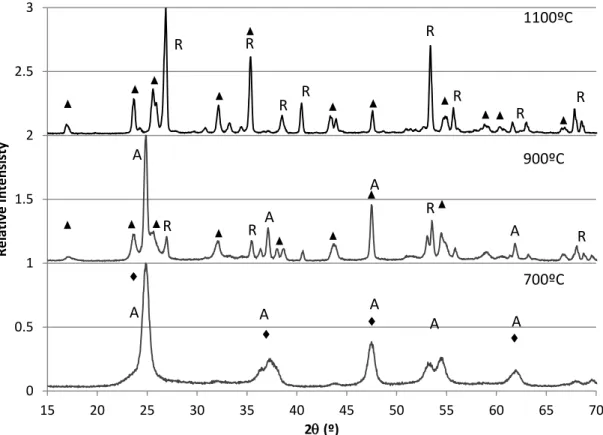
In Sotter's sol-gel experiment, titanium isopropoxide and nitric acid were mixed and heat-treated.9 The A-R transformation took place at 600ºC - 900ºC. Shannon proposed that the A-R transformation initially required activation energy to convert some anatase to rutile, i.e. the transformed rutile began nucleation on the surface of anatase.4 Gradually, rutile growth would take place inside the anatase. For 75:25 samples, the addition of Nb caused the A-R transformation temperature range to shift to 800ºC–1000ºC as illustrated in Figure 13.
For the 50:50 sample, further addition of Nb caused the A-R transformation to be delayed at 900ºC-1000ºC as illustrated in Figure 18. In Bansal's work, orthorhombic Nb2O5 existed between 500ºC and 900ºC existed between 500ºC and 900ºC existed between 500ºC and 900ºC 100ºC and monocl phase 10.9. The O-M transformation temperature was between 900ºC and 1000ºC. The O-M transformation temperature was between 600ºC and 800ºC, which was lower than that of the 0:100 sample.
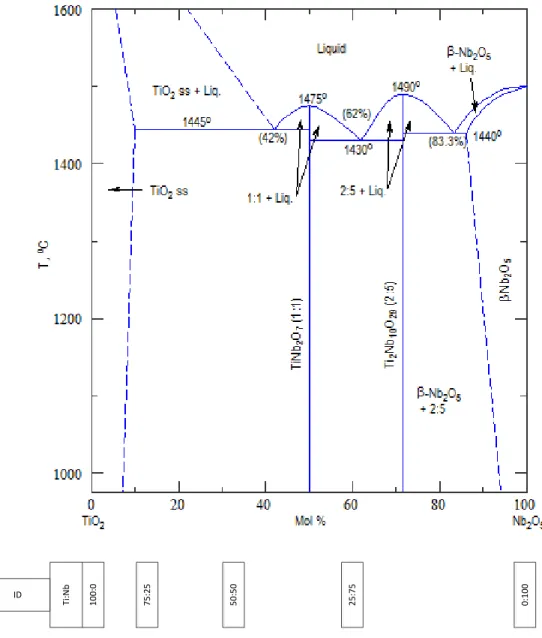
Phase Diagram Comparison
34;Characterization of TiO2 Synthesized in Alcohol by Sol-Gel Process: Effects of Annealing Temperature and Acid Catalyst," Turk. Wei, "Nanostructured Mesoporous Titanium Dioxide Thin Film Prepared by Sol-Gel Method for Dye-Sensitized Solar Cells," Int. Wang, "Effects of PVP on the structure of TiO2 prepared by the sol-gel process," Mater.
Poelman, "Characterization of TiO2 Powders and Thin Films Prepared by Non-Aqueous Sol-Gel Techniques," J. In (e), the measured peak height is greater than and the width is less than the calculated one. In (f), the measured height is less than and the width is greater than the calculation.
Appendix A: XRD Patterns from Rietveld Refinement for 100:0
For example, at 400ºC, the decrease near 25º 2 reflects the fact that the calculated value is greater than the measured one as illustrated in Figure 3(a). Near 48º 2, the peak reflects the fact that the calculated value is smaller than the measured one as illustrated in Figure 3(b).
Appendix B: Numerical Values of Lattice Parameters for 100:0
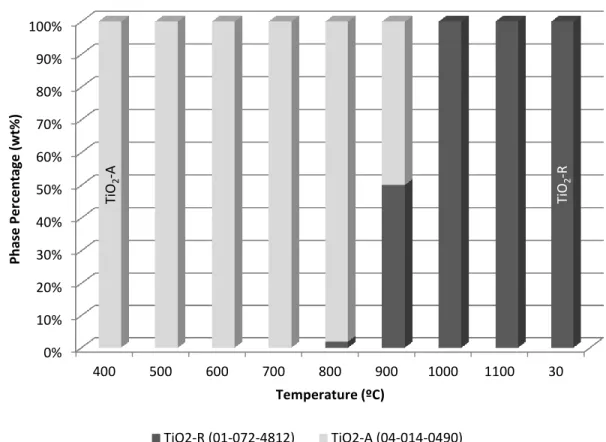
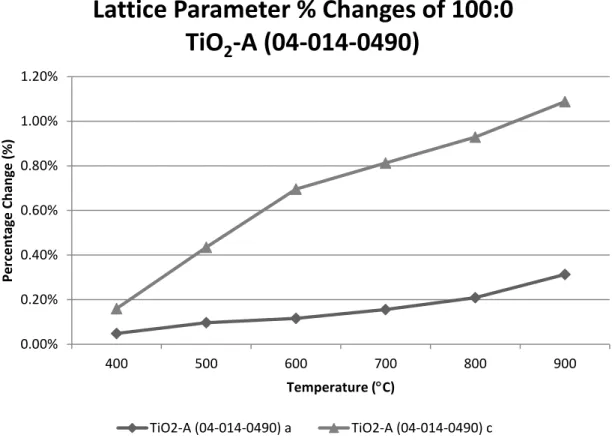
From 400ºC to 900ºC the anatase volume increases, which is due to the expansions of lattice parameters a and c in Figure B-1. From 900ºC to 1100ºC, the rutile volume percentage change increases slightly from 2% to 2.6%, which is due to the expansions of lattice parameters a and c in Figure B-2. When the sample cools to 30ºC, the measured volume is slightly less than the standard value due to the smaller lattice parameter a in Figure B-2.
For the anatase phase, the microstrain value decreases as the temperature increases from 400ºC to 800ºC; and rises between 800ºC and 900ºC. For the rutile phase, the strain value does not change between 800ºC and 900ºC; increases as the temperature rises from 900ºC to 1000ºC; does not change much between 1000ºC and 1100ºC; and is less than that at 1100ºC when the sample is cooled to 30ºC.
Appendix C: XRD Patterns from Rietveld Refinement for 75:25
Appendix D: Numerical Values of Lattice Parameters for 75:25
Figure D-1 plots the percent changes in lattice parameters for Ti2Nb10O29 as a function of temperature, using the default lattice parameter values in PDF as reference. Figure D-2 plots the percentage changes of the lattice parameters for TiNb2O7 as a function of temperature, using the default lattice parameter values in PDF as a reference. Figure D-3 plots the percentage changes of the lattice parameters for TiO2-A as a function of temperature, using the default lattice parameter values in PDF as a reference.
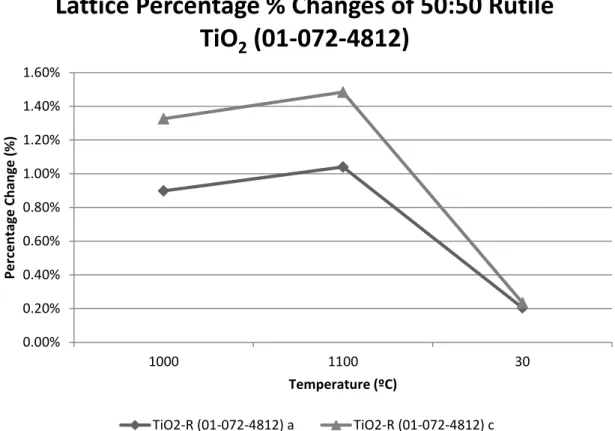
Figure D-4 shows the percentage changes in lattice parameters for TiO2-R as a function of temperature, with the standard lattice parameter values in the PDF used as references. Specifically, the trend in Figure D-4 is similar to that in Figure B-2 for lattice parameter a and c, respectively. When the temperature drops to 30 °C, both values are close to the standard values within 0.2%.
Appendix E: XRD Patterns from Rietveld Refinement for 50:50
Appendix F: Numerical Values of Lattice Parameters for 50:50
In Figure F-1, the lattice parameter percentage changes for TiNb2O7 are plotted as a function of temperature, using the standard lattice parameter values in PDF as references. As the temperature rises to 1100ºC, the lattice parameters are closer to the standard values, within 0.3%. In Figure F-2, the lattice parameter percentage changes for rutile TiO2 are plotted as a function of temperature, using the standard lattice parameter values in PDF as references.
Specifically, the trend in Figure F-2 is similar to that in Figures D-4 and B-2 for lattice parameter a or c, respectively. Figure F-3 plots the percentage changes of the lattice parameters for TiO2-A as a function of temperature, using the default lattice parameter values in PDF as a reference. In Figure F-4 the percent volume change for each of the phases is given as a function of temperature.
Appendix G: XRD Patterns from Rietveld Refinement for 25:75
Appendix H: Numerical Values of Lattice Parameters for 25:75
Appendix I: XRD Patterns from Rietveld Refinement for 0:100
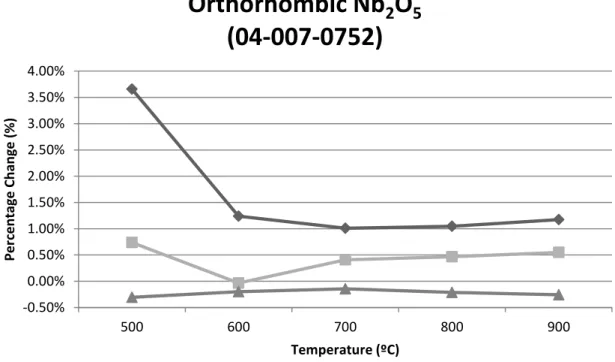
The temperature is listed in the table in the upper left corner along with the Rwp values. Changes in unit cell parameters are listed here along with changes in volume percentages and strain values. Figure I-1 shows the percentage changes in lattice parameters for orthorhombic Nb2O5 as a function of temperature, with the standard lattice parameter values in the PDF used as references.
Figure I-2 shows the percentage changes in lattice parameters for Nb2O5-M as a function of temperature, with the standard lattice parameter values in the PDF used as references. Figure I-4 shows the microstrain as a function of temperature for each phase between 500 °C and 1100 °C.
Appendix I: Numerical Values of Lattice Parameters for 0:100