r{ P"."1*t o,* ?^f**ota *^ [
&o
ficccLefrlF,&,"& Bt,n*rurssCcnrrnrlnr
Z0l0CONTENT
page Greeting Head of Accounting Department parahyangan catholic
university...
iGreeting Head of
Committee.... ii
CONTENT
VINTRODUCTION I
PAPERS
18
Accounting and Information System.. t9
Auditing...
72Banking and Finance
... l2l
Behavior Issues in
Accounting
i55E-Commerce...
lg4Entrepreneurship...
220Financial Accounting and
Reporting...
245Financial Analysis and Capital
Market ..
325Management Accounting
...
355Marketing ...
452Organizational
Behavior
4g0Other Topics Related to Accounting &
Business...
540Social and Environmental
Accounting
657Strategic Management
...
675Strategic Management
Accounting ...
6glList of
Committee
695APPENDIX
...Appendix 1Profile and Authors
Data...
...Appendix 1_1v
\lt/w\ry-Ilnn'lf qn id
- \ryruw omquro} li-^ ^ts^ ^.-^-^r-I:-^:-La ^--^-
1 Proceedings
2nd Parahyangan International Accounting & business Conference 2010 Bandung, 17th-18th June 2010
The Strategic Impact of the Carbon Cost Accounting Information in the Balance Scorecard On Investment Decision
Muhammad Ja’far S.,
Sultan Agung Islamic University (UNISSULA)
Ardiani Ika S.
Semarang University (USM)
2 The Strategic Impact of the Carbon Cost Accounting Information in the Balance Scorecard
On Investment Decision Muhammad Ja’far S.,
Sultan Agung Islamic University (UNISSULA)
Ardiani Ika S.
Semarang University (USM)
ABSTRACT
The possibility of costly disruption from rapid climate change calls for greater attention to carbon management and accounting in the decision making process (Ratnatunga, 2008). The study on how organization uses carbon cost accounting information for their decision making is very important. This study investigates the effect of carbon cost accounting data and its
information display on the attentions of decision makers and investment decision. By using combination of balance scorecard (BSC) and carbon cost accounting (CCA) information, the research aims to examine whether the incorporating CCA data into a BSC, called the SBSC, affect on carbon efficient investment.
This research is experimental study. Samples are participants consisted of undergraduate students, graduate students, and graduate. Participants have a variety of professions in
accordance with the design of research for investment decisions. Participants were randomly assigned into one of three conditions in between-participants design, and then they chose between two investments using BSCs. The three conditions are: no environmental data (as control variable, called the traditional BSC); CCA data added to a BSC as a fifth perspective standalone; CCA data embedded within the traditional BSC (there is one CCA perspective embedded within four traditional BSC perspectives). By using One Way Anova, Two Way Anowa and Independent sample t-test, the hypotheses were tested.
The findings show that the carbon efficient investment was greater with the four-
perspective SBSC (CCA data embedded within the traditional BSC) and five-perspective (CCA data added to a traditional BSC as a standalone perspective) rather than traditional BSC. There is no difference between four-perspective SBSC and five-perspective SBSC in the carbon efficient investment choice. Furthermore, the cognitive effort to choose carbon efficient investment was greater with both four-perspective SBSC and five-perspective SBSC rather than BSC. Finally, the finding shows that the knowledge of participants does not influence the carbon friendly investment.
Key Words: Balance Scorecard, Sustainability Balance Scorecard, Carbon Cost Accounting Information, Carbon Efficient Investment, Information Display
3 I. INTRODUTION
The Kyoto Protocol constitutes an amendment to the UN Working Framework Convention on Climate Change (UNFCCC), and also an international agreement on global warming. Countries which ratify this protocol commit to reduce emissions of carbon dioxide and five other greenhouse gases, or cooperate in emissions trading if they maintain or
increase the amount of emissions of these gases, which has been linked to global warming.
If successfully implemented, the Kyoto Protocol is predicted to reduce average global weather between 0.02 °C to 0.28 °C in 2050 (http://id.wikipedia.org/wiki/Protokol_Kyoto).
One article in the Kyoto Protocol states that the importance of changing behavior to the concept of environmental economics. Whether we are conscious or not, today economic activity and human consumption have become a major causal factor of global warming.
Meanwhile, the influence of global warming on human life has led to a series of serious action from the world community as efforts to prevent global warming effects more broadly. Kyoto Protocol, which has been signed and ratified by most countries in the world are key to change for the world community. The protocol stated that the protocol ratifying governments, enterprises and consumers should immediately make efforts to a behavior change toward a new economic concept, i.e. the era of environmental economics which is called as "Carbonomics" by Ratnatunga (2008, p.1). Carbonomic era ideas will be able to become the motor of environmental protection and save the world from the problem of increasing global warming. The implications of the adoption of the Carbonomic concept will also affect on the socio culture development, professions and economic model.
Another recommendation of the Kyoto Protocol is the recognition of carbon trading schemes. This trade model can be described as follows: companies initially did a deal (most
4 likely through the regulation of the government) about how much Carbondioksida (CO2) to be generated by their production (the Cap). If certain firms in producing goods or services produced CO2 emissions less than the maximum limit (the cap), they have a credit score, on the contrary, if a particular company exceeds the threshold limit CO2 emissions, then they can buy credits from companies that have emissions below the threshold. The amount of accumulated carbon emissions Limit within a region should not exceed the amount of maximum accumulation limit that has been established (Ratnatunga, 2007).
The important meaning of the implementation of carbon trading in accounting is the emerging of the idea of controlling carbon cost, termed as carbon cost accounting (CCA), in the production. Companies need CCA management to control carbon emissions due to their production activity. If carbon emissions can be controlled to limit the permitted threshold, then it is a strategic advantage for future product development.
The issue of the CCA is a phenomenal thing for sustainable living, considering the impact of carbon emissions which are not controlled can cause severe environmental damage. Therefore, research on the CCA is an interesting issue for economic development and ecological sustainability. Some researches on the impact of the Kyoto Protocol and carbon cost management have been conducted by several researchers. Löschel and Zhong Xiang Zhang (2002) examine the impact of the Kyoto protocol on environment conservation due to the unwillingness of US to ratify the Protocol. But their results showed that the Kyoto Protocol contributed significantly to the reduction of gas emissions in industrialized countries. Driesen (2007) examines the impact of carbon trading in the international market for sustainable energy development. The result of the study done by Driesen (2007) show
5 that the international carbon market contributes very little to the development of sustainable energy.
In Indonesia, some research on the CCA has been done before by Jafar S., and Lisa K., (2009a, 2009b). The result of the first study (2009a) shows that management control systems, production management, and corporate governance practices are important
variables that affect the practice of carbon accounting. A second study (2009b) showed that Environmental Paradigm affected on the Carbonaccounting Paradigm and Carbon
Accounting Standards.
Unfortunately, in accounting, there is still very little research that investigates issues of the CCA, even more about the carbon cost accounting reporting model, and the impact of carbon cost accounting data for decision making. Epstein J., Marc, and Martin Freedman (1994); Hackston, D. and M. J. Milne, (1996); Salomone, Roberta and Giulia Galluccio, (2004); and Jafar S., and Dian Tanila K., (2009c) has conducted research that identified a variety of environmental information reported in the capital market; the factors that affect the environment; and the impact of disclosure of environmental reporting for the value of the company in the capital market. In general, some researchers above make
recommendations about the importance of research that explores the model of environmental data reporting in the annual report. The problem is, there hasn’t been any general
aggreement on the environmental data display model integrated with the financial reporting.
This happens because, (1) in some countries, enforcement of environmental reporting is different, some are voluntary and some are mandatory as in some European nations, (2) lack of similarity measures between environmental performance and financial performance.
6 Therefore, the importance of environmental reports (CCA) is still internally for management purposes.
In connection with the idea of environmental reporting model for management, the Balance Scorceard (BSC), which was initiated by Kaplan and Norton (1992), can mediate various information that has units of different data sizes for the benefit of performance measurement and corporate strategy (Campbell, et al., 2002; Silva and Prochnik , 2005;
Hibbets, Aleecia R., 2006; Malina, Mary A., and Frank H. Selto, 2001; Marcela Porporato, 2009, Tayler, William B., 2009). Alewine, and Dan N. Stone (2009) later conducted a study that tested the effect of environmental data in the BSC on attention and investment
decisions. Based on the researches above, this study was conducted to test the effect of CCA in the BSC data for investment decision making. Specifically this study is to reveal the effect of CCA in the BSC data against 1) the attention of participants in the investment- friendly carbon (carbon friendly investment (CFI), and 2) tendency of participants to opt for carbon friendly investment more.
This research is experiment study with the use of environmental data information, methods and analysis tools that are different from research of Alewine, and Dan N. Stone (2009). The environmental data used in this study is CCA data integrated in the BSC, while the method of data collection is performed manually (Questionnaire). This method differs from the Alewine, and Dan N. Stone (2009) that uses the help of software Visual Web Developer 2008 Express to simulate an investment choice based on the concept of
integration of environmental data in the BSC. The analysis method used is Anova, Two Way ANOVA and independent sample t-test to examine the hypotheses.
7 The important contribution of this research is the integration of CCA data in BSC information that can be used as a strategic decision, like investment. In the field of
management accounting and accounting information system, the results of this research is very important for the development of corporate strategy for achieving sustainability green economy.
II. HYPOTHESES DEVELOPMENT
The impact of carbonomics
Carbon accounting and strategic factors in management accounting
idea has served in various professions, including the accounting profession. This is because the field of accounting, particularly management accounting, finance and audit, whether directly or indirectly affected by such Carbonomics era. Conversely, strategic readiness in the field of management accounting practices will encourage the acceleration of carbonomics lifestyle readiness in the company
In the next stage, the carbon accounting era will evolve if it is supported by a variety of accounting systems and adequate engineering. An idea to connect the product with the efficiency of CO2 need to have the support and concern seriously, because an idea in the efficiency of CO2 emissions is an action to rescue the world. This is the significance
meaning of carbon accounting in the profession development and accounting engineering in the world situation which is struck by the anxiety caused by global warming.
A key element in Carbon accounting is the efficiency of greenhouse gas emissions, especially CO2 (the largest gas generated by human activities), associated with the
manufacturing and supply of goods and services. Research of Ratnatunga (2007) conducted during 2003 to 2007 also concluded that important factors associated with the efficiency of
8 carbon, such as regulations from the government or the authorities that regulate the
accounting standards of carbon trading system application.
Balance Scorecard
BSC is a multi-dimensional tool in the accounting system to evaluate performance and analyze alternatives with particular focus on the achievement of company strategic goals (Kaplan and Norton, 1992). Traditionally, this can be achieved by combining four perspectives of the BSC: financial, customers, internal business, and innovation / growth and learning (Kaplan and Norton, 1992). Each perspective is important in achieving the
organization's success, and every parameter in BSC perspective reflects the conditions and special considerations. Metric data includes financial measures, and non-financial measures that include qualitative and non-monetary dimensions of performance that are not found in traditional financial performance measures.
Scorecards are commonly used to evaluate the performance (Dilla and Steinbart, 2005; Lipe and Salterio, 2000), but some managers also use the scorecard to evaluate future investment decisions (Bible et al. 2006). For example. Fink et al. (2005) suggested that the BSC can be used to develop future strategies by including internal resources scenarios and external markets, and then use these data to analyze business decisions may be taken. Milis and Mercken (2004) proposed a multi-step evaluation approach, which incorporates the BSC to evaluate major information and communication technology investment.
BSC can bridge the wide variety of different data metrics (Tayler, William B., 2009) such as financial data (in dollars), Human Resourches data (in the level of education), or unique environmental data (eg, in tons, parts per million, and so forth). The uniqueness of environmental accounting information and non-traditional metric data is its ability when the
9 data is combined with financial data in decision making. The uniqueness is recognized when the business has strategic objectives other than finance (Campbell, et al., 2002) such as environmental liabilities. Bassen et al., (In Alewine, and Dan N. Stone, 2009) conducted a case study on Siemens companies about the implementation process and the use of BSC for capital investment decisions. They found that the scorecard can be used with a mix of nontraditional data and are not familiar with traditional financial data for the benefit of long- term capital investment strategy.
BSC Versus SBSC
This study, first predicts the comparison between the traditional scorecard (BSC) with a scorecard that included CCA data in the Balance Scorecrad (Sustainability Balance Scroecard (SBSC)). Additional environmental data in the BSC may raise concern because of relevant data for decision making (Alewine, and Dan N. Stone, 2009), ie, someone will be more selective in information processing. Therefore, the hypothesis which has been developed is:
Hypothesis 1: When evaluating the scorecard data for companies that emphasize goals of financial success and environmental responsibility together, someone will use the cognitive effort more in understanding scorecards company that contains CCA data (SBSC) than the scorecard companies that do not contain CCA data (BSC).
Hypothesis 1 tests whether attention in the scorecard increase when CCA information is added. If the CCA data is relevant data, then SBSC can improve the relatively attention on BSC, the environmental information in the SBSC also improved the carbon friendly investment. In other word, attentionn to the CCA data should also be able to increase the investment value in the matrix of SBSC. Thus, the second hypothesis which
10 states whether the SBSC can improve the investment compared to the BSC can be stated as follows:
Hypothesis 2: when evaluating corporate scorecard that emphasizes two strategic goals, financial and environmental performance, a person will base carbon friendly investment decisions on the SBSC data than the BSC data.
Four vs. Five perspective SBSC
Refers to the cognitive theory of cost and benefit, presenting the information will affect the decision process, attention and choice of decision maker in line with the direction wished to be achieved by decision-makers. BSC data structure is the main focus in this experimental research models. BSC literature states that the BSC reporting structure will affect the decision-making (Lurie and Mason, 2007). Referring to Alewine, and Dan N.
Stone (2009), there are two approaches in presenting the data structure of the BSC, namely:
the fifth perspective added, such as environmental data (in this case CCA data) in the traditional BSC, and entry of CCA data in one unity of four perspectives of BSC. The debate over these two structures lies in the question of whether the separation of environmental data as the fifth perspective will be a benefit in the analysis of overall BSC (Alewine, and and N. Stone, 2009). The use of five perspectives of SBSC will enhance the cognitive effort of a person compared with the use of four perspectives (with CCA data included in the four of other BSC perspectives data). Based on the facts, the third hypothesis is proposed:
Hypothesis 3: When evaluating an investment with a panel of SBSC, individuals will expend more cognitive effort on SBSC five perspectives than SBSC four perspectives.
By the same analogy, the difference in the value of Carbon Friendly Investment may also occur in SBSC five perspectives (with the CCA perspective separated into fifth
11 perspective) compared with SBSC four perspective (CCA perspective are embedded in the traditional BSC) (Alewine, and and N. Stone, 2009). Thus, the fourth hypothesis is presented as follows:
Hypothesis 4: When evaluating an investment with a panel of SBSC, individuals will make more carbon friendly investment on SBSC five perspectives (CCA data added) than SBSC four perspectives (CCA data embedded).
The impact of the knowledge level of decision making
Alewine, and Dan N. Stone (2009, p. 21) states that the limitations of their research is the absence of testing the effect of knowledge level of participants to the carbon-friendly investment decision. Decisions can be different if someone involved in decision-making has a different background such as experience and knowledge. By developing the idea and shut the research limitation done by from Alewine, and Dan N. Stone (2009), this study is to examine the influence of knowledge (measured by educational level) of carbon-friendly investment decision. However, relations between the two variables is not directly so. In this case, knowledge can be viewed as a moderator variable for interaction between BSC information (traditional BSC, BSC 5 perspective and BSC 4 Perspective) by making an investment decision. That means the higher one's knowledge will increase one's beliefs in making investment decisions. Thus, the hypothesis was developed, as follows:
Hypothesis 5: there is the interaction effect of display BSC (traditional BSC, SBSC 5- perspectives and SBSC 4-perspectives) and knowledge on the carbon-friendly investment decisions.
12 III. RESEARCH METHOD
This research is experimental study, which involves the control variables (traditional BSC). Adopting from Alewine, and And N. Stone (2009), the first step is selected by random sample to be determined which participant belongs to one of three conditions : 1) participant in the analysis of the traditional BSC, 2) participant in the analysis of SBSC five perspectives, and 3) participant in the analysis of the SBSC four perspectives.
Each participant in each condition is faced with the BSC data under respective conditions and asked to determine the number of investment funds to be allocated in A or B investment. The total number of investment is $ 20,000,000 with two company strategic objectives; there are investment in the production factors that generate financial performance and high environmental performance (measured in efficiency of carbon emissions for each perspective of BSC).
Each participant is only allowed to fill the data according to selected cases. Carbon friendly investments and attention on the environmental data is the dependent variables, while the independent variables are the three conditions of BSC. Thus there are three independent variables; 1) traditional BSC with four perspectives, 2) BSC with the addition of CCA data as a fifth perspective (SBSC with five perspectives) and 3) BSC with CCA data embedded in the four perspectives (SBSC with four perspectives).
Tests are conducted using one way ANOVA and two way ANOVA, to figure out the effects of the BSC information and knowledge on the investment and attention to CCA data.
The attention variable was measured using the intensity dimension of cognitive effort (Bonner and Sprinkle, 2002), by modifying the questionnaire developed by Cacioppo, et al., (1984). Eighteen items used by Cacioppo, et al., (1984) are summarized within three items
13 correspond to the object of research (CCA data display in the BSC). The three items are 1) the complexity of data, 2) the need to think and analyze about the data and 3) a genuine (serious) effort to understand the data. BSC conditions model adopted and expanded from Alewine, HC., and Dan N Stone (2009), which modifies from Banker, Chang, and Pizzini (2004), Garrison, Nooren and Brewer, (2006), and Libby, Salterio, and Webb (2004). Unlike Alewine, HC., and Dan N Stone (2009), the study does not use Visual Webb Developer software 2008 to obtain data, but developed in the form of manuals, as can be seen on the questionnaire (appendix).
1.
The samples of research are some participants having profession as a student (Undergraduate/graduate), lecturer and accountant. The sample of students and lecturers were drawn from two economics faculty from two leading private University in Semarang, Central Java. While the sample of accountants are accountants who have employing affiliation as a faculty at one of the leading universities in Semarang, Central Java. Samples were taken in a convenience purposive random sampling as follows:
2.
Convenience sampling was determined by taking samples for each student (Undergraduate/graduate) the faculty of economics that were met. Sample would, after going through various simple interviews about their achievement index /grade point (IP), then the sample was determined if their IP were more than 3 (purposive).
For the accountants, the purposive was determined based on whether there is affiliation with any one of leading universities in Semarang. Identification process was done at the university concerned; it can be known which accountant (teaching staff) has an accountant office or work as public accountant as well as teaching staff.
14 IV. RESULTS AND DISCUSSION
Descriptive Data
Initial sample of 85 participants came from students of undergraduate and graduates program majoring in accounting, lecturers of faculty of economics at two private universities in
Semarang, as well as some public accountants who are also identified as a lecturer in one of the leading universities in Semarang, Central Java, Indonesia. Of the 85 participants, 19 of them did not return the questionnaire and three participants were drpped because it does not meet the requirements (do not answer questions that measured their level of understanding about the carbon-friendly investments ( / CFI) and the balanced scorecard concept (BSC). Thus there are 63 participants in this research.
As many as 31.7% participants came from undergraduate program student; 20, 6% of the graduate program students, and 47.6% are graduates. From the perspective of their profession, participants were considered feasible in making investment decisions. As many as 36.5% are students (undergraduate program and graduate program), 50% lecturers and 12.7% of public accountants. Complete data on participant descriptions shown in table one.
15 Validity and Reliability
Hypothesis 1 tests the effect of metric data in the BSC on cognitive effort of the decision maker (participants). Cognitive effort was measured adapted from Cacioppo, JT., et al., (1984) and adjusted to the interests of disclosing of participant’s cognitive effort in understanding the carbon cost accounting metric data. Thus it is necessary to test validity and reliability of the questionnaire.
The test results shown in table two.
The effect of carbon cost accounting metrics data on cognitive effort (hypothesis 1)
Hypothesis 1 tests whether there was an effect of carbon cost accounting (CCA) data to the attention of participants in making investment decisions. In other words, participants who paid attention to the cca data will use his cognitive effort more to understand the SBSC matrix than BSC. The results show that the CCA display data in BSC affect the total of participants cognitive effort, as shown in equation (1).
16 Y = α + β (X) + ε ... (1) p-value: 0,000 0,000
F : 45,922
Levene’s test: F= 0,484, p-value: 0,619 Where,
Y = Cognitive effort
X = Cases (BSC, SBSC 5 Perspective, SBSC 4 Perspective (CCA Embedded)
From equation (1), It shows that the value of Levene's test showed no significant F- values at α = 0.05. This means that the null hypothesis (which states that the dependent variable must have the same variance within each category of independent variables) can not be rejected. On the other hand, the value of data normality for the variable of cognitive effort shows the value of z-skewness and kurtosis was below the value of -Z table (1.96) (see table one). The two suggest that the model does not violate the assumption of Anova.
Tukey test results for an average difference of the cognitive effort variable for the case of BSC, SBSC 5 perspective (CCA added), and SBSC 4 perspective (CCA embedded) is shown in Table Three.
17 From the Tukey and Bonferroni in table three it can be said that the participants have more attention to the CCA data in SBSC 5perspective and SBSC 4 perspective than the traditional BSC (control) by developing their cognitive effort. Meanwhile, there was no difference in attention significantly from the participants to the CCA data in SBSC 5 perspective and SBSC 4 perspective.
This means that the form of the CCA data display in BSC is not an important factor in the decision.
For participants the existence of CCA data in decision-making is a more important factor to be considered rather than just reporting model (SBSC 5 perspective or SBSC 4 perspective). This happens because the number of CCA data items either inSBSC 5 perspective the and the SBSC 4 perspective is the same, and only differ in terms of data distribution of CCA within the dimensions of the BSC.
The results of this study differ from research result sof Alewine, Hank c., and Dan N. Stone, (2009), which indicates that the total effort which is indicated (measured) with a total time used by participant for each case (BSC and SBSC (5 or 4 perspective)) is the same. Differences in results is expected by the different uses of variables measuring dimensions of cognitive effort (time versus intensity). Use of intensity dimension were more likely to be able to grasp what is felt during use of participants cognitive efforts compared to time dimension use. In accordance with the advice of Alewine Hank c., and Dan N. Stone, (2009) the use of four dimensions, ie direction, duration, intensity and strategy development (Bonner and Sprinkle, 2002) simultaneously required for advanced research.
The Effect of metric data of carbon cost accounting on carbon friendly investment (hypothesis two).
Hypothesis two test whether there was an effect of the presence of carbon cost accounting data (CCA) to investment decision which is friendly carbon emissions (carbon friendly investment).
In this case it will be tested the mean difference of carbon friendly investment in the case of the
18 traditional BSC, SBSC 5 perspective and SBSC 4 perspective (carbon data embedded on four
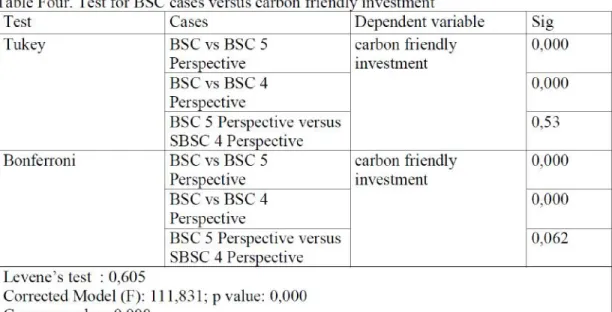
traditional bsc perspective). Complete results of hypothesis two testing can be seen in Appendix One, and briefly outlined in Table Four.
Table four shows that the value of Levene's test 0.605, which means that the dependent variable has the same variance, thus does not violate the assumption of anova. Tukey and Bonferroni value indicates that the mean difference value of the carbon-friendly investment is significant at the 0.000 p-value <0.05 for the case of bsc and sbsc (5 or 4 perspective).
The results of this study differ partially with the results of research done by Alewine, Hank C., and Dan N. Stone, (2009), which indicates that the value of investments for environmentally friendly investment differed significantly for traditional BSC cases with SBSC four perspective, but for the traditional BSC case with the SBSC perspective 5 showed no significant difference in value.
SBSC 5 perspective versus SBSC 4 perspective (hypotheses three and four)
Hypothesis three tested whether the participants would pay more attention to the CCA display data in the form of SBSC 5 perpsective than SBSC 4 perpsective form. The participants attention is
19 measured by their total cognitive effort. Hypothesis test indicated that each case (BSC, SBSC 5 perspective, SBSC 4 perspective ) influence the use of cognitive effort (df 2, f = 45.922), which means attention of each participant on each case varies (see equation (1)). But Tukey and Bonferroni value is not significant at the α = 0.05 for SBSC 5 perpective and SBSC 4 perspective (respectively were 0.053 and 0.062). As mentioned in hypothesis 1 above, it is because participants did not look important the form of CCA data reporting model in the scorecard. Participants were more likely to see the importance of the meaning of CCA data in decision-making compared to the data displays model in the scorecard.
Hypothesis 4 test whether CCA data information presented in the scorecard model SBSC 5 perspective (CCA data added) would make participants put more investment in carbon-friendly investment compared with the SBSC data presented in the model SBSC 4 perspective. Bonferroni and Tukey values in SBSC 5 perspective and BSC 4 perspective are respectively 0.921 and 0.561.
From these values of Bonferroni and Tukey can be concluded that the SBSC 5 perspective and SBSC 4 perspective model gives no significant impact on investment decisions.
Even so, through the analysis technique with independent sample t-test showed a significant mean difference at the α <0.05 (p-value 0.021 on the equal variance assummed) (see appendix one).
The differences of Anova value test with independent sample t-test was due to differences in the meaning of the two test analysis techniques. Anova, in addition to showing the significance of value differences, also show the existence of 'value effect' of the independent variables on dependent variables. While the independent sample t-test showed only differences two mean for independent samples, without being able to connect the value of these differences with the causality of
independent-dependent variable.
20 Impact of level of knowledge on decision making
As stated in hypothesis 5, that the level of knowledge will give different impact in making
investment decisions, hypothesis five test the effect of levels of knowledge (level of education) on carbon-friendly investment decisions. Results of testing with Two Way Anova showed no significant influence of the level of knowledge or interaction between level of knowledge with each BSC case on carbon-friendly investment. The test results are summarized in equation (2) and tables five
Y = α + β1 (X1) + β2 (X2) + β2 (X1.X2) + ε ...
(2) p-value: 0,000 0,485 0,419
F : 29,089
Levene’s test: F=1,164; p-value: 0,338 where
Y = Carbon Friendly Investment
X1 = Cases (BSC, SBSC 5 Perspective, SBSC 4 Perspective (CCA Embedded) X2 = level of knowledge (education level)
X1. X2 = Interaction between Cases and level of knowledge
21 The absence of significant influence of educational level on carbon-friendly investment decision is expected because participants have quite homogeneous focus on carbon-friendly investment. That is, participants have the uniformity of the view that the issue of global warming caused by carbon emissions is a crucial factor to consider in any investment decision. This conjecture is proved by comparative analysis between the means value of investments in carbon-friendly versus stronger in achieving financial investment (see Table Six)
From the Table Six it can be seen that in the case of traditional BSC the mean value between the carbon friendly investment with stronger in achieving the investment is very much different, with a significance level p-value 0.000. While in SBSC cases the mean value for both is not significantly different.
V. CONCLUSIONS AND LIMITATIONS Conclusions
Specifically, the research concludes that:
1. Participants considers that carbon-friendly investment is one important factor in achieving the company goal attainment factors other than financial. This is evidenced by the attention of participants to the CCA data in SBSC and achieving a balance in the company's goals, both in terms of economy or ecology.
22 2. The result of study shows that there was no difference in attention (cognitive effort) and
carbon-friendly investment value between SBSC 5 perspective and SBSC 4 perspective, indicating that more participants find it important to the value factor of the CCA data information in the scorecard rather than the form of CCA display data in scorecard.
In general, this research contributes to the field of environmental accounting, particularly carbon cost accounting, accounting information systems, management accounting, and ecology.
However, further research in the field of carbon cost accounting will contribute towards controlling the rate of global warming. Meanwhile in the field of accounting information system, until now it has not been found the standard form of data reporting model carbon emissions produced in the
company's annual report. Measurement differences of financial data and carbon emissions makes the integration of carbon emissions reporting in the annual report is getting further to do not find its form. However, the BSC model is allegedly able to bridge differences in the measurement of the data matrix (Hibbets, Aleecia R., 2006; Malina, Mary A., and Frank H. Selto, 2001; Marcela Porporato, 2009,Ttayler,William B., 2009). In the field of management accounting and ecology, in-depth research for the topic of carbon cost accounting will provide great benefits in the preparation of corporate strategy based on achieving synergy on economy and ecology.
Limitations
This study has limitations in terms of measuring cognitive effort. This study uses only one dimension of cognitive effort, that is intensity. Allewine, Hank C., and Dan N. Stone (2009) suggest the use of four dimensions of cognitive effort that is, directions, duration, intensity and strategy.
Another limitation is the use of respondents. Respondents in this study were participants consisting of students, lecturers and accountants with experiment research design. However, further research should be designed in a model of empirical research with real respondents (bussiness praticioners or managers of company).
23 REFERENCES
Alewine, HC., and Dan N Stone (2009), How Does Environemental Accounting Information Influence Attention and Investment
Banker, R. D., H. Chang, and M. J. Pizzini. 2004. The Balanced Scorecard: Judgmental Effects of Performance Measures Linked to Strategy. Accounting Review 79 (1):1-23.
Bible, L., S. Kerr, and M. Zanini. 2006. The Balanced Scorecard: Here and Back. Management Accounting Quarterly 7 (4):18-23.
Bonner, S. E., and G. B. Sprinkle. 2002. The effects of monetary incentives on effort and task performance: theories, evidence, and a framework for research. Accounting, Organizations
& Society 27 (4/5):303-345
Cacioppo, JT., et al., (1984), The Need for cognition, Journal of Personality and Social Psychology, 42(1), pp. 116-32.
Campbell, Dennis, Srikant Datar, Susan Kulp, and V.G. Narayanan, (2002), Using the Balanced Scorecard as a Control System for Monitoring and Revising Corporate Strategy, Harvard Business School
Dilla, W. N., and P. J. Steinbart. 2005. The effects of alternative supplementary display formats on balanced scorecard judgments. International Journal of Accounting Information Systems (6): 159-176.
Driesen, David M., (2007), Sustainable Development and Market Liberalism’s Shotgun Wedding:
Emission Trading Under The Kyoto Protocol, htp://ssrn.com
Epstein J., Marc, and Martin Freedman (1994), Sosial Disclosure and the Individual Investor, Accounting, Auditing & Accountability Journal, Vol. 7, No. 4, pp. 94-109
Fink, A., B. Marr, A. Siebe, and J.-P. Kuhie. 2005. The future scorecard: combining external and internal scenarios to create strategic foresight. Management Decision 43 (3):360-381 Garrison, R. H., E. W. Noreen, and P. C. Brewer. 2006. Managerial Accounting. 11th ed. New
York: McGraw-Hill/Irwin
Hackston, D. and M. J. Milne. 1996. Some Determinants of Social and Environmental Disclosures in New Zeeland Companies. Accounting, Auditing, and Accountability Journal, Vol. 9 No. 1.
24 Hibbets, Aleecia R.; Michael L. Roberts, and Thomas L. Albright, (2006), Common Measures
Bias in the Balanced Scroecard: Cognitive Effort and General Problem Solving Ability, http://ssrn.com
Ja’far S., Muhammad and Lisa K. (2009a), Carbonaacounting: Implikasi Strategis Perekayasaan Akuntansi Manajemen, Proceeding: Seminar Nasional Akuntansi XII, Palembang, 2009, IAI.
Ja’far S., Muhammad and Lisa K. (2009b), Need Assesments: Standar Akuntansi Karbon dan Praktik Carbonaccounting, Proceeding, The 3rd National conference, Toward a New Indonesia
Business Architecture, Fakultas Ekonomi, Unika Widya Mandala, Surabaya, p. 397-415 Ja’far S., Muhammad and Dian tanila C., (2009c), Identifikasi Praktik Pengungkapan Lingkungan
serta Pengaruh Faktor Keuangan dan Non-Keuangan Perusahaan terhadap Luas pengungkapan Lingkungan di Indonesia, Proceeding, Dampak Country Risk terhadap Perusahaan ditinjau dari Aspek Manajemen dan Akuntansi, Universitas Kristen Duta Wacana, Yogyakarta, p. 123- 147.
Kaplan, R. S., and D. P. Norton. 1992. The Balanced Scorecard--Measures That Drive Performance. Harvard Business Review 70 (1):71-79
Libby, T., S. E. Salterio, and A. Webb. 2004. The Balanced Scorecard: The Effects of Assurance and Process Accountability on Managerial Judgment. Accounting Review 79 (4):1075- 1094
Lipe, M. G., and S. E. Salterio. 2000. The Balanced Scorecard: Judgmental Effects of Common and Unique Performance Measures. Accounting Review 75 (3):283
Lurie, N. H., and C. H. Mason. 2007. Visual Representation: Implications for Decision Making.
Journal of Marketing 71 (1):160-177.
Löschel, Andreas, and Zhong Xiang Zhang, (2002), The Economic and Environmental Implications of the US Repudiation of the Kyoto Protocol and the Subsequent Deals in Bonn and
Marrakec
Malina, Mary A., and Frank H. Selto, (2001), Communication and Controlling Strategy, An Empirical Study of The Effectiveness of The Balanced Scorecard, http://srn.com
Milis, K., and R. Mercken. 2004. The use of the balanced scorecard for the evaluation of Information and Communication Technology projects. International Journal of Project Management 22 (2):87-97
Porporato, Marcela. (2009), Balanced Scorecard design preferences according to subjects’
expertise and purpose of use
Ratnatunga, Janek, (2007), Carbon Cost Accounting: The Impact of Global Warming on the Cost Accounting Profession, JAMAR, Vol. 5 No. 2, pp. 1-8
25 Ratnatunga, Janek, (2008), Carbonomics: Strategic Management Accounting Issues, JAMAR,
Vol. 6 No. 1, h.1-10
Salomone, Roberta and Giulia Galluccio. 2004. Environmental Issues And Financial Reporting Trends: A Survey In The Chemical And Oil& Gas Indusries tanggal 16 November 2006.
Silva, Bruno Folly Guimarães e, and Victor Prochnik2, 2005, Seven Challenges for the Implementation of Balanced Scorecard in Hospitals1 (Paper Presented at The 3rd Conference on Performance Measurement and Management Control, Nice, September 22-23, 2005), http://srn.com
Tayler, William B. (2009), The Balanced Scorecard as a Strategy-Evaluation Tool:The Effects of Implementation Involvement and a Causal-Chain FocusJuly 2009
26 Appendix One. Statistical Test
Descrptive Data
Gender
35 55,6 55,6 55,6
28 44,4 44,4 100,0
63 100,0 100,0
L P Total
Valid Frequency Percent Valid Percent Cumulative Percent
Education
20 31,7 31,7 31,7
13 20,6 20,6 52,4
30 47,6 47,6 100,0
63 100,0 100,0
undergraduate student Master / Graduate Student Graduate (Master)
Total
Valid Frequency Percent Valid Percent Cumulative
Percent
Profession
23 36,5 36,5 36,5
32 50,8 50,8 87,3
8 12,7 12,7 100,0
63 100,0 100,0
Student Lecturer Accountant Total
Valid Frequency Percent Valid Percent Cumulative Percent Statistics
63 63 63 63 63
0 0 0 0 0
2,16 1,76 2,29 1,92
2,00 2,00 2,00 2,00
3 2 1 1
-,321 ,308 ,627 ,148
,302 ,302 ,302 ,302
-1,662 -,731 -,511 -1,454
,595 ,595 ,595 ,595
Valid Missing N
Mean Median Mode Skewness
Std. Error of Skewness Kurtosis
Std. Error of Kurtosis
Gender Education Profession Field Cases
27 Hypotheses Test
Impact of Cases (BSC; BSC 5 perpsective; BSC 4 perspective (Carbon Cost Accounting Information Added) on Cognitive Effort (Intensity)
Field
22 34,9 34,9 34,9
15 23,8 23,8 58,7
16 25,4 25,4 84,1
6 9,5 9,5 93,7
4 6,3 6,3 100,0
63 100,0 100,0
accounting finance
Management acconting Auditing
production/marketing Total
Valid Frequency Percent Valid Percent Cumulative
Percent
Cases
23 36,5 36,5 36,5
22 34,9 34,9 71,4
18 28,6 28,6 100,0
63 100,0 100,0
Traditionally BSC SBSC-5 persp (Carbon Inf. Added)
SBSC-4 Persp (Carbon Inf. Embedded) Total
Valid Frequency Percent Valid Percent Cumulative
Percent
Between-Subjects Factors Traditionally
BSC 23
SBSC-5 persp (Carbon Inf.
Added)
22
SBSC-4 Persp (Carbon Inf.
Embedded)
18 1
2
3
Cases Value Label N
Descriptive Statistics
63 0 19000000 9276505 6041201 -,326 ,302 -1,177 ,595
63 5,00 17,00 11,7143 3,11308 -,397 ,302 -,802 ,595
63 Carbon Friendly
Investment Total_Cog Valid N (listwise)
Statistic Statistic Statistic Statistic Statistic Statistic Std. Error Statistic Std. Error
N Minimum Maximum Mean Std.
D i ti Skewness Kurtosis
28
Levene's Test of Equality of Error Variancesa Dependent Variable: Total_Cog
,484 2 60 ,619
F df1 df2 Sig.
Tests the null hypothesis that the error variance o the dependent variable is equal across groups.
Design: Intercept+Cases a.
Tests of Betw een-Subjects Effects Dependent Variable: Total_Cog
363,432a 2 181,716 45,922 ,000
8746,775 1 8746,775 2210,411 ,000
363,432 2 181,716 45,922 ,000
237,425 60 3,957
9246,000 63
600,857 62
Source
Corrected Model Intercept
Cases Error Total
Corrected Total
Type III Sum
of Squares df Mean Square F Sig.
R Squared = ,605 (Adjusted R Squared = ,592) a.
29 Impact of Cases (BSC; BSC 5 perpsective; BSC 4 perspective (Carbon Cost Accounting Information Added) on Carbon Friendly Investment
Between-Subjects Factors Traditionally
BSC 23
SBSC-5 persp (Carbon Inf.
Added)
22 SBSC-4
Persp (Carbon Inf.
Embedded)
18 1
2
3
Cases Value Label N
Levene's Test of Equality of Error Variancesa Dependent Variable: Carbon Friendly Investment
,506 2 60 ,605
F df1 df2 Sig.
Tests the null hypothesis that the error variance o the dependent variable is equal across groups.
Design: Intercept+Cases a.
Multiple Comparisons Dependent Variable: Total_Cog
-5,2530* ,59322 ,000 -6,6786 -3,8273
-4,6014* ,62601 ,000 -6,1059 -3,0970
5,2530* ,59322 ,000 3,8273 6,6786
,6515 ,63222 ,561 -,8679 2,1709
4,6014* ,62601 ,000 3,0970 6,1059
-,6515 ,63222 ,561 -2,1709 ,8679
-5,2530* ,59322 ,000 -6,7140 -3,7919
-4,6014* ,62601 ,000 -6,1433 -3,0596
5,2530* ,59322 ,000 3,7919 6,7140
,6515 ,63222 ,921 -,9056 2,2086
4,6014* ,62601 ,000 3,0596 6,1433
-,6515 ,63222 ,921 -2,2086 ,9056
(J) Cases
SBSC-5 persp (Carbon Inf. Added)
SBSC-4 Persp (Carbon Inf. Embedded) Traditionally BSC SBSC-4 Persp (Carbon Inf. Embedded) Traditionally BSC SBSC-5 persp (Carbon Inf. Added)
SBSC-5 persp (Carbon Inf. Added)
SBSC-4 Persp (Carbon Inf. Embedded) Traditionally BSC SBSC-4 Persp (Carbon Inf. Embedded) Traditionally BSC SBSC-5 persp (Carbon Inf. Added)
(I) Cases Traditionally BSC
SBSC-5 persp (Carbon Inf. Added)
SBSC-4 Persp (Carbon Inf. Embedded) Traditionally BSC
SBSC-5 persp (Carbon Inf. Added)
SBSC-4 Persp (Carbon Inf. Embedded) Tukey HSD
Bonferroni
DifferenceMean
(I-J) Std. Error Sig. Lower Bound Upper Bound 95% Confidence Interval
Based on observed means.
The mean difference is significant at the ,05 level.
*.
30
Multiple Comparisons Dependent Variable: Carbon Friendly Investment
-9952173,9* 842266,9 ,000 -11976323,51 -7928024,31 -12086607* 888813,2 ,000 -14222617,66 -9950596,83 9952173,91* 842266,9 ,000 7928024,31 11976323,51 -2134433,3 897637,8 ,053 -4291651,21 22784,55 12086607* 888813,2 ,000 9950596,83 14222617,66 2134433,33 897637,8 ,053 -22784,55 4291651,21 -9952173,9* 842266,9 ,000 -12026637,82 -7877710,01 -12086607* 888813,2 ,000 -14275712,49 -9897502,00 9952173,91* 842266,9 ,000 7877710,01 12026637,82 -2134433,3 897637,8 ,062 -4345273,20 76406,53 12086607* 888813,2 ,000 9897502,00 14275712,49 2134433,33 897637,8 ,062 -76406,53 4345273,20 (J) Cases
SBSC-5 persp (Carbon Inf. Added)
SBSC-4 Persp (Carbon Inf. Embedded) Traditionally BSC SBSC-4 Persp (Carbon Inf. Embedded) Traditionally BSC SBSC-5 persp (Carbon Inf. Added)
SBSC-5 persp (Carbon Inf. Added)
SBSC-4 Persp (Carbon Inf. Embedded) Traditionally BSC SBSC-4 Persp (Carbon Inf. Embedded) Traditionally BSC SBSC-5 persp (Carbon Inf. Added)
(I) Cases Traditionally BSC
SBSC-5 persp (Carbon Inf. Added)
SBSC-4 Persp (Carbon Inf. Embedded) Traditionally BSC
SBSC-5 persp (Carbon Inf. Added)
SBSC-4 Persp (Carbon Inf. Embedded) Tukey HSD
Bonferroni
DifferenceMean
(I-J) Std. Error Sig. Lower Bound Upper Bound 95% Confidence Interval
Based on observed means.
The mean difference is significant at the ,05 level.
*.
Tests of Betw een-Subjects Effects Dependent Variable: Carbon Friendly Investment
1,784E+015a 2 8,921E+014 111,831 ,000
5,854E+015 1 5,854E+015 733,814 ,000
1,784E+015 2 8,921E+014 111,831 ,000
4,786E+014 60 7,977E+012
7,684E+015 63
2,263E+015 62
Source
Corrected Model Intercept
Cases Error Total
Corrected Total
Type III Sum
of Squares df Mean Square F Sig.
R Squared = ,788 (Adjusted R Squared = ,781) a.
31 Additional Analysis
Impact of Interaction Effect Between Cases and Education on Carbon Friendly Investment
Levene's Test of Equality of Error Variances a Dependent Variable: Carbon Friendly Investment
1,164 8 54 ,338
F df1 df2 Sig.
Tests the null hypothesis that the error variance of the dependent variable is equal across groups.
Design: Intercept+Cases+Education+Cases
* Education a.
Tests of Between-Subjects Effects Dependent Variable: Carbon Friendly Investment
1,837E+015a 8 2,296E+014 29,089 ,000
5,149E+015 1 5,149E+015 652,395 ,000
1,404E+015 2 7,021E+014 88,961 ,000
1,159E+013 2 5,793E+012 ,734 ,485
3,134E+013 4 7,835E+012 ,993 ,419
4,262E+014 54 7,892E+012
7,684E+015 63
2,263E+015 62
Source
Corrected Model Intercept Cases Education
Cases * Education Error
Total
Corrected Total
Type III Sum
of Squares df Mean Square F Sig.
R Squared = ,812 (Adjusted R Squared = ,784) a.
32
Post Hoc for Cases
Post Hoc for Education
Multiple Comparisons Dependent Variable: Carbon Friendly Investment
-9952173,9* 837769,8 ,000 -11971185,57 -7933162,25 -12086607* 884067,5 ,000 -14217195,78 -9956018,71 9952173,91* 837769,8 ,000 7933162,25 11971185,57 -2134433,3 892845,0 ,052 -4286175,50 17308,84 12086607* 884067,5 ,000 9956018,71 14217195,78 2134433,33 892845,0 ,052 -17308,84 4286175,50 -9952173,9* 837769,8 ,000 -12022175,75 -7882172,07 -12086607* 884067,5 ,000 -14271003,84 -9902210,65 9952173,91* 837769,8 ,000 7882172,07 12022175,75 -2134433,3 892845,0 ,061 -4340517,79 71651,13 12086607* 884067,5 ,000 9902210,65 14271003,84 2134433,33 892845,0 ,061 -71651,13 4340517,79 (J) Cases
SBSC-5 persp (Carbon Inf. Added)
SBSC-4 Persp (Carbon Inf. Embedded) Traditionally BSC SBSC-4 Persp (Carbon Inf. Embedded) Traditionally BSC SBSC-5 persp (Carbon Inf. Added)
SBSC-5 persp (Carbon Inf. Added)
SBSC-4 Persp (Carbon Inf. Embedded) Traditionally BSC SBSC-4 Persp (Carbon Inf. Embedded) Traditionally BSC SBSC-5 persp (Carbon Inf. Added)
(I) Cases Traditionally BSC
SBSC-5 persp (Carbon Inf. Added)
SBSC-4 Persp (Carbon Inf. Embedded) Traditionally BSC
SBSC-5 persp (Carbon Inf. Added)
SBSC-4 Persp (Carbon Inf. Embedded) Tukey HSD
Bonferroni
DifferenceMean
(I-J) Std. Error Sig. Lower Bound Upper Bound 95% Confidence Interval
Based on observed means.
The mean difference is significant at the ,05 level.
*.
33 Analysis Compare Mean Between Carbon Friendly Investment (A) Versus BSC Stronger Financial Investment (B), for:
Case One
Paired Samples Statistics
2347826 23 2897627,488 604197,1 2E+007 23 2897627,488 604197,1 Carbon Friendly
Investment Stronger in achieving financial Pair1
Mean N Std. Deviation Std. Error Mean
Paired Samples Correlations
23 -1,000 ,000
Carbon Friendly Investment & Stronger in achieving financial Pair1
N Correlation Sig.
Multiple Comparisons Dependent Variable: Carbon Friendly Investment
-928728,08 1000838 ,625 -3340732,64 1483276,48 1733828,33 810966,8 ,092 -220588,55 3688245,21 928728,08 1000838 ,625 -1483276,48 3340732,64 2662556,41* 932815,2 ,017 414486,81 4910626,01 -1733828,3 810966,8 ,092 -3688245,21 220588,55 -2662556,4* 932815,2 ,017 -4910626,01 -414486,81 -928728,08 1000838 1,000 -3401647,86 1544191,71 1733828,33 810966,8 ,111 -269947,39 3737604,05 928728,08 1000838 1,000 -1544191,71 3401647,86 2662556,41* 932815,2 ,018 357711,77 4967401,05 -1733828,3 810966,8 ,111 -3737604,05 269947,39 -2662556,4* 932815,2 ,018 -4967401,05 -357711,77 (J) Education
Master / Graduate Student Graduate (Master) undergraduate student Graduate (Master) undergraduate student Master / Graduate Student Master / Graduate Student Graduate (Master) undergraduate student Graduate (Master) undergraduate student Master / Graduate Student (I) Education
undergraduate student Master / Graduate Student Graduate (Master) undergraduate student Master / Graduate Student Graduate (Master) Tukey HSD
Bonferroni
DifferenceMean
(I-J) Std. Error Sig. Lower Bound Upper Bound 95% Confidence Interval
Based on observed means.
The mean difference is significant at the ,05 level.
*.
Paired Samples Test
-15304347,826 5795254,976 1208394 -17810404 -12798292 -12,665 22 ,000 Carbon Friendly
Investment - Stronger in achieving financial Pair1
Mean Std. Deviation Std. Error
Mean Lower Upper
95% Confidence Interval of the Difference Paired Differences
t df Sig.
(2-tailed)
34 Case Two and Three
FILTER OFF.
USE ALL.
EXECUTE . USE ALL.
COMPUTE filter_$=(Cases > 1).
VARIABLE LABEL filter_$ 'Cases > 1 (FILTER)'.
VALUE LABELS filter_$ 0 'Not Selected' 1 'Selected'.
FORMAT filter_$ (f1.0).
FILTER BY filter_$.
EXECUTE . T-TEST
PAIRS = Investment_A WITH Investment_B (PAIRED) /CRITERIA = CI(.95)
/MISSING = ANALYSIS.
Paired Samples Statistics
1E+007 40 2948283,856 466164,6 1E+007 40 18743529,364 2963612 Carbon Friendly
Investment Stronger in achieving financial Pair1
Mean N Std. Deviation Std. Error Mean
Paired Samples Correlations
40 -,301 ,059
Carbon Friendly Investment & Stronger in achieving financial Pair1
N Correlation Sig.