Our model investigated the sensitivity of the biofilm to the growth rate of the microbial population and the concentration of the antibiotic during antimicrobial treatment. In untreated biofilm, cell death begins at the lower core of the biofilm, while in treated biofilms, cell death occurs at the upper surface of the biofilm. Biofilm development involves many sequential stages, such as nutrient diffusion, microbial growth and proliferation, EPS production to adjust biofilm structure, quorum sensing, cell death, and active dispersal, which occur simultaneously over a wide range of spatial and temporal scales.
Then microbes begin to grow on the attached surface and produce EPS, which represents the home of the biofilm cells. The polyhydroxyl groups in EPS anchor the bacteria in the biofilm to the surface through hydrogen bonding. Processes that change the biofilm volume (biomass growth, cell death and cell detachment) are much slower than processes involved in substrate mass balance (diffusion and convection).
Although there is no generic barrier to antibiotic molecular diffusion, penetration can be profoundly delayed due to a neutralizing reaction between the antimicrobial agent and a component of the biofilm. The biofilm expansion is mainly due to cell growth, which needs dissolved nutrients in the fluid flow. This model predicts the biofilm structure by combining discrete representation of the solid phase with classical continuous methods for soluble components.
Mass transfer boundary layer is always located at a fixed distance above the top of the biofilm.
Substrate transport and transformation
Rate of biomass production
Cell division
Cell death
Bacteria produce net growth if R is greater than 1, otherwise the biomass falls below a minimum value and the cell has reached stationary phase. This is an attempt to account for bacterial death under conditions of low (or no) substrate concentration.
Cell detachment
EPS Production
Maintaining microbial cells under minimal nutrient concentrations leads to cell shrinkage and serves as an energy reserve for the neighboring population. Their observations explained that EPS production reduced the growth of producers and stimulated the growth of non-producers due to the energy costs involved. The roughness and roughness of the biofilm decreased and the porosity increased due to the production of EPS [50].
investigated the mechanisms through which the EPS matrix produced by Streptococcus mutants modulates the three-dimensional (3D) architecture and population shifts during biofilm morphogenesis on a saliva-coated apatitic surface using a mixed bacterial species system [60] . When the range of EPS in a given network element exceeds a threshold value, it is split into two parts and 50% of the EPS is moved to a new element according to the protocol of least resistance. The EPS matrix is described by the continuum representation as an incompressible viscous fluid that can expand and contract due to formation and consumption processes.
The cells move as a result of a pushing mechanism between cells in colonies and by an advective mechanism supported by the EPS dynamics.
Quorum sensing
The rate of transition from up-regulated to down-regulated states is taken as Q-=β1 +γAc.
Autoinducer transport and transformation
Antimicrobial drug administration and killing
Due to the stochastic nature of the model, the individual results of the simulated biofilm experiments were never exactly duplicated, even though the simulations were run under similar parameters. Since it is not possible to present all the simulation results, here we present a selected few. We found that primary cell death occurs at the bottom of the biofilm, which is due to the fact that continuous nutrient depletion at the bottom of the biofilm 4.1 and 4.2.
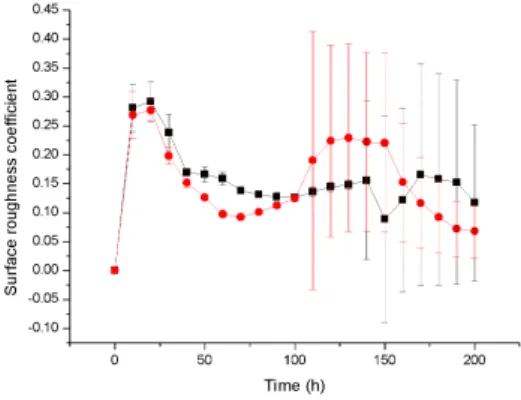
Cells located in the inner part of the biofilm continuously starve because no or very few nutrients are available, leading to premature cell death and causing extensive damage to the biofilm. 4.3. A special structural organization of the biofilm brings individual cells into a highly intact form, helps the biofilm resist compounds such as antibiotics and also in the exchange of genetic material between the cells of the biofilm. The surface roughness of biofilms is defined as the ratio of the standard deviation of the biofilm height to its mean height.
As a result, the improved mass transfer of nutrients to the microbial population will lead to an increase in cell growth rate, which may also be one of the reasons for a larger cell population at a higher substrate concentration. The neutralization process depends on the local concentration of the antibiotic and also the local concentration of the biomass. After antibiotic treatment, cell death begins at the surface of the biofilm, where the concentration of the antibiotic is relatively high 4.8.
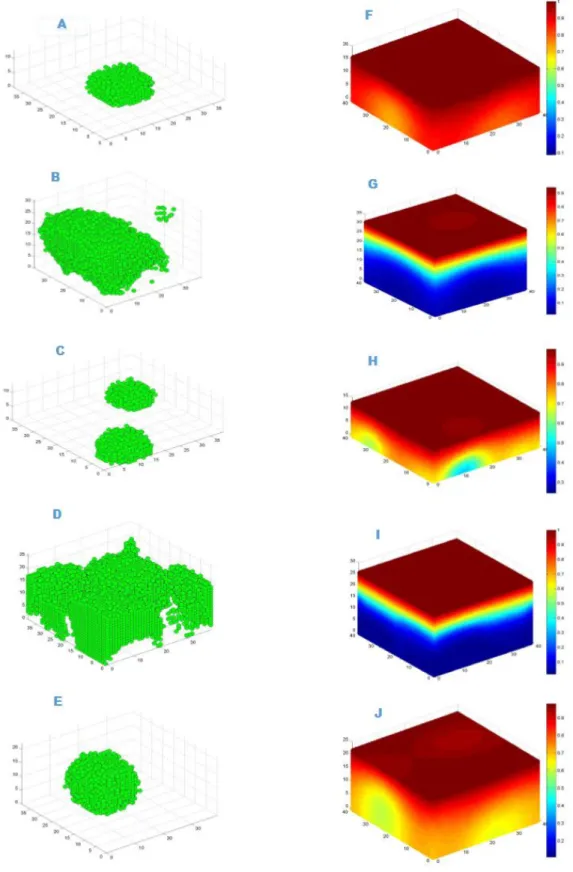
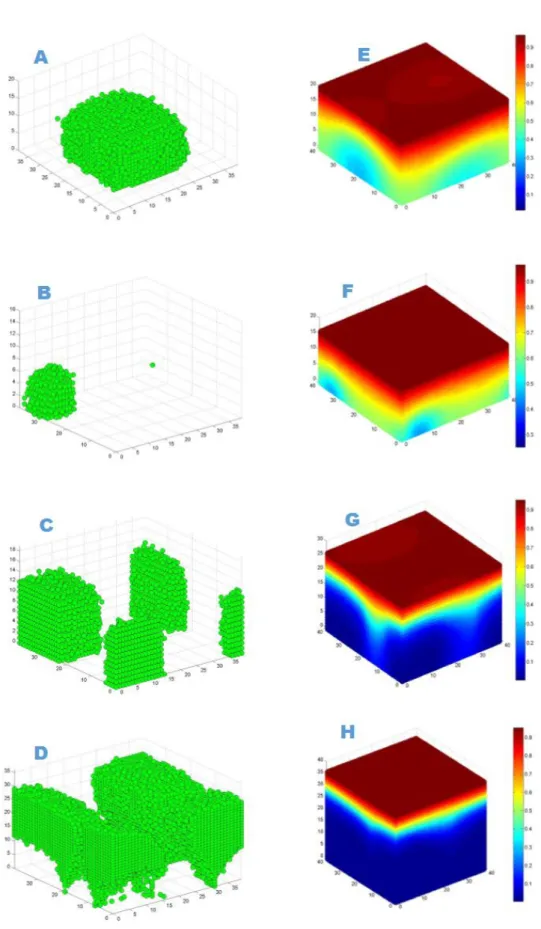
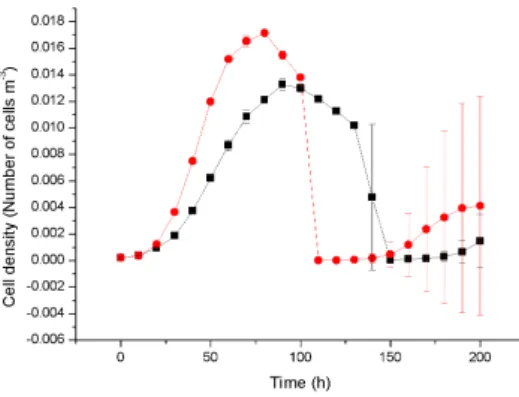
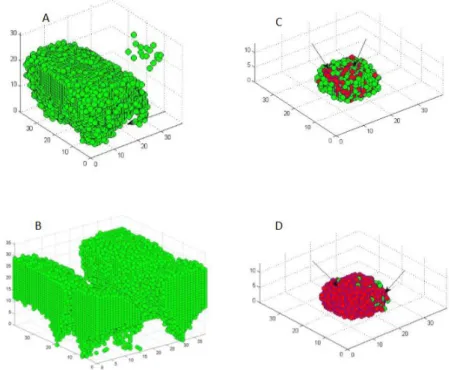
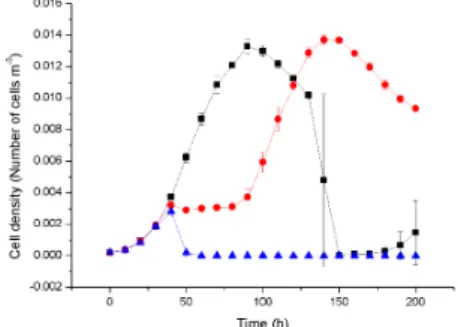
In this figure, graphs A) and B) show that cell death occurs at the bottom of untreated biofilm leaving hollow structures. Graphs C) and D) show antibiotic-treated biofilm where most of the cell death (red color) occurs at the surface of the biofilm. the biofilm. Due to penetration limitations of the antimicrobials through compact biofilm, slowly growing cells survive in the lower core of the biofilm. Time series of the cell density data representing the mean and standard deviation of four replicate simulations.
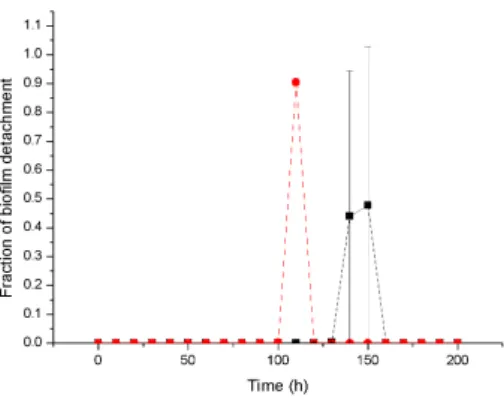
The high population of cells in untreated biofilms consumes a large amount of substrate, resulting in very little or no substrate at the bottom of the biofilm, the cell at the bottom constantly starves and dies. Cell death at the bottom of the biofilm in the untreated biofilm removes a large portion of the biofilm by detachment, while in the treated biofilm most of the cell death occurs at the surface of the biofilm 4.10. Our biofilm simulations initially started by placing 9 microbial cells in contiguous compartments at the bottom of the modeling domain, leading to the formation of a very compact structure and structural vari-.
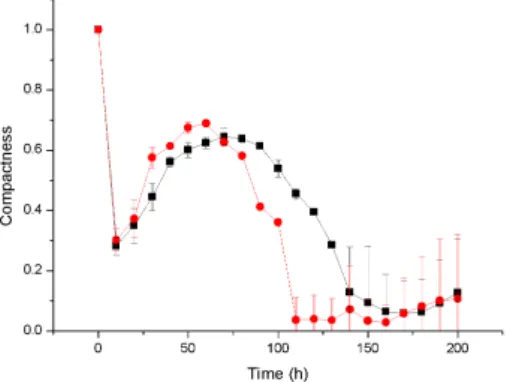
This physiological structure may helped biofilms to resist antibiotic penetration to the bottom core of the biofilm and supported for bacterial population recovery which also clearly correlated with cell viability ratio of biofilm which is treated with low concentration of antibiotic for same duration 4.11. Time series of the cell density data representing mean and standard deviation from four replicate simulations.
Growth rate dependent Biofilm resistance
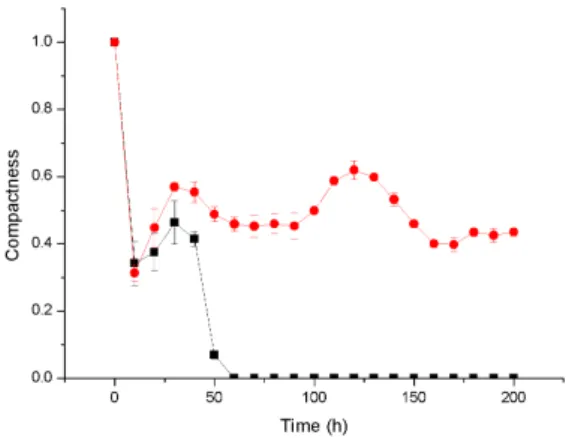
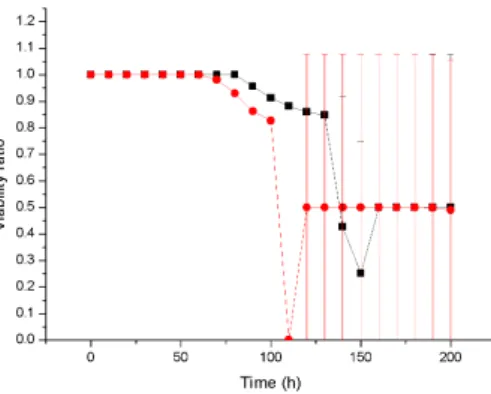
Similarly, the viability ratio of cells with a high growth rate at a high substrate concentration decreases at the start of antibiotic therapy and remains constant during treatment, while the viability ratio of a low growth rate biofilm at a lower substrate concentration decreases to zero due to high sensitivity 4,16. Antibiotic therapy severely damages the slow-growing biofilm and destroys the biofilm structure, resulting in a rougher surface, while the faster-growing biofilm continuously generates cells that fill the biofilm gap and make it smoother 4.17. A 3D cellular automaton model was developed as a tool to interpret/investigate biofilm sensitivity to antibiotics.
Our investigation shows that faster growing cells die faster and cell death starts at the bottom of the untreated biofilms due to continuous nutrient depletion. While the biofilm is treated with a low concentration of antibiotics, faster growing biofilms form a very compact structure that can help to flush the antimicrobials out of the biofilm and show complete resistance to antimicrobials. Similarly, antimicrobial therapy at low concentration may enable regrowth of the biofilm by killing cells at the top of the biofilm which likely leads to substrate penetration to the bottom of the biofilm.
At high concentration of antibiotic treatment, the biofilm structure disturbs and forms a rougher surface due to the erosion of bacterial cells from the surface. We observed that biofilm resistance is not only dependent on antibiotic concentration, but also depends on biofilm growth rate, which was our ultimate goal for the investigation. Although our simulations were not validated with experimental results, it sheds light on the mechanism of biofilm resistance.
Expression of biofilm-related genes in Staphylococcus epidermidis during in vitro and in vivo foreign infections. Neutrophil enhancement of Pseudomonas aeruginosa biofilm development: human F-actin and DNA as targets for therapy. Bacterial biofilms: development, spread and therapeutic strategies at the dawn of the post-antibiotic era.
Biofilm-detached cells transition from sessile to planktonic phenotype: a comparative study of adhesion and physiological characteristics in Pseudomonas aeruginosa. Effective antibiotic combinations against extremely drug-resistant Pseudomonas aeruginosa with reduced susceptibility to polymyxin B. Planktonic catabolic communities versus biofilm: importance of biofilm for species selection and pesticide degradation.
Modeling the evolution of biofilm density including active bacteria, inert biomass and extracellular polymeric substances. Influence of hydrodynamics and cell signaling on the structure and behavior of Pseudomonas aeruginosa biofilms.