The aim of this work is to reduce the number of calculations while detecting outliers and to study the suitability of the method for a certain class of datasets. We propose three methods, based on the characteristics of the clusters, to identify the clusters that may not contain outliers and such clusters are removed from the dataset.
Outlier Detection
One important view on which outlier detection can be classified is based on the distance between the data points. Most of the outlier detection methods use some quantitative parameters to identify a data point as an outlier.
Objective of the thesis
The outlier factor based on the local distance of the outlier (ldof) [21] is a good measure for real-world distributed datasets. After removing some clusters from the given dataset, the remaining dataset becomes sparse and soldof is used in our methods as an outlier.
Contributions of the Thesis
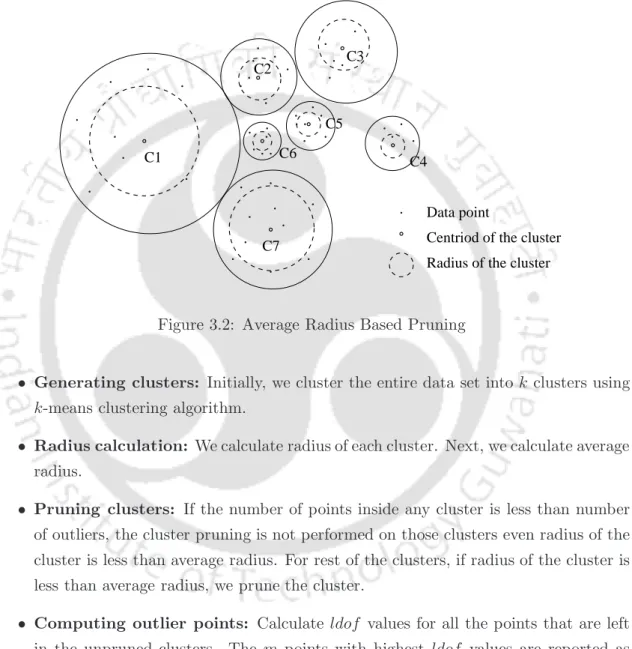
Radius is the average distance of all data points from the centroid of the cluster. Pruning the inliers points from the clusters reduces the data points and eventually reduces the distance calculations.
Organization of the Thesis
Introduction
The clustering algorithms can be modified to include outlier detection as a by-product of their execution. For example, the clusters are used to compress the data based on the data summary.
Dissimilarity Measures
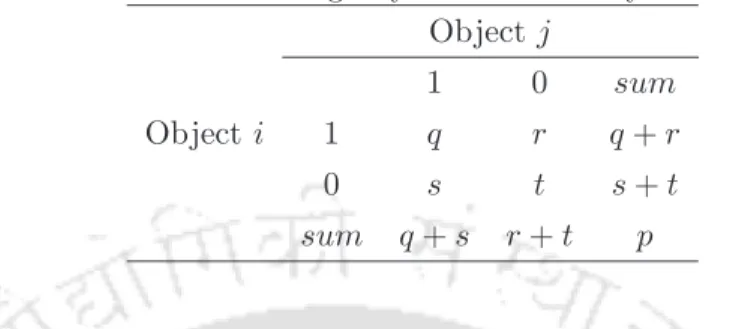
The inequality based on such variables is called asymmetric binary inequality, where the number of negative matches, t, is considered unimportant and therefore ignored in the calculation, as shown in equation (2.2). Where st is the number of matches (ie, the number of variables for which i and j have the same state), and pis the total number of variables.
Types of Clustering Methods
Thek mean has time complexity O(i∗k∗N), where is the number of iterations, N is the size of the data set. It only applies to numerical datasets (vector spaces) and with different starting points it produces different clustering results.
Data Pruning
In data reduction, the group representations of the data are used to replace the actual data. They can also be used for hierarchical data reduction, providing a multi-resolution grouping of the data. Sampling can be used as a data reduction technique because it allows a large data set to be represented by a much smaller random sample (or subset) of the data.
Definitions
So far we have introduced, discussed some of the important ways to measure dissimilarity for different types of data, types of clustering techniques and to select data.
Outlier Detection Techniques
If there are >M objects in Cx,y, none of the objects in Cx,y is an outlier. MDEF is measured based on the standard deviation of the local densities of the nearest neighbors. For a given data object, ODIN is equal to the number of κ nearest neighbors of the data object that the given data object has in their κ nearest neighbor list.
![Figure 2.1: A Cell Based Approach [1]](https://thumb-ap.123doks.com/thumbv2/azpdfnet/10515148.0/54.892.176.720.221.547/figure-2-1-a-cell-based-approach-1.webp)
Outlier Score
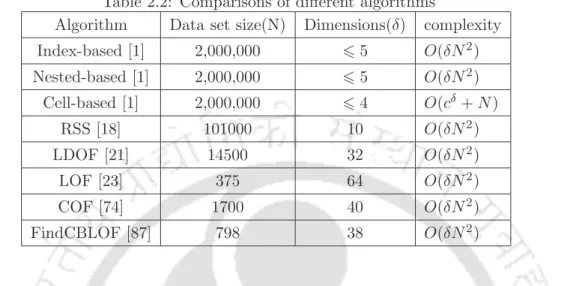
Each outlier detection algorithm uses a small subset of features randomly selected from the original feature set. In Table 2.2, the computational complexity of various outlier detection techniques is presented from the literature. From Table 2.2, it is clear that the computational complexity of outlier detection methods is directly related to the number of data points N and the number of attributes δ in the dataset.
Introduction
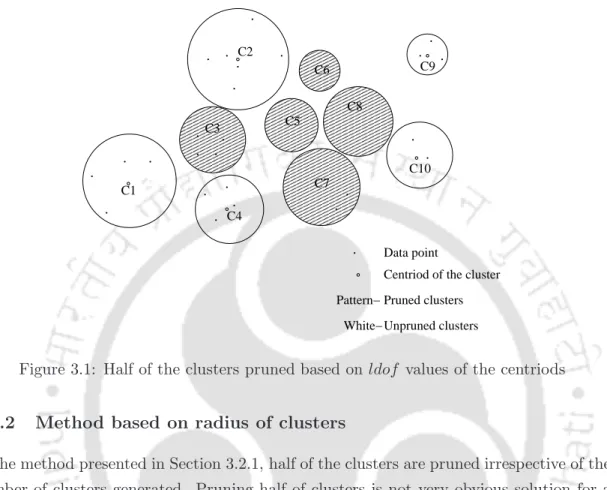
Depending on the LDOF values of centriods, we prune some of the clusters whose centriod LDOF value is low. Third method: We calculate the distance of the centroids of all clusters from the total centroid of the given data set. Depending on the distance to the center of gravity, we can prune a few bunches.
Proposed Methods
The highldof value of the centriode of a cluster means that the cluster is distant from its neighbors. Clusters whose centriodes are close to the centriodes of the data points are cut off. Pruning some clusters: The ldof value for all cluster centroids is calculated.
Computational Analysis
Calculate overall centriod: Using only the centroid points of all the clusters, we calculate overall centriod. It is the average sum of distances between the overall centriode and the centriode of the clusters. For rest of the clusters if the distance between centriod of cluster to overall centriod is less than the average distance from overall centriod, we prune the cluster.
Experimental Results
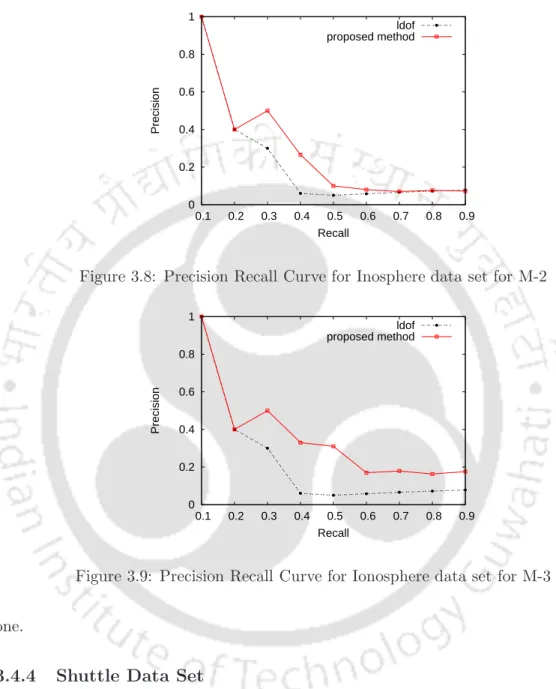
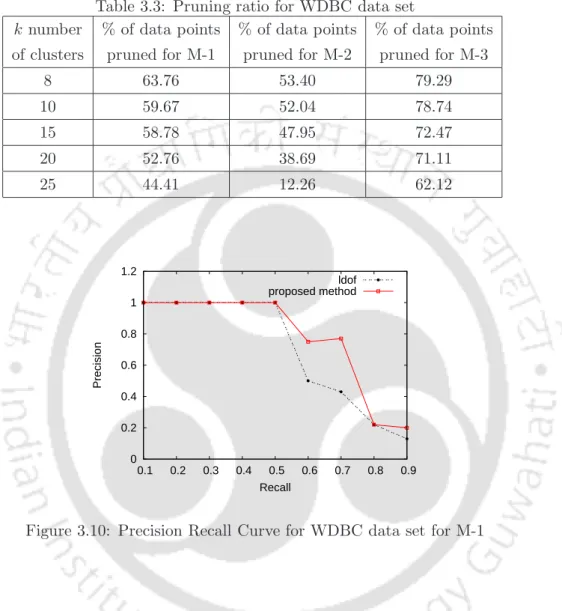
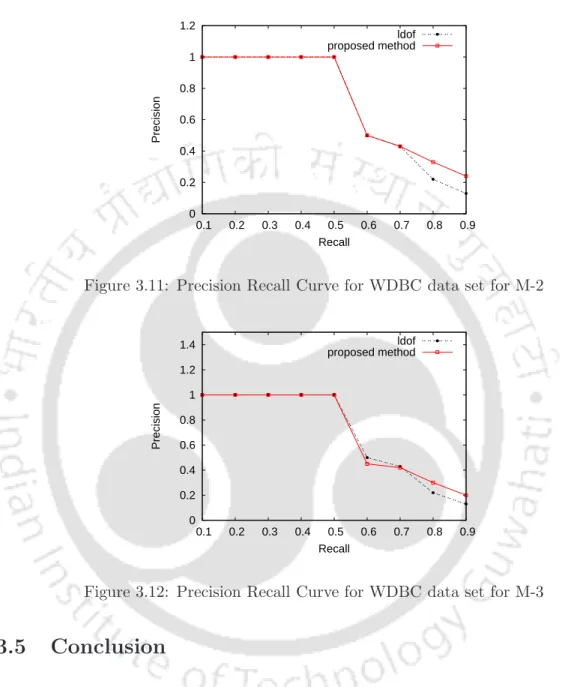
The dataset contains 569 medical diagnosis records (objects), each with 32 attributes (ID, diagnosis, 30 real-valued input attributes). The percentage pruning for this dataset for all three methods is shown in Table 3.2. The WDBC dataset has two classes (benign, malignant), which are also a well-separated dataset.
Conclusion
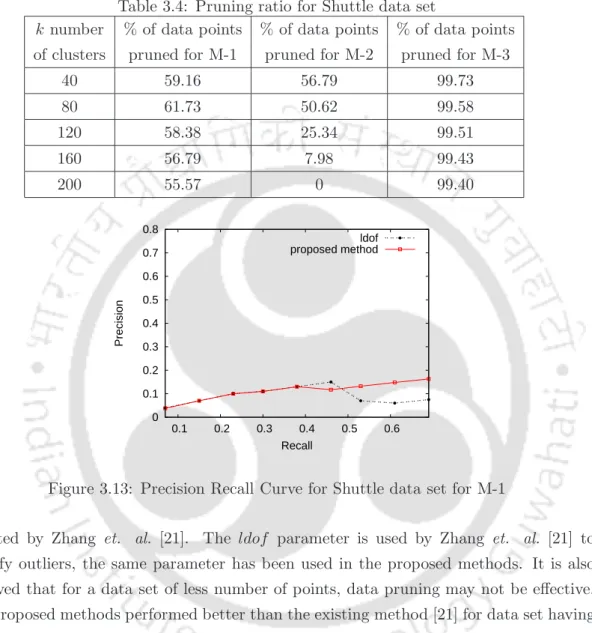
It is also noted that data pruning may not be effective for a dataset with fewer points. Our proposed methods outperformed the existing method [21] for multi-attribute multi-data point datasets. Instead of pruning the entire cluster, we prune some points from each cluster based on the properties of the data points present in the respective clusters.
Introduction
Point Pruning Based Outlier Detection
Generate clusters: Initially, we cluster the entire dataset into kclusters using k-means clustering algorithm and calculate radius of each cluster. Clusters with fewer points: If the clusters contain fewer points than the number of outliers. Calculate outliers: Calculate ldof values for all the points left unpruned in all the clusters.
Computational Analysis
If the distance of a point (pi) is less than the radius of a cluster (Rc), the point is pruned.
Experimental Results
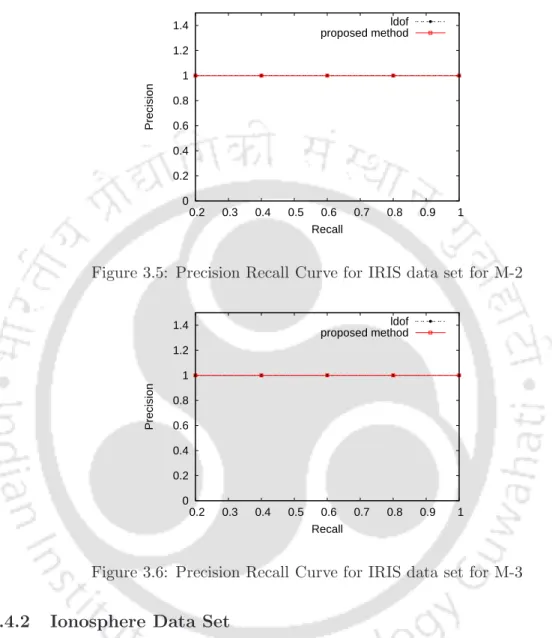
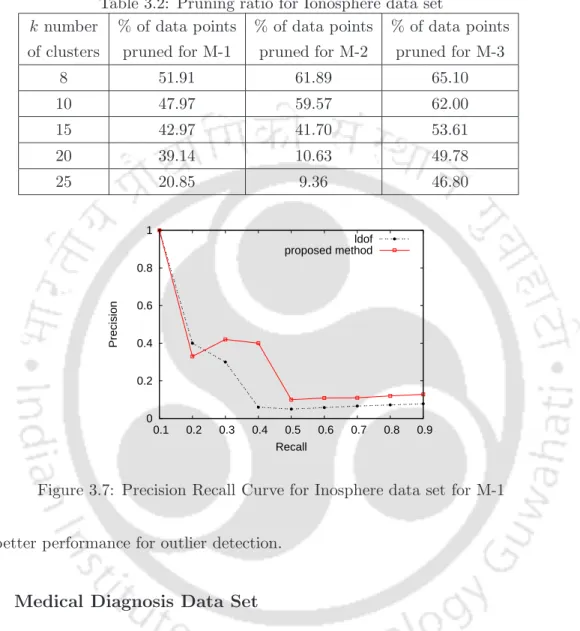
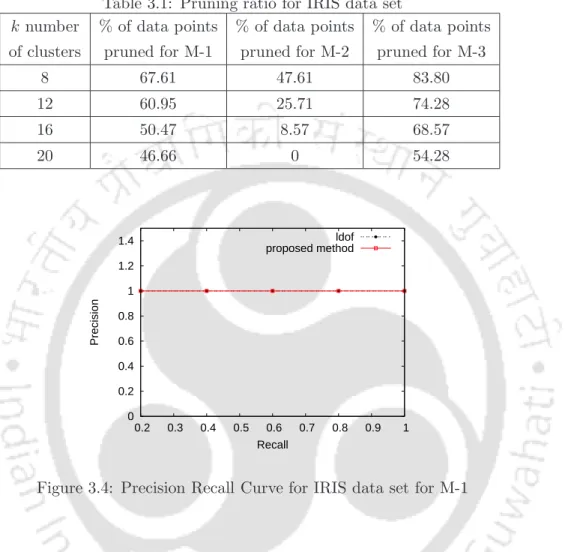
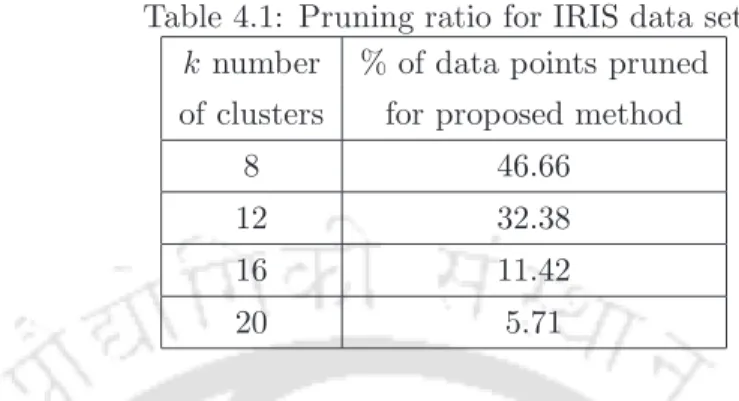
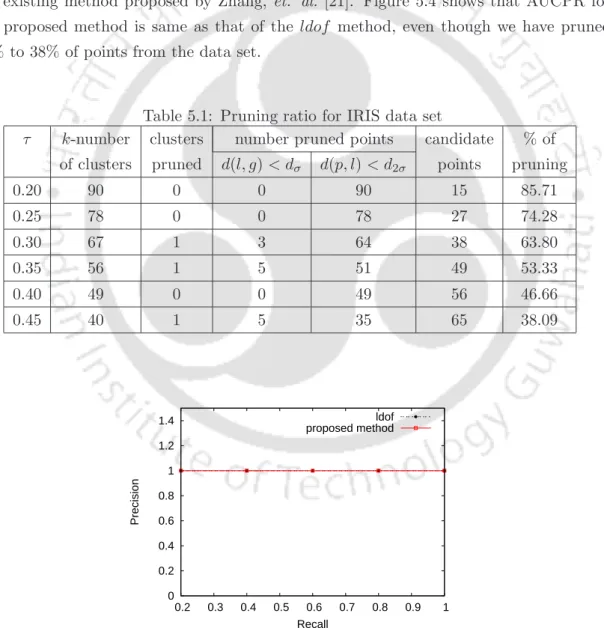
The outlier detection performance of the proposed method is the same as the existing method. The pruning percentage is less for Iris dataset with the increase in the number of clusters. The number of attributes for a point and the number of data points in the Ionosphere dataset in more than the Iris dataset.
Conclusion
Introduction
The main purpose of summarizing data is to provide a more concise picture given a set of input data. The techniques for summarizing data can give an idea of how the techniques can be applied in many domains. A summary of the input data can be analyzed more easily and quickly while still obtaining comparable knowledge.
Data summarization Based Pruning
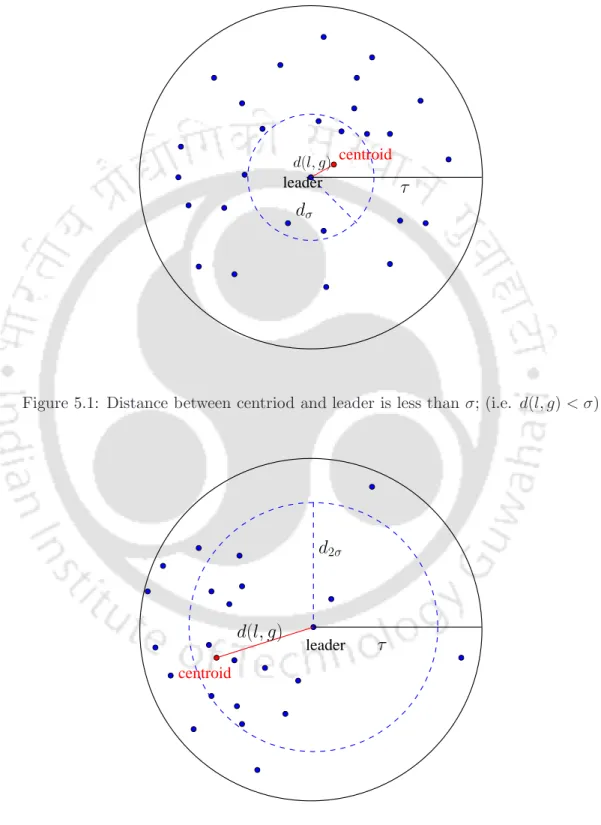
For example if (q = 2), the probability distribution of the points whose distance is greater than qσ from µ is less than. To prune clusters, distance between leader and center point d(l, g) is compared with the standard deviation of the distances of the points present in the cluster. If the distance between leader and centriode of the cluster (l, g) is greater than one standard deviation of the cluster, add all the points whose distance from the leader is greater than two standard deviations.
Computational Analysis
Cardinality: If the cardinality of a cluster is less than the number of outliers, we use all points of the cluster as candidate points. If the distance between the leader and the centroid of the cluster d(l, g) is less than one standard deviation of the cluster, add only the leader of the cluster to the candidate points.
Experimental Results
By varying the τ value from 1.0 to 3.0, we measured the percent trimming of the data points presented in Table 5.2. By changing the τ value from 25 to 45, we measured the percentage trimming of the data points presented in Table 5.3. By varying the τ value from 10 to 50, we measured the percentage trimming of the data points presented in Table 5.4.
Conclusion
Introduction
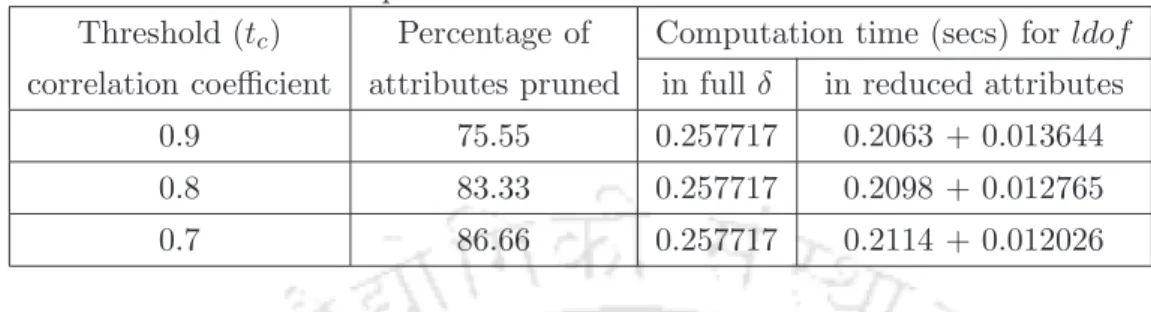
To calculate the distance between two points, we need to perform addition, subtraction, square and square root. Choosing a few attributes and calculating the distance between two points on those attributes reduces the number of additions, subtractions, and quadrature operations. Therefore, distance calculation in δ-dimensional has high calculation than calculation of the same distance calculation in smaller dimension.
Correlation Based Method
From the correlated set of features, one feature is selected as a representative feature and is used to determine the outliers of the. In outlier count step, outlier count is calculated for all the data points with only the representative features selected from the correlation coefficient. Group the set of attributes based on the correlation value: Based on the required correlation value (threshold value) group the set of attributes.
Computational Analysis
Calculating the correlation coefficient: First, select a small number of objects/instances (defined by the user), to calculate the pairwise correlation between the entire pair of attributes. Calculation of outliers: Calculate ldof values for all points using only selected representative attributes.
Experimental Results
Computational time for calculating correlation coefficient for all pairs of attributes is relatively less because we use a randomly selected small sample of data points from the dataset. The dataset contains 360 (24 in each of fifteen classes) instances, each with 91 attributes (90 numeric (double) and 1 for the class (integer)). So, feature pruning method is useful for large data set with a large number of features.
Conclusion
The work presented in this thesis proposes algorithms to detect outliers in a dataset. The main direction of this work is to reduce computation while detecting outliers from a dataset. Also for a dataset consisting of a large number of attributes, the computation can be reduced by selecting some attributes that are closely related to other attributes.
Contributions
Computational reduction can be achieved for detecting outliers from a large data set if the data set is reduced by trimming some of the data points that are less likely to be outliers. The results of the experiment showed that we got a significant reduction in the data set and eventually reduced the calculation for calculating the ldof value. When we have pruned all clusters, then a representative data point is included in the data set.
Discussions
It is proposed to prune both clusters and points depending on cluster behaviors. For a dense set of data it is observed that the formation of most clusters are also dense in nature. Based on the properties of the data points of a cluster, we pruned some of the points.
Future Directions
I Proceedings of the 12th ACM SIGKDD international conference on Knowledge discovery and data mining, KDD '06, side 394-403, New York, NY, USA, 2006. InProceedings of the 13th Pacific- Asia Conference on Advances in Knowledge Discovery and Data Mining , PAKDD. I Proceedings of the 12th ACM SIGKDD international conference on Knowledge discovery and data mining, side 767-772.