The present thesis work is focused on the development of fiber Bragg grating (FBG) based new optical sensors to monitor tilt, vibration, strain and RH, which are some of the most important parameters in structural health monitoring. The response of the developed sensor is observed to be fully reversible with a significant stable characteristic during repeatability and reliability tests. Stable and efficient temperature sensitive fiber Bragg 53 grating based tilt sensor using non-pendulum type.
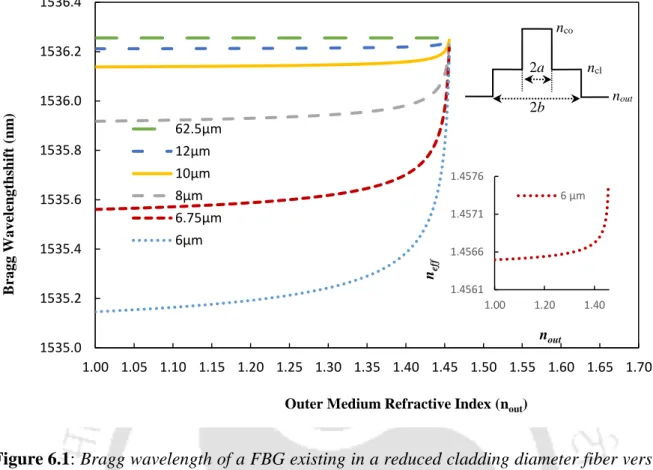
The bottom inset shows the effective refractive index of the diluted FBG versus the outer medium refractive index for a cladding radius of 12m.
Introduction
Simple Temperature Insensitive Fiber Bragg Grating
- Introduction
- Experimental
- Sensor Design and Construction
- Sensing principle
- Sensor characterization
- Results and Discussions
- Conclusion
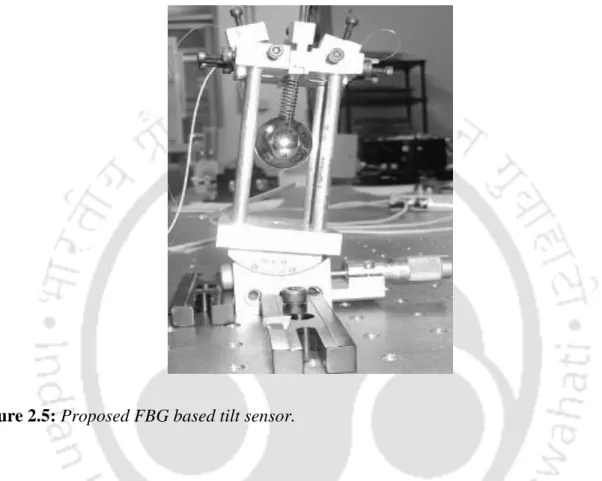
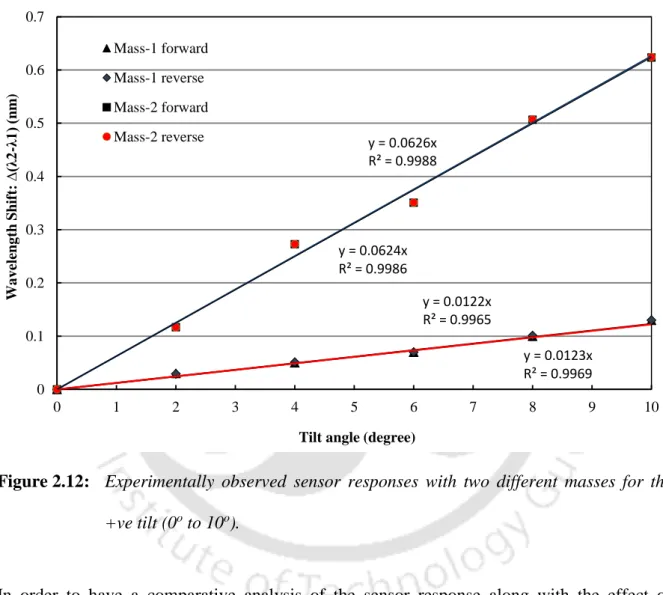
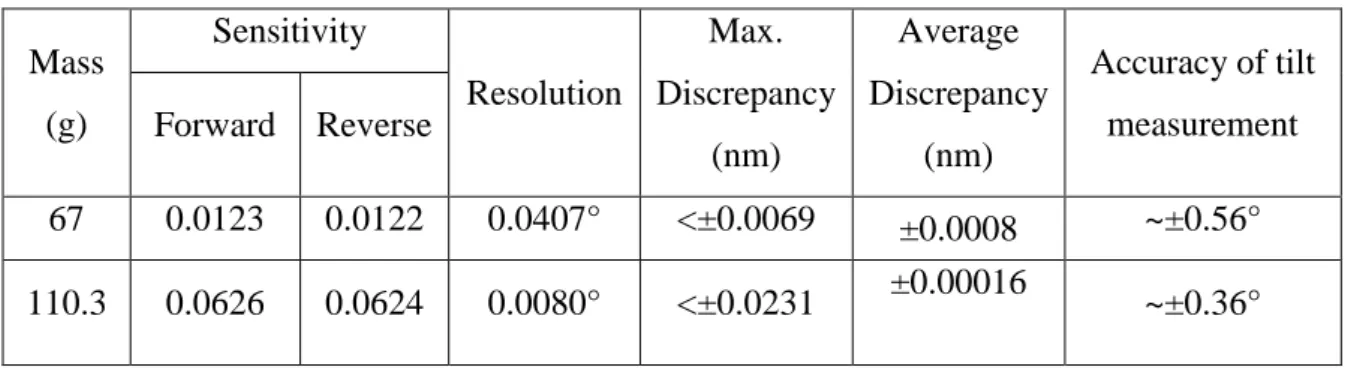
In order to accurately investigate the response characteristics of the proposed FBG-based tilt sensor using a bob with a mass of 67 g (mass-1), the sensor was mounted on an available tilt stage (goniometer). The 0.5 pm wavelength resolution of the interrogator resulted in an angular resolution of 0.0407o for the sensor. In order to find the actual response characteristics of the sensor, the experimentally observed wavelength differences, (2-1) and.
Next, we compared the performance characteristics of the proposed sensor with the other FBG-based tilt sensors reported in the literature.
Stable and Effective Temperature Insensitive Fiber Bragg
- Introduction
- Experimental
- Sensor Design and Construction
- Sensing Principle
- Sensor characterization
- Results and Discussion
- Conclusion
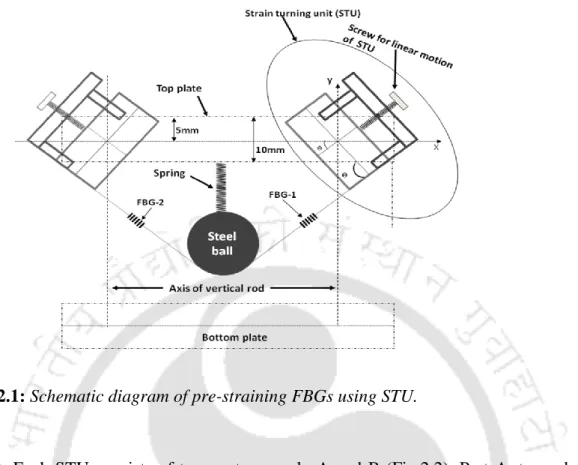
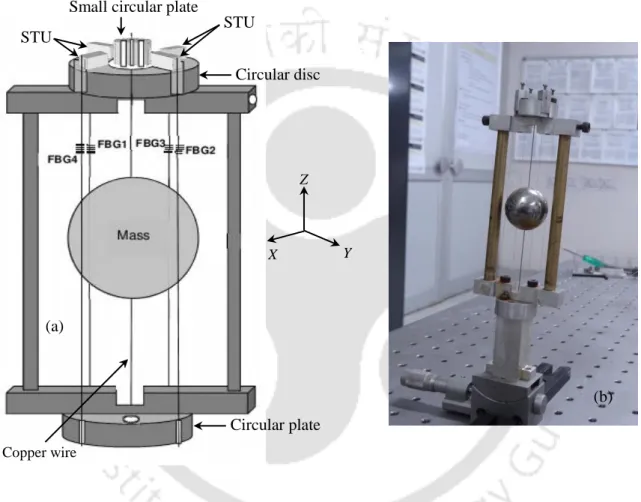
A small round plate (1 cm diameter) is inserted into the central part of the round disk. 3.1(a)) and parallel to the diagonals used in the circular plate at the bottom of the design. In this arrangement, all four FBGs are located in the middle of the length between the points of contact on the bob and the STUs.
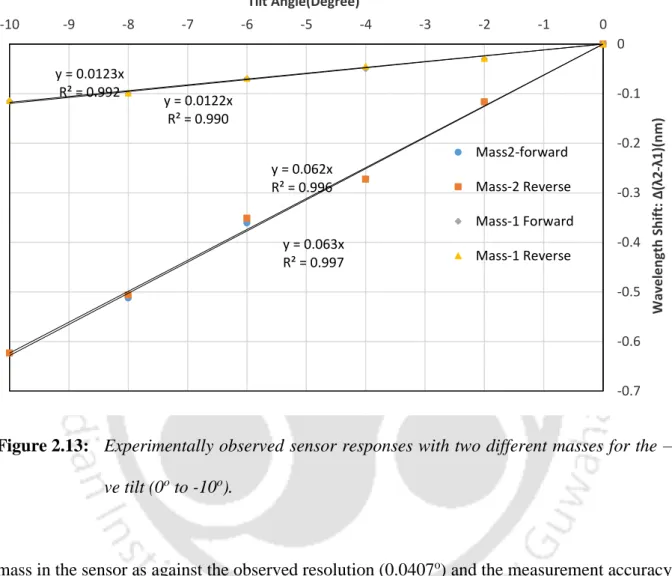
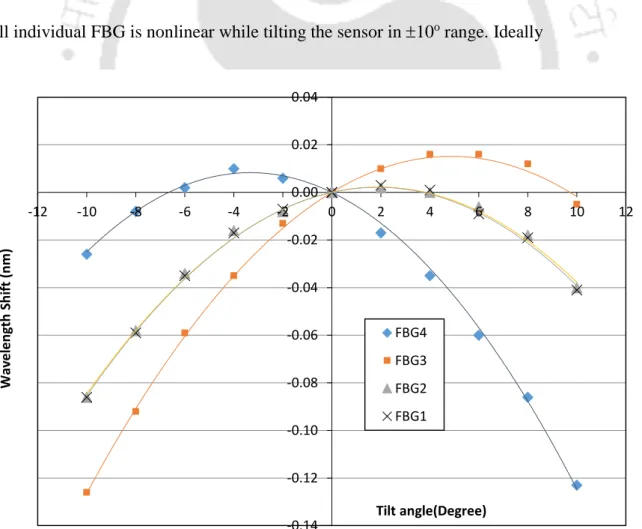
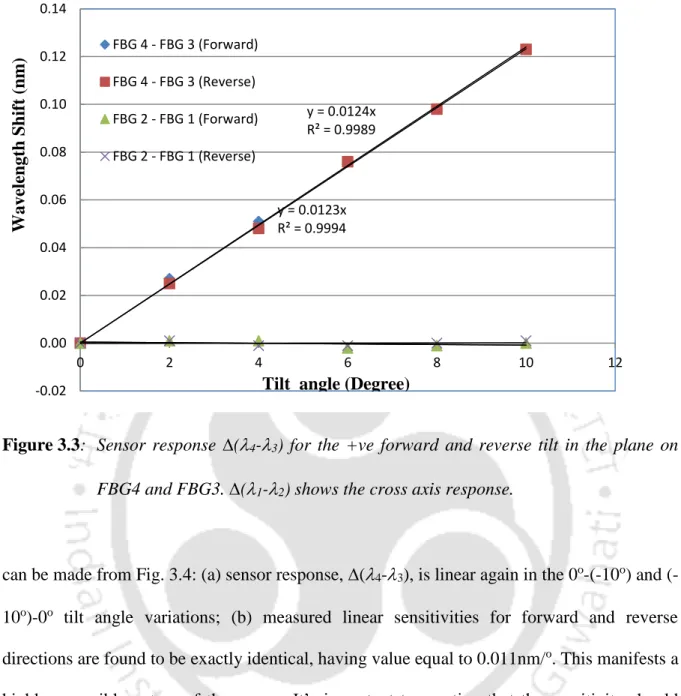
3.1) and (3.3), the following characteristics of the proposed sensor should be noted: (a) for small variations of the tilt angle, the wavelength spacings and are linearly proportional to ; (b) the sensitivity of the sensor, which is the fractional change in wavelength difference for an applied slope, is linearly proportional to m/2;. In order to investigate the response characteristics of the sensor, the experimentally observed Δ(λ4 - λ3) for 0o-10o (forward) and 10o-0o (reverse) inclination is shown in the figure. As already stated in the previous section, the tilt sensitivity of the measurement is defined by the fractional change in wavelength difference for the applied tilt.
This means that the effective mass is half of the mass used in the proposed design. Nevertheless, maximum discrepancy, measurement accuracy, and sensitivity do not depend on the interrogator's resolution; These characteristics indicate successful achievement of the objectives set for the sensor development carried out in this chapter.
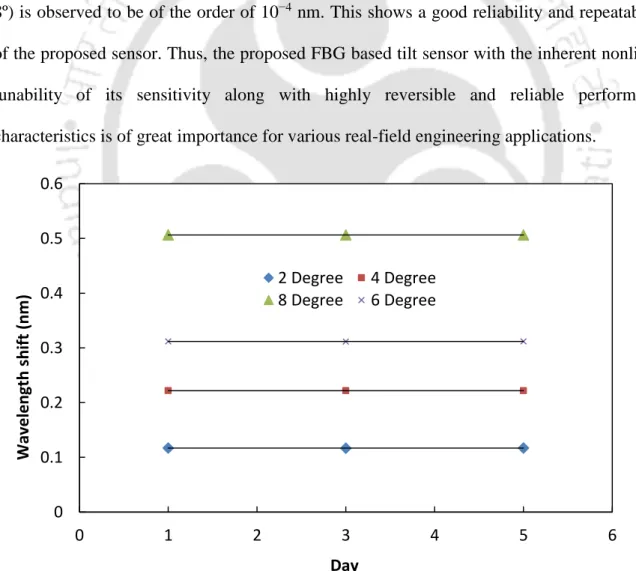
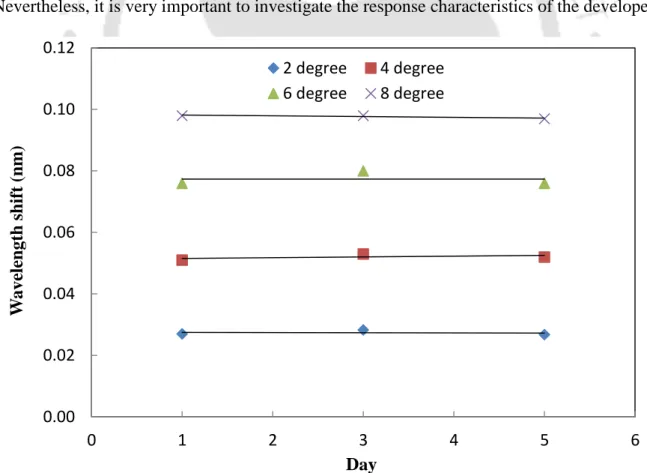
Compared to day 1, it is observed that the maximum difference in sensor output at four different tilt values (2º, 4º, 6º and 8º) is of the order of 10–3 nm. Theoretically, the sensitivity of the proposed sensor is proportional to half the mass used in the design of the sensor.
Temperature Insensitive Fiber Bragg Grating Based Two
- Introduction
- Experimental
- Sensor Design and Construction
- Sensor characterization
- RESULTS AND DISCUSSION
- CONCLUSION
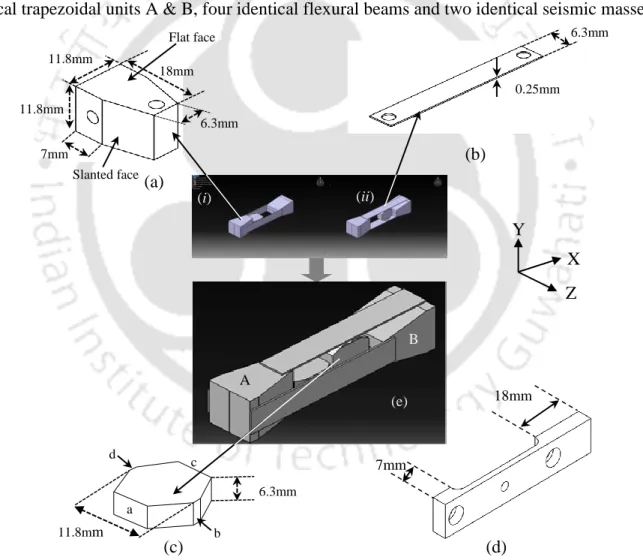
The frequency response of the sensor is also analyzed to determine the natural frequency of the sensor. In this design, the width of the seismic mass corresponds to the width of the bending beams. Then, four FBGs were to be fixed on the outer surfaces of the four flexible beams.
Generated strain profile on the outer surfaces of the flexible beams is transferred to the FBGs to be fixed on these surfaces in the proposed design. Bending force was applied by hand to the free end of the beams in this pair. 4.5(a) and 4.4(b) depict the reflection spectra of one of the FBG (λ1) before and after the application of the force.
In the first part of the performance characterization, the proposed sensor was exposed to sinusoidal vibrations in the vertical plane (X-Y plane). It is important to note here that due to the limitation of the shaker (type 4808 vibration exciter), experiments with acceleration greater than 50 m/s2 could not be performed for the higher frequency range (above 100 Hz). 4.6 (blue continuous line) corresponding to the vertical axis which is on the right side of the plot.
The frequency at which the peak-to-peak Bragg wavelength shift reaches its maximum value is the natural (resonance) frequency of the sensor. Based on these results, the following observations can be made: (a) the sensor exhibits a linear response with the maximum peak-to-peak wavelength shift increasing linearly with increasing amplitudes (accelerations) at all frequencies of the applied signal; (b) the sensitivity of the sensor remains.
Corrugated Fiber Bragg Grating Structure: Strain
- Introduction
- Experimental
- Sensor Design and Construction
- Sensor characterization
- RESULTS AND DISCUSSION
- CONCLUSION
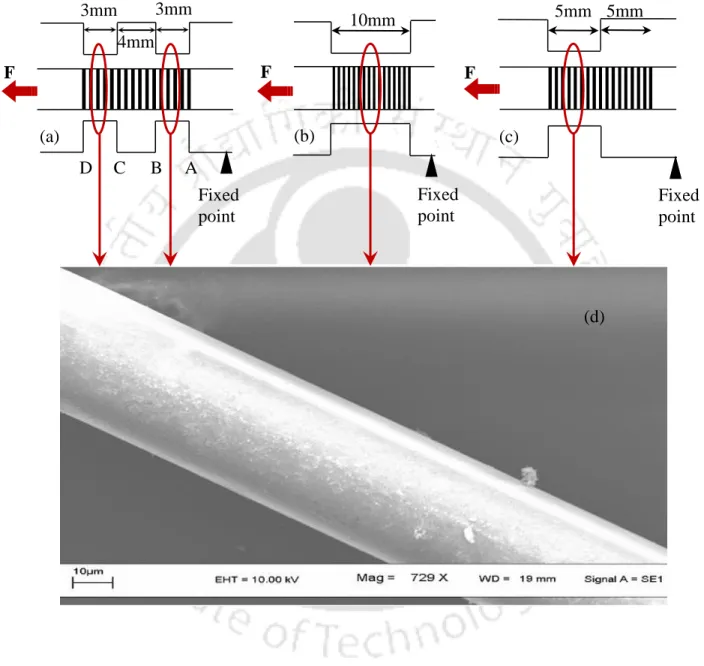
An increase in strain sensitivity by a factor of two compared to the strain sensitivity of normal FBG was achieved. The sensitivity of the unwritten part of the FBG in this geometry (0.66 pm/με) is smaller than the strain sensitivity of the normal (unwritten) FBG of the previous experiment. As can be observed from Table 5.1, the strain sensitivity of the semi-etched FBG section of this second FBG structure.
Equation (5.4) predicts that the strain sensitivity of etched-half section should increase by ~8.9 times compared to the strain sensitivity of unetched-half section of this FBG structure. In addition, it is observed that the strain sensitivity of unetched portion of this FBG structure is 0.84 pm/µε; (e) measured linear sensitivities during forward and backward strain variations for the three sensing structures of the single FBG were found to be almost identical. As can be observed from this table, the sensitivity of unetched portion of this FBG structure is quite close to the voltage sensitivity observed for the normal (unetched) FBG in the first experiment.
5.1 (b) (7.57 pm/µε); is almost the same as the maximum strain sensitivity observed for the half-etched–half-unetched FBG structure in Figure 5.1 (c) (5.79 pm/µε); and is more than 6 times higher than the strain sensitivity of the unetched section of the same FBG structure. 5.1 (c); and very high (>10.5 times) compared to the strain sensitivity of 0.84 pm/µε observed for a 4 mm unetched FBG section of the same geometry.
Furthermore, for the etched section of this FBG structure that provides maximum strain sensitivity enhancement, maximum discrepancy is observed to be less than. The strain sensitivity of one of the etched sections is observed to be over 10.5 times compared to the strain sensitivity of unetched section of this structure.
Fiber Bragg Grating Based Humidity Sensor Employing
- Introduction
- Theoretical Analysis
- Experimental
- Sensor Design and Construction
- Sensor characterization
- Results and Discussion
- Conclusion
However, if the cladding diameter in the FBG region is reduced, the effective refractive index of the fiber is significantly affected by the ambient refractive indices, while the grating pitch remains unaffected. Importantly, the experimental response characteristic of the sensor is observed to be consistent with the theoretical analysis. To realize the FBG-based RH sensor, the fiber cladding in the FBG region for the first FBG (1) was etched at several micron levels.
A uniform fiber diameter with a reduced value of ~18µm was observed for the etched portion of the fiber. A uniform fiber diameter with a reduced value of ~13.5 µm is observed for the etched part of the fiber. To achieve this, the fiber length in the grating area was cut to the lowest practical limit possible under laboratory constraints.
The theoretical response of the sensor to applied RH variations, calculated through Eq. 6.9), is also represented by the continuous line in the same figure. The interrogator's wavelength resolution of 0.05 pm results in a RH resolution of 0.61%RH for the sensor. Importantly, the experimentally observed response of the proposed sensor is observed to be consistent with the theoretically predicted one.
Once again, the theoretical response of the sensor to applied RH variations is also plotted (solid line) in the same figure. This is due to the fact that the RH variations in the present work correspond to the surrounding RI variations which are limited to about 1.
Conclusion of Thesis
In the next step, a simple design strategy of FBG-based two axial all-optical vibration sensors is proposed and experimentally demonstrated, using a methodology to ensure a chirp-free mechanism. In this design, the vibration of the sensor moves the seismic mass attached between two bending beams, inducing a variable stress in the two beams. Furthermore, if the inherent voltage sensitivity of FBG can be improved to a very large value, it will improve the response of all FBG-based sensors.
Finally, in the last part of the research, an FBG-based humidity sensor is developed using a new effective index modulation mechanism with the ambition of achieving the widest possible dynamic range and optimal sensitivity. To achieve these goals, the fiber diameter in the grating region is reduced to the lowest possible working limit (~ a few microns) using a properly controlled chemical etch. The thesis leads to the possibility of a wide range of potential research works that will be carried out in the future.
For example, all the sensors described here in the thesis are characterized in a laboratory environment; however, these sensors are intended for real-world applications such as SHM. For example, an FBG-based RH sensor in this form cannot be used to detect the moisture content of concrete structures. Furthermore, as mentioned for the wavy FBG sensor developed in the thesis, a single FBG sensor is divided into three independent FBG sensors with improved strain sensitivity.
Similarly, in the case of the FBG-based humidity sensor, due to laboratory constraints, we could not etch the fiber diameter over the FBG region below 13.5µm, however, we observed that the sensitivity will increase if the diameter decreases further . RH variations can be easily mapped around this surrounding RI by coating the etched fiber in the FBG region with a thin layer of suitable chemical composition.
Tatam, “Simultaneous and independent temperature and strain measurement using in-fiber Bragg grating sensors,” IEEE Elec. Kumar, “Single fiber Bragg grating sensor with two sections of different diameters for longitudinal stress and temperature discrimination with improved strain sensitivity”, Rev. Ji, “Design and application of a fiber Bragg grating strain sensor with improved sensitivity in the small dam model”, Smart Mater.
Jeong, “Simultaneous measurement of refractive index, temperature, and strain using etched-core fiber Bragg grating sensors,” IEEE Photon. Zhou, “Low-cost relative humidity sensor based on thermoplastic polyimide-coated fiber Bragg grating,” Sens. Peng, "A fast response intrinsic humidity sensor based on etched single-mode polymer fiber Bragg grating,".
Zhao, “Relative humidity sensor based on tilted fiber Bragg grating with polyvinyl alcohol coating,” IEEE Photon. Farrell, “Relative humidity sensor based on an agarose-infiltrated photonic crystal fiber interferometer,” IEEE Quant. Khijwania, "Simple Temperature-sensitive Fiber Bragg Gratts Tilt Sensor Based Tilt Sensor with a Tunable Response and a Large Dynamic Range", Photonics, (2010).
Zhou, “Design and characteristics of refractive index sensor based on diluted and microstructure fiber Bragg grating,” Appl.