To address the design problems mentioned above, we demonstrate the application of metaheuristics based on river formation dynamics (RFD and MRFD1) to optimize the power distribution network resulting from very large-scale designs. A number of experiments have been conducted at various power distribution standards to demonstrate the effectiveness of RFD and MRFD in minimizing IR drop and wire surface area.
Evolution in integrated circuit technology and design trends
This favors the development of more IC functionality on the silicon surface with a consequent reduction in the number of ICs that make up the system. As the number of ICs decreased, the speed of the system became increasingly dependent on the speed of the ICs.
![Figure 1.1: Evolution of integrated circuit design trend [2]](https://thumb-ap.123doks.com/thumbv2/azpdfnet/10544874.0/31.892.156.738.614.886/figure-1-1-evolution-integrated-circuit-design-trend.webp)
Problem of power distribution and analysis
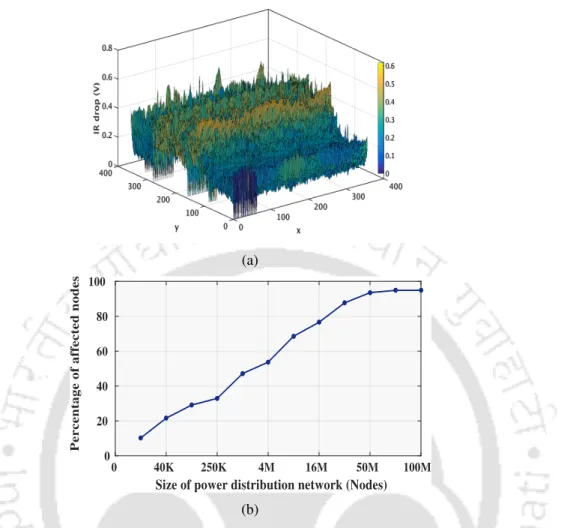
One mechanism is the occurrence of worst-case voltage fluctuations (hotspots or IR drop locations) across a chip's power distribution network. Thus, the primary goal is to design a power distribution system that can supply sufficient current to each transistor on an integrated circuit while ensuring that the power noise does not exceed a certain range near the nominal voltage levels (target noise margins) [2]. .
Problem of power distribution network design
Consequently, as the size of the power distribution network increases, the network is more susceptible to various adverse effects. Since the power distribution network consumes a large portion of routing resources (nearly 30% or more (less than 28 nm)), with an increase in the size of the power distribution network and variations in the supply voltage, the voltage across these power rails decreases (due to metal resistance). cannot be pushed aside [4].
Problem of analog circuit sizing
Circuit sizing as a single objective optimization problem
Circuit sizing as a multiobjective optimization problem
Problem of signal integrity in memristor crossbar array
The natural response to balance these factors to limit the amount of IR drop is more conservative during MCA design.
Need of efficient EDA tools
Metaheuristics
Metaheuristics show stochastic behavior to some extent and this allows to counteract the combinatorial explosion of the possibilities during analysis. Metaheuristics have an inert advantage that they do not make use of problematic calculations of the gradients of objective functions and they lend themselves to all kinds of extensions.
Motivations and contributions of the thesis
Therefore, it is necessary to minimize the IR drop by redesigning the power distribution network. Since IR drop also depends on the conductor width of power rails, minimizing the IR drop also affects the area of the power distribution network.
Organization of the thesis
Furthermore, a preliminary overview of optimization techniques to minimize the IR drop in memristive crossbar arrays is also presented. The performance improvement in the proposed single-objective framework is demonstrated by minimizing the IR drop and area for large-scale power distribution networks.
Power distribution network design
Many approaches have been proposed to minimize the wire area by constructing a mesh or tree topology of the power distribution network [33]. However, these research works do not emphasize the optimization of the entire power distribution network.
Optimization of analog/RF circuits
Since the power distribution network consumes a significant portion of the routing resources, it is also crucial to minimize the power distribution network area using appropriate optimization techniques [ 31 , 32 ]. Further, these approaches [32, 33] suffer from poor convergence [34] or increased space/time complexity with increase in the size of power distribution networks.
IR drop minimization of memristor crossbar arrays
With further increase in the size of MCA, the impact of IR drop also becomes critical, leading to logical or functional failures of the entire system. Since IR drop affects the training and observation operations of MCAs, one of the strategies to reduce the weight matrix is to reduce the computation in the cross beam [ 13 ].
Peer metaheuristics
Genetic algorithm (GA)
The goal of natural evolution in genetic algorithms is to find the individual in the search space with the best genetic basis (i.e. the chromosomes with the best chance of survival). Then the quality of the individuals in the population is determined and few individuals are chosen as the parent population.
Differential evolution (DE)
As a kind of heuristic measure, this fitness function defines a measure of the gain or quality of the solution to the underlying problem. Create a donor population that matches the target population via a DE/current-to-best/1 DE mutation scheme.
Particle swarm optimization (PSO)
Due to the randomness involved in the variation of parameters in PSO, particles often tend to get trapped in local optima. Regarding the problem of premature convergence, several modifications are proposed and a number of variants of PSO algorithm are reported in the literature [69] based on different aspects for single objective optimization, such as quantized PSO [70], chaotic PSO [71], fuzzy PSO [72], craziness-based PSO (CRPSO hybrid PSO [75], PSO with L´evy flight [76, 77], PSO with aging leader and challengers [78] etc.
Background on Proposed Metaheuristics
- Random walk (RW)
- River formation dynamics (RFD)
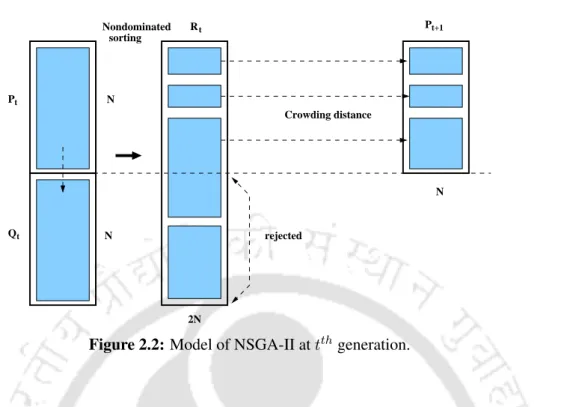
- Nondominated sorting genetic algorithm II (NSGA-II)
- Multiobjective brain storm optimization (MBSO)
Therefore, in this thesis, a parallel random walk algorithm is proposed, which is used to analyze large power distribution networks on GPU. The remaining solutions in the next generation set are selected using a crowding distance scheme [7], that is, the solutions with the largest crowding distance values are chosen for the next generation to achieve a desired diversity to keep.
An insight into metaheuristics performance measures
The metaheuristic that happens to solve the problem successfully in every run or most runs is assumed to have a better ranking or performance than others for that specific problem. The solutions are compared based on the performance of proposed metaheuristics over a number of successful runs, and various metrics (both quantitative and statistical) are used to rank these metaheuristics among other state-of-the-art metaheuristics.
Summary
Effective analysis of the power distribution network (power grid) is essential for the correct functionality of a chip for different load conditions and variability of elements. Therefore, it is necessary to analyze the power distribution networks for both voltage behavior and network security.
Power Distribution Network Analysis
Network Formulation for Steady State Analysis
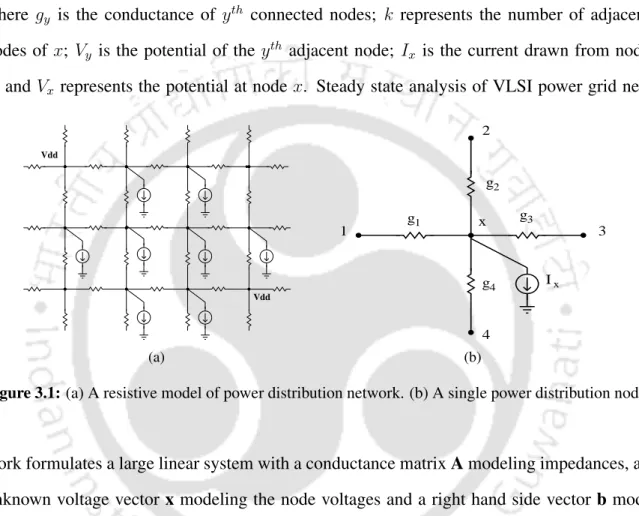
Due to the large sizes of power grid networks, it has become critical to analyze the entire power distribution network on a single computer due to the lack of memory resources. Since the power distribution network model consists of resistors, voltage sources (with one end connected to the ground node) and current sources, we use the nodal or modified nodal analysis method to analyze the distribution network of energy.
Network Formulation for Transient Analysis
Therefore, the system of equations for RC modeled power distribution network can be written as follows,. Using backward Euler's method with a time step h, the linearized form of system equations can be written as, .
Random Walk
Application of Traditional Random Walk Algorithm
Similarly, node potentials can be evaluated using the same equations that treat nodes as the crossings and edges as the paths in the power distribution network.
Two-Step Random Walk (TSRW) Method
- Scalability Analysis
- Implementation Details
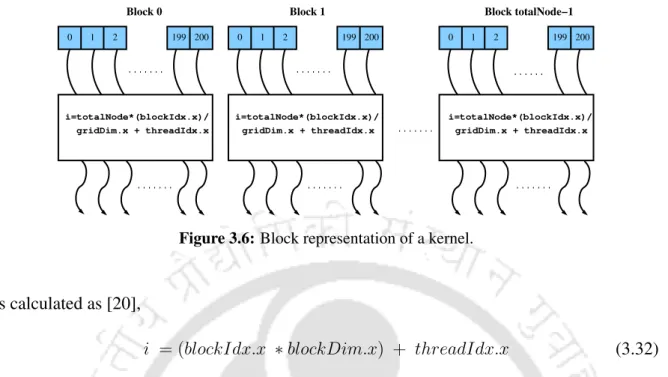
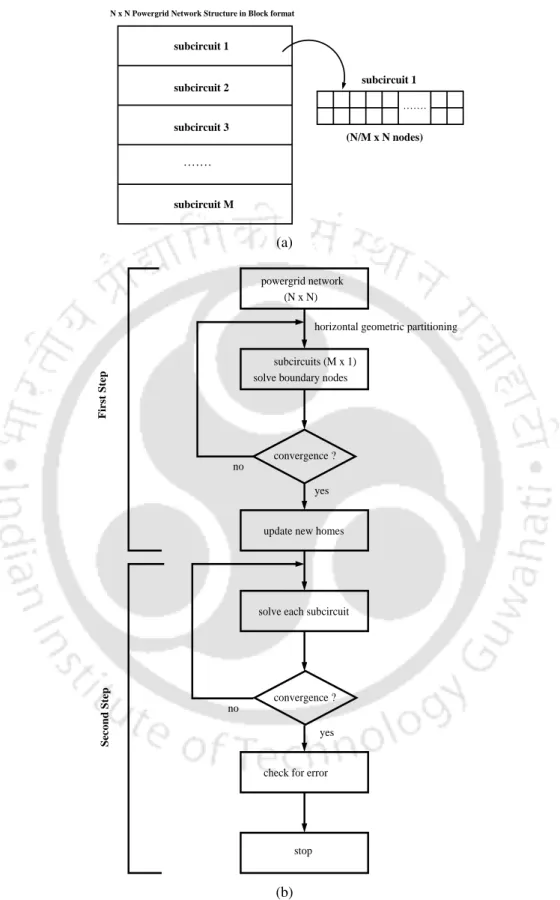
We have evaluated the TSRW method for different numbers of threads to examine the scalability of this method. In the TSRW approach, an entire power distribution network of size N ×N is decomposed into M ×11 rectangular subcircuits, each having MN ×N nodes.
River Formation Dynamics (RFD)
Application of RFD in the analysis of VLSI power grid networks
- Graphical Approach
- Electrical Circuit Theory Approach
Since it has already been shown in the literature that a power distribution network can be expressed in terms of a linear system of equations, the potential of the nodes can be obtained by finding the best paths traversed by each droplet from source to destination. If Θ can be considered as a graph for current distribution network with unit conductance value along the edges, then f(ni) denotes the potential at node ni with current (drop) flowing from nodej to nodenk.
Implementation Details
Once a droplet reaches any VDD node across the power distribution network, the height or potential of starting node is calculated by summing the amount of erosion at visited nodes with the potential of destination. The process of estimating the potential across different nodes of a power grid network is carried out until convergence, i.e. stopping criteria, is reached.
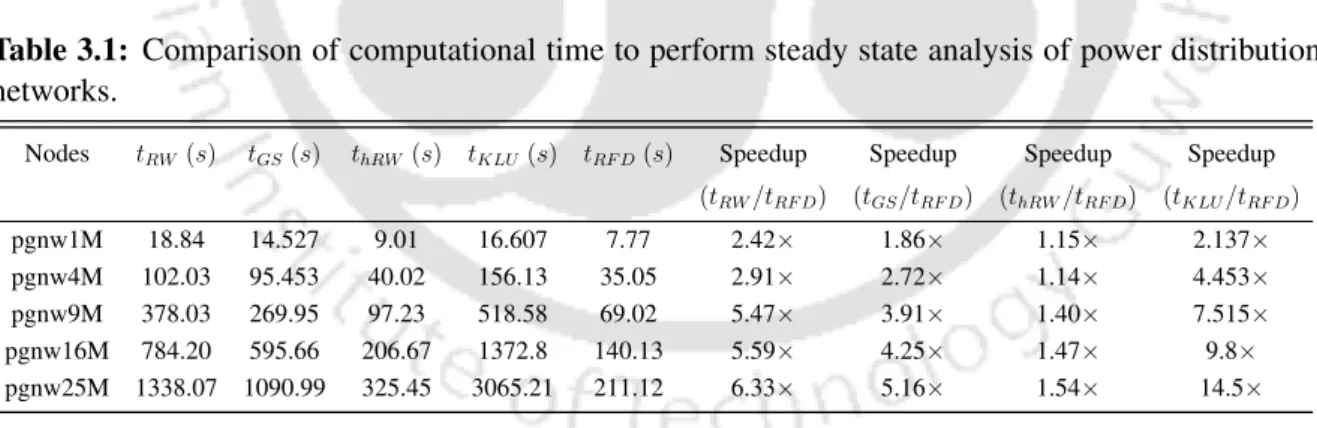
Simulation Results
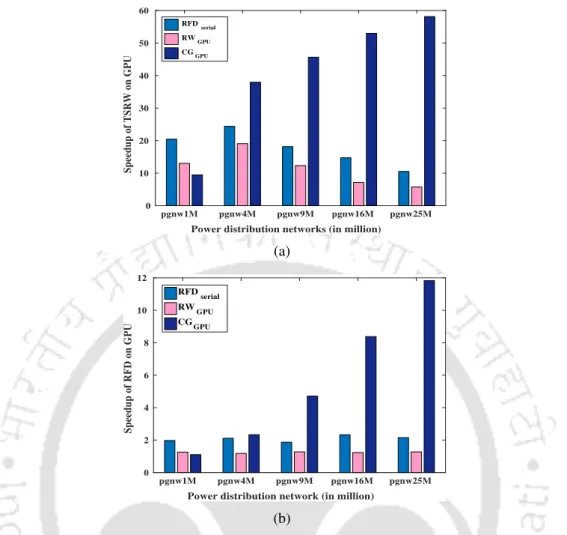
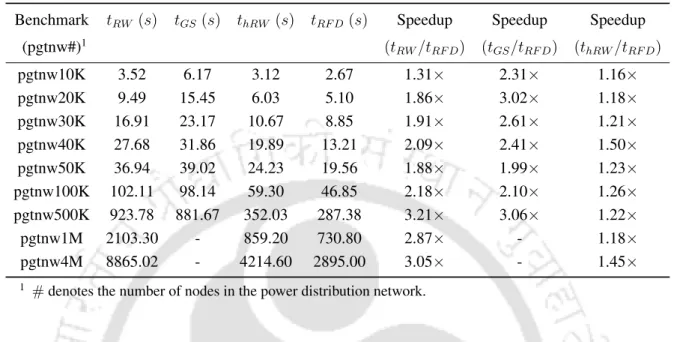
It can be observed from Figure 3.7(a) and Figure 3.7(b) that both TSRW and RFD on GPU have demonstrated speedup of 58.14× and 11.83× respectively over CG (on GPU) while analyzing a power distribution network with 25 million It is seen from Table 3.2 that the speed of and 1.22× is achieved over RW, GS and hRW algorithms, respectively, while analyzing a power distribution network with 500,000 nodes (number of time steps considered within a time period of 1 ms is 500).
Summary
The design of power distribution networks is critical to the proper operation of modern high-speed integrated circuits. This increases the total area of the power distribution network and the design space of the entire system becomes congested for other routing and placement activities.
Problem Formulation
Problem 1 : Minimum IR drop
In this regard, the optimal IR drop at different nodes of power distribution network can be estimated by the minimization problem defined in (4.3), subject to constraints as shown in (4.5). Formulation of the IR drop objective function in (4.4) requires knowledge of voltage profile of the power distribution network.
Problem 2 : Minimum Metal Area
The deterministic approaches discussed in the aforementioned work are no longer reliable in terms of computational time and accuracy to perform the analysis of the power distribution network to minimize the IR drop. In view of this, a heuristic approach such as MRFD can be used to analyze the power distribution network to minimize the IR drop of the entire power distribution network efficiently without formulating any system matrix.
Minimization using River Formation Dynamics Scheme
River Formation Dynamics
In addition, the continuous movement of water droplets causes soil and rock wear, which causes erosion (erodePaths()), i.e. as the droplet travels from nxtony, Alt(nx) is eroded (decreased) and a new altitude, Alt′( nx) is defined as follows [85],. ˆN −1).d.Ds(nx, ny), (4.9) where E(nx, ny) denotes the amount of erosion as the drop travels from nxtony; ϵ represents the erosion parameter; Nˆ denotes the number of nodes and dis the number of drops used in the algorithm. In such cases, the amount of sediment at any node nk depends on the amount of erosion v.
Minimizing IR drop using RFD
The subsequent values of design variables are updated in each iteration and the process is continued for a predefined number of iterations. The mean of solutions is evaluated and assigned the optimal IR drop at the node.
Minimizing metal area using RFD
The procedure for evaluating optimal width of a cell using a single droplet is described in Algorithm 11. Finally, all possible solutions are analyzed and the optimal solution is evaluated by choosing the best fitness value.
Limitations of RFD
River Formation Dynamics Revisited with Proposed New Developments 79
In this regard, the volume of sediment transport rate per unit width per unit time is downstream. Taking these additions into account, the change in volume of sediment transport rate per unit width per unit time, δqsin (4.13), can be expressed as (4.14).
Trend in Sediment Transport Rate
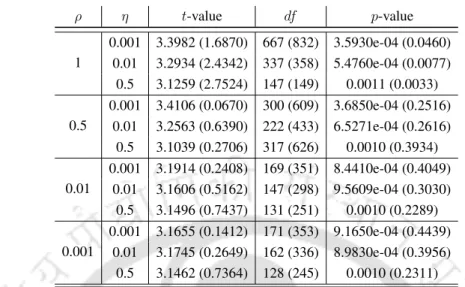
It can be observed from Table 4.1 that for paired statistics three replicates are below 0.05 (5%) significance level and other replicates are between above 0.05 significance level. It can be emphasized that IID increments inδqs are adopted for generating samples of H0 hypothesis model for investigating the characteristics of trend inqs.
Stability Analysis
- Case I
- Case II
- Case III
If the sequence of generated variables is close to the regional territory, (4.14) can be rewritten as (4.18). In this regard, different non-trivial values 0.4 ≤ w < 2 can be evaluated at different values of θ.
Performance on Single Objective Test Functions
- Test Problems
- Peer algorithms and parameter settings
We selected 35 different single objective problems for evaluation, with 23 being unrestricted and 12 being restricted test problems. To quantitatively assess the performance of algorithms on quantitative test problems, success performances (SP or FEs) are used as a measure of the expected number of function evaluations (FEs) to achieve a target function value presented in [126]. .
Performance Assessment
It can be observed from Figure 4.4(a) that MRFD quickly converges to global optimal solution within a relatively small number of FEs (<1e+ 05) for F3 function. It can be observed that MRFD shows superior performance over traditional RFD and peer algorithms in solving all seven constrained test functions in terms of number of FEs.

Power Distribution Benchmarks
The MRFD method can be extended in the future to solve other complicated unimodal and multimodal functions [128–130] to demonstrate its applicability and effectiveness. However, since one of the motivations of this proposed work is to demonstrate the applicability of MRFD method in the optimization of real single objective problems, we focus our discussion on minimizing IR drops in VLSI power distribution networks.
Design Optimization Process
Preprocessing step
Voltage drop at each node and minimization using modified river for-
Next, us andun are assigned to the potentials of the current node and neighboring nodes, respectively. This minimization process is performed on the affected nodes for 25 times independently, and the average of the optimal IR drops is considered as the global optimal solution.
Minimizing metal area using MRFD method
Since similar constraints affect both the IR drop and the metal surface, the random boundary treatment strategy and the limited dominance principle are used to deal with the constraints. The minimization process on each cell is performed 25 times independently and the median of the optimal width is considered as the global optimal solution.
Experimental Results
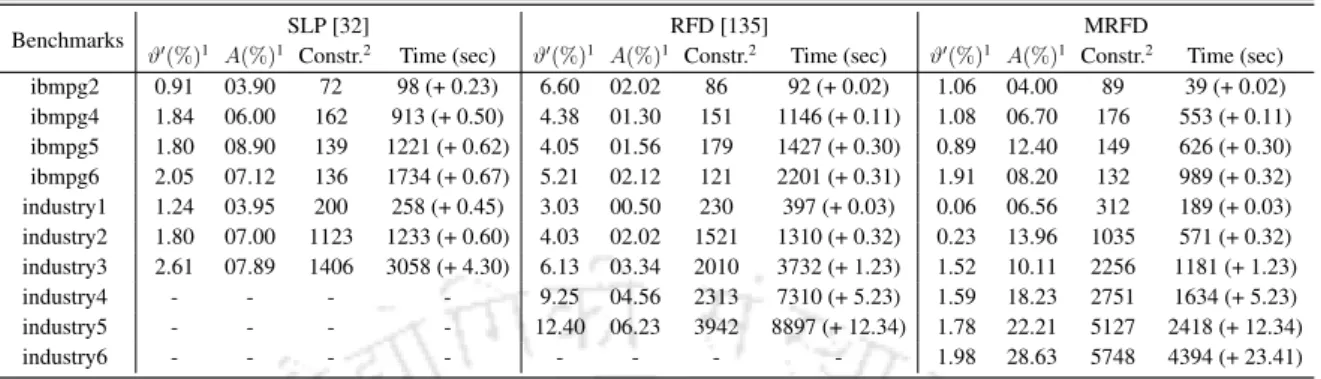
It can be seen from Table 4.4 that with the increase in the number of nodes in the power distribution networks, the reduction of the wire area and affected nodes that exist after optimization using MRFD is random. It can be observed that the MRFD method outperforms both RFD and SLP in computational cost while optimizing the considered power distribution performance measures.
Summary
Since RFD is implemented within a similar framework of MRFD method, the process time (reading time in brackets in Table 4.4) is similar for both the algorithms, while power distribution metrics are analyzed.
Proposed Single Objective Optimization Algorithms for Analog/RF Circuit
River Formation Dynamics (RFD)
- Implementation details
Modified River Formation Dynamics (MRFD)
- Implementation details
Design Examples
- Two-stage Operational Amplifier
- Low Noise Amplifier (LNA)
Discussion
Proposed Multiobjective Optimization Algorithms for Analog/RF Circuit Siz-
Hierarchical Nondominated Sorting Genetic Algorithm II (hNSGA-II) 120
- Theoretical Framework
- Convergence Analysis
- Conditions for Ergodicity
- Performance Analysis
The highest ranking individuals in each local block are selected as the local top individuals. Figure 5.5 shows that the entropy decreases to zero as the β increases.

Multiobjective Modified River Formation Dynamics (MOMRFD)
As new non-dominated solutions are generated in each generation, they are added to the archive. In order to accommodate the new non-dominated solutions in each generation, the excess non-dominated solutions in the archive are removed by using crowding distance strategy.
Improved Multiobjective Brain Storm Optimization (IMBSO)
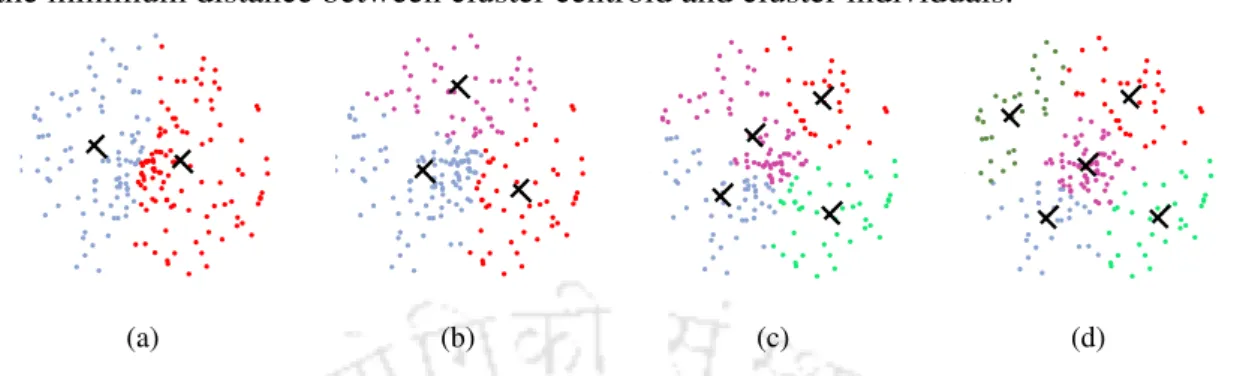
- Clustering Strategy
- Population Generation
- Selection of cluster centroid using RFD scheme
- Adaptive L´ evy Mutation
- Selection
- Updating Global Archive (P archive )
Often a prototype is thought of as a centroid for ideas with continuous properties, that is, the average of all points in the group. Since excessive erosion can develop flat surfaces over landscapes (i.e. the variable values of individuals can become equal or close to zero) making the gradient evaluation insignificant, it is necessary to increase the values of decision variables by depositing sediments, ϵ, avoiding any premature convergence.
Design Examples
Two-stage Operational Amplifier
This sign reversal method analyzes the DC gain value to be maximized by converting it to a minimization problem. Figure 5.10 shows that the DC gain (Av) is maximized sublinearly for a fixed bias at the expense of a core power consumption of 256 mW (PDC) under several design constraints listed in Table 5.6.
![Figure 5.9: Two-stage operational amplifier circuit [142].](https://thumb-ap.123doks.com/thumbv2/azpdfnet/10544874.0/177.892.173.719.141.681/figure-5-two-stage-operational-amplifier-circuit-142.webp)
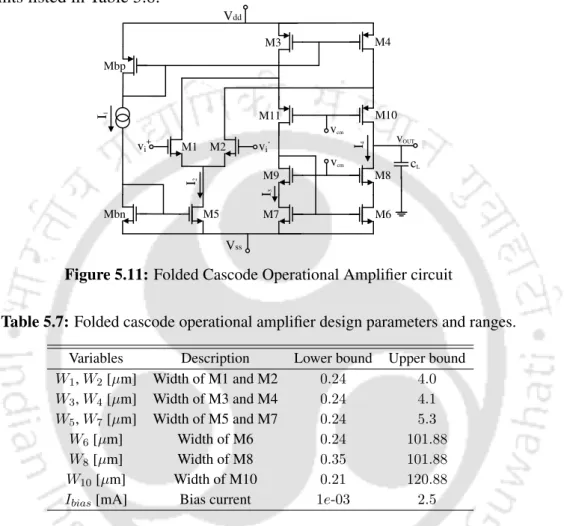
Folded Cascode Amplifier
From Figure 5.10 it can be observed that a smooth distribution of Pareto optimal final solutions is obtained using the proposed algorithms NSGA-II, MOMRFD and IMBSO over a finite search space. Here we choose to formulate the design problem as a multi-objective optimization problem to maximize Av and minimize PDC, subject to a set of constraints listed in Table 5.8.
Low Noise Amplifier
As the proposed multiobjective algorithms are developed for the minimization of objective functions, the sign of gain value is reversed during realization to convert the maximization problem into minimization problem. Similar to the design examples discussed earlier, the closed expressions for NF and other design constraints are approximated on the design as reported in [147].

Simulation settings and parameters
The parameter settings for peer algorithms are given in Table 5.11, where N,Ns and Adenoters are the population size, swarm size and archive size, respectively. Mutation and crossover probabilities are represented by pm and pc respectively and, ηmandηcdenote distribution index for mutation and crossover respectively.
Constraint Handling
To deal with inequality constraints during circuit design optimization, the bounded dominance principle [7] is used to identify and rank feasible solutions according to their level of non-dominance. According to [7], the feasible solution has a better non-domination order than the infeasible solution using the bounded dominance principle.
Experimental Results and Discussion
Diversity Maintenance
Further, to demonstrate the diversity changes when searching for homologous multiobjective optimization algorithms in solving three design examples, the average values of HV are evaluated over a number of function evaluations, and the results are shown in Figure 5.15. From Figure 5.15 it can be observed that as the number of function evaluations increases, the HV values increase and remain stable as the population converges towards the Pareto optimal front.
Summary
In this chapter, the motivation is to address the issue of IR trap over the memristor cross-bar array (MCA) as a single objective minimization problem and to solve the optimization problem using the proposed single objective optimization framework based on both RFD and MRFD methods. to a number of constraints, such as leakage current, IR drop threshold, metal width, etc. An overview of the memristor crossbar array and the analytical formulation is presented in Section 6.2, together with the IR drop profile of the memristor crossbar array.
Memristor Crossbar Array (MCA)
IR drop profile
To obtain the optimum in the whole MCA, an accurate estimation of the node potentials (vn) across the transom by generating the system matrix using MNA and analyzing it using the LU decomposition method is required. Here, the KLU solver is used to solve the system matrix in (6.3) to efficiently estimate the nodal potentials (vn).
Problem Formulation
Minimization of IR drop of Memristor Crossbar Array
Memristor Crossbar Array Benchmarks
Preprocessing Stage
Peer Algorithms and Parameter Settings
Results and Discussion
Summary
Directions for the future work
Power distribution network benchmarks
Quality Indicators
Generational Distance (GD)
Inverted Generational Distance (IGD)
Hypervolume (HV)
Performance Assessment
Introduction
To demonstrate the improvement of IR drop reduction in MCA, experiments were conducted on several benchmark MCA circuits to effectively estimate the optimal IR drop. The metal wires along the set of bars are assumed to have nominal resistances to represent the IR drop phenomenon in the MCA.
![Figure 6.1: (a) Memristor crossbar array architecture [50], (b) Resistive model of a cell in MCA.](https://thumb-ap.123doks.com/thumbv2/azpdfnet/10544874.0/195.892.137.784.221.534/figure-memristor-crossbar-array-architecture-resistive-model-cell.webp)