137 Figure 7.26 ESEM images of laser-irritated Cu alloy from different areas at 50 mJ laser energy. 137 Figure 7.27 FESEM images of laser-irritated Cu alloy from different regions at 75 mJ laser energy.
Introduction
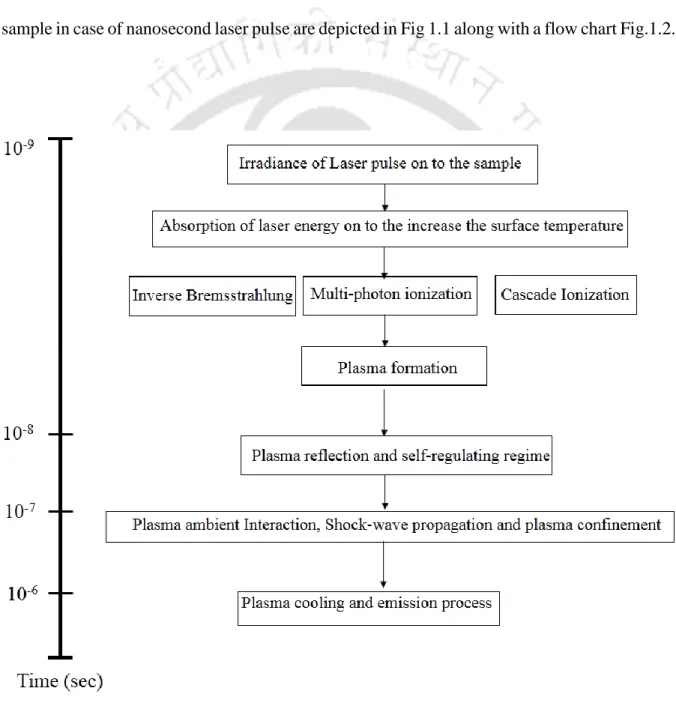
Processes involved in laser induced breakdown
- Laser matter interaction and plasma formation
- Plasma expansion
- Plasma cooling and emission of radiation
- Particulate formation
For a nanosecond laser pulse, the trailing portion of the laser pulse is absorbed by the LIP. The first part of the laser contributes to generating the plasma, while the rest of the laser energy in the later part is absorbed by the plasma and the shocked gas.
Laser induced breakdown spectroscopy
- Influence of laser parameters on LIBS
- Effect of the surrounding medium
- Target characteristics and geometry
This consequently increases the absorption of the laser energy by the target, which in turn increases the plasma temperature. Otherwise, when the absorption of the laser energy is less, the process is reversed with similar results.
Objective of the present work
Cavity formation on the sample surface confines the plasma, so a larger cavity ratio (depth/diameter values) will contribute to a higher plasma temperature [90]. The geometry of the optical alignment to generate and collect the signal from the plasma affects the accuracy of LIBS [91]. The temporal and spatial evolution of plasma emission, signal-to-noise ratio (SNR), plasma temperature, and electron density are reported as a function of laser energy.
Characterization of Laser Induced Plasma using LIBS
Laser induced breakdown spectroscopy
- Local thermodynamic equilibrium (LTE)
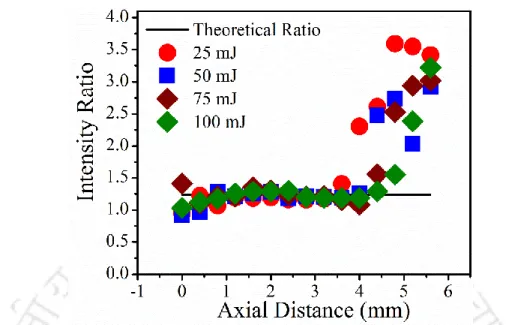
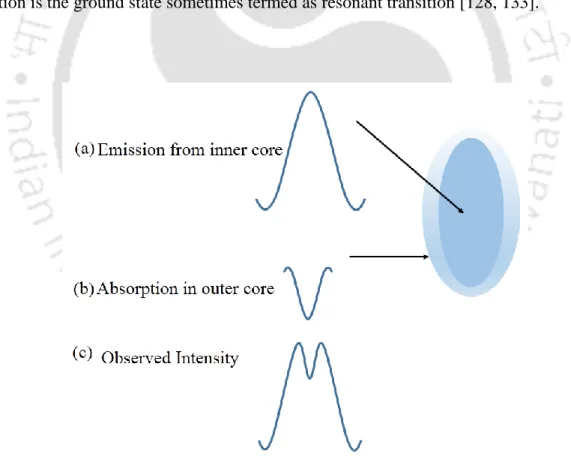
- Optical thin condition of plasma
As an example, the figure shows one of the line radiation emitted by LIP. If the experimental intensity ratio matches the theoretically observed value from equation (2.11), then the plasma can be considered to be optically thin.
Plasma parameters
- Plasma temperature
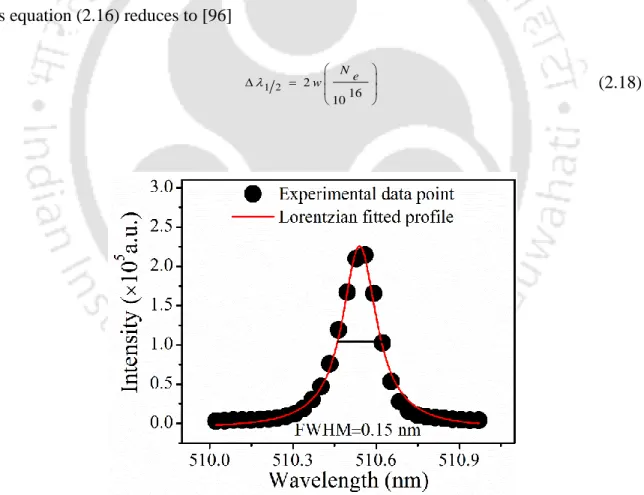
- Electron density via stark-broadened profile
In LIBS, the electron density can be estimated from the broadened profile of the emitted lines [96]. In LIP, the contribution of Doppler broadening is very small compared to that of the somatic broadening.
Conclusion
Experimental Details
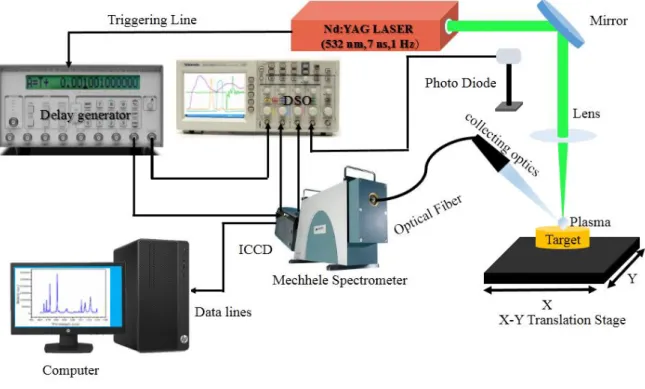
Experimental set up for time-resolved LIBS studies
For this, a delay generator (Stanford Research Systems DG545) is activated with the Pockels cell output of the. To monitor the arrival of laser pulse and opening of ICCD, a part of the laser beam is detected by a photodiode and displayed on one of a four-channel of a digital storage oscilloscope (DSO) (Tektronix TDS 2024B) together with the ICCD gate delay on other channel simultaneously.
Experimental set up for space-resolved LIBS studies
In this thesis, the incident laser energy is varied from 25 -100 mJ by controlling the voltage of the flash lamp. The diameter of the beam spot size on the targets is measured by optical microscope (OLYMPUS BX51M) and found to be 230 µm. There is no change in the focused area with the incident laser energy. The single-shot laser images of the three targets, tungsten, molybdenum and one of the Cu alloy (commercial brass) are shown in Fig.
Conclusion
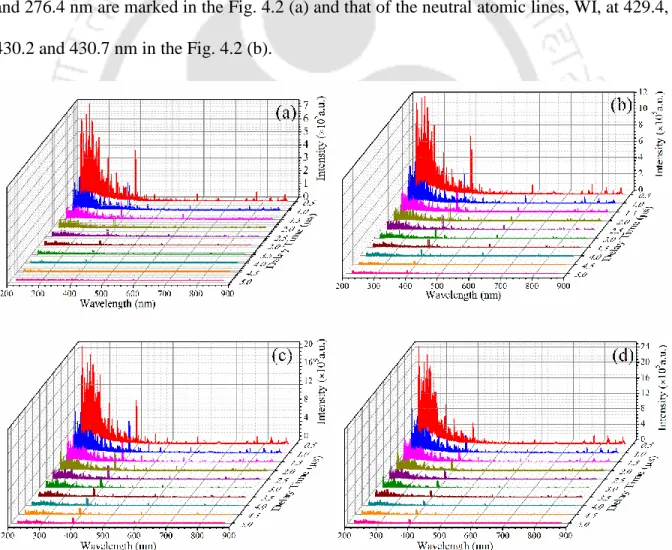
However, there is little published literature on tungsten and a lack of a database of atomic parameters for tungsten transitions. Therefore, this chapter describes the temporal and spatial evolution of the tungsten LIP as a function of the incident laser energy in air. These studies provide an optimal temporal and spatial window to study LIP of tungsten in air for various applications, e.g.
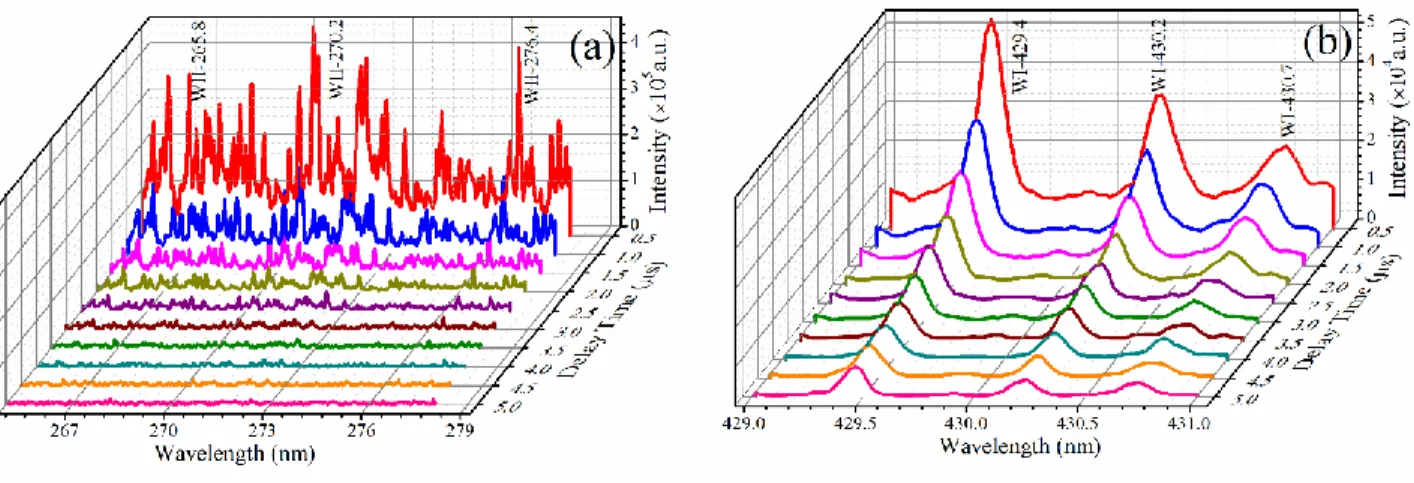
Time-resolved studies on LIP of tungsten
- Time-resolved emitted intensity of WI and WII transitions in LIP of tungsten . 43
- Time-resolved studies on electron density of tungsten LIP
- Validity of optical thin condition of transient LIP of tungsten
- Evaluation of LTE condition for transient LIP of tungsten
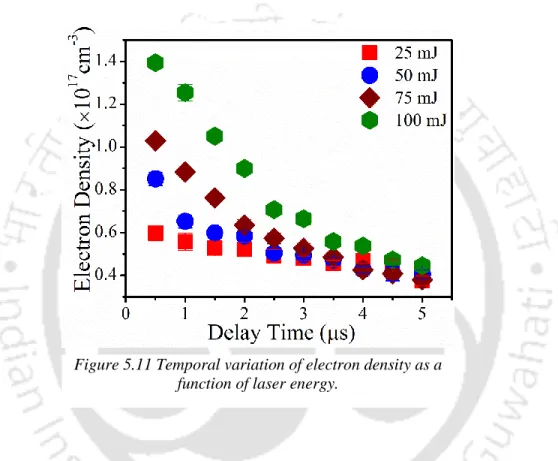
The electron density decay in the delay range of 0.5-5 μs as a function of the incident laser energy is shown in figure. The plasma temperature and electron density are found to be maximum at a delay of 0.5 μs (initial recording time) to each of the incident laser energy. Under the current experimental conditions, the visible range of the spectrum is used for the estimation of plasma temperature and electron density.
Space-resolved studies on LIP of tungsten
- Spatial distribution of plasma emission intensity of tungsten
- Spatial distribution of plasma temperature LIP of tungsten
- Spatial distribution of electron density LIP of tungsten
- Analysis of optical thin condition for inhomogeneous LIP of tungsten
- Validity of LTE criteria for inhomogeneous LIP of tungsten
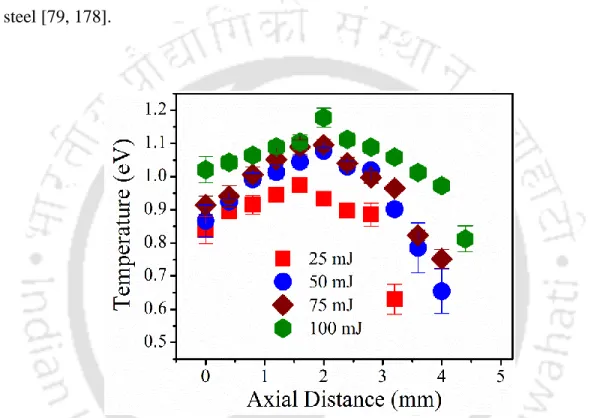
The ionic lines occur close to the target surface compared to the atomic lines. This is also consistent with the spatial evolution of the line emission from the atomic transition of Al and steel [79, 178]. In the immediate vicinity of the target surface and towards the edge of the plasma (far away from the target), the diffusion length is increasing, indicating the tendency of deviation of LTE [179].
Conclusion
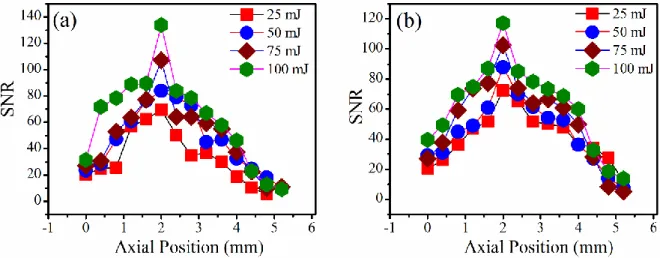
The time evolution of the SNR at four different energies reveals that it increases with laser energy in the temporal window of 0.5–3.5 μs, but beyond this window it drops. It is found that in the time window of 1-3.5 μs, the LIP is fulfilling the optically thin plasma condition. The LIP is observed to be in LTE up to a distance of 4.0 mm from the target beyond which it starts to move away from LTE.
Time and Space-Resolved Studies on Laser Induced Plasma of
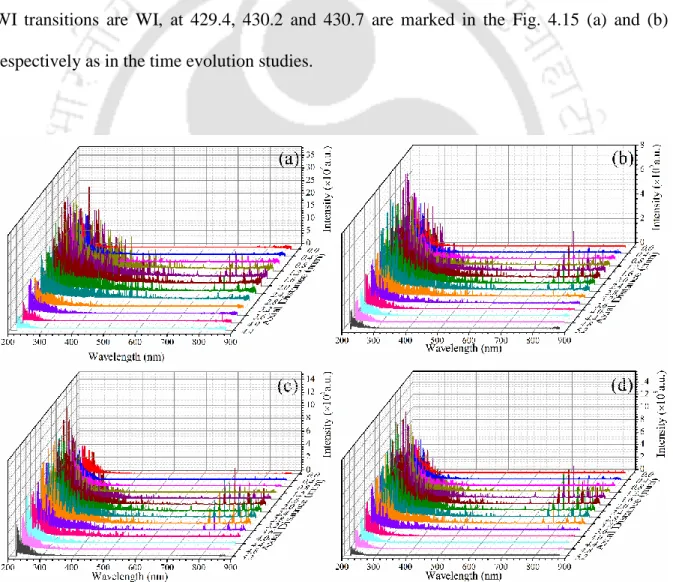
Studies on the temporal evolution of LIP of molybdenum
- Temporal variation of plasma emission intensity of molybdenum
- Temporal variation of plasma temperature of molybdenum
- Temporal variation of electron density from the stark-broadened profile of
- Assessment of optical thin condition in transient LIP of molybdenum
- Validity of LTE condition in transient LIP of molybdenum
The temporal evolution of the plasma temperature shows that it decreases as the delay time increases, in both cases MoI and MoII lines, but increases with the increase of the incident laser energy. In the initial delay range of 0.5–1.0 μs, the temperature range is higher for MoII than that of the MoI, but in a later time range of 1.5–5 μs, the temperature has similar values in both cases. The variation in the electron density with the incident laser energy is more prominent in the initial time window of 0.5–1.5 μs compared to that of the later delay time.
Studies on the spatial evolution of LIP of molybdenum
- Spatial variation of plasma emission intensity of molybdenum
- Spatial variation of plasma temperature of molybdenum
- Spatial variation of electron density of molybdenum
- Assessment of optical thin condition in inhomogeneous LIP of molybdenum
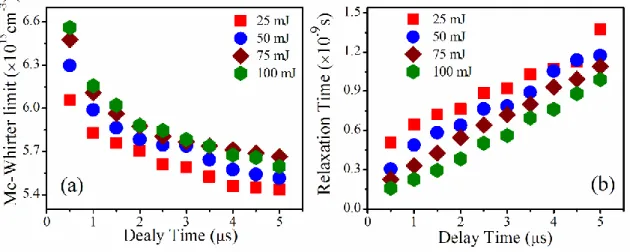
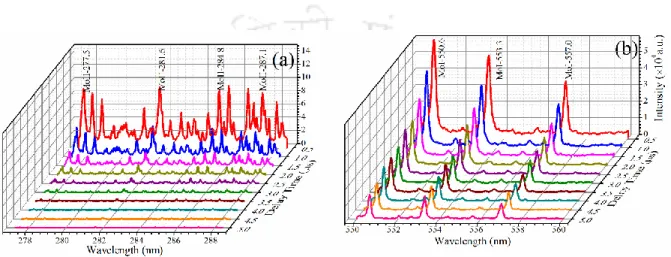
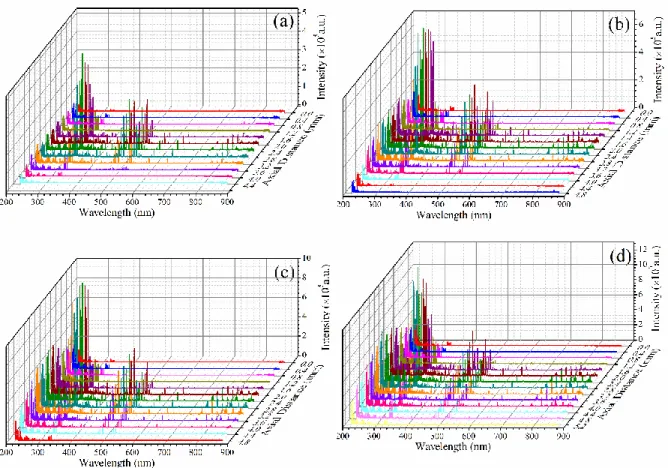
The LIP emission spectra recorded at different locations along the axial expansion direction (z-axis) of the LIP of Mo using the experimental setup, Fig. The obtained relaxation time is of 10-10 s, which is much smaller than the order plasma decay time of 10-6 s. The maximum intensity of ion line appears slightly closer to the target compared to that of atomic lines.

Estimation of percentage composition from single line CF-LIBS technique
The ionic number density can be estimated from Saha-Boltzmann equation given by equation following equation,. The experimental factor F in equation (6.1) can be eliminated by normalizing the sum of the total number density over all elements, m, present in the plasma, given by the following equation. In the present case, only atomic and single-ionized transitions are observed, therefore the summation is limited to z=2 in equation (6.3) and (6.4) where z=1 corresponds to neutral atom and z=2 that of the single- ionized ion.
Influence of delay time on CF-LIBS measurements
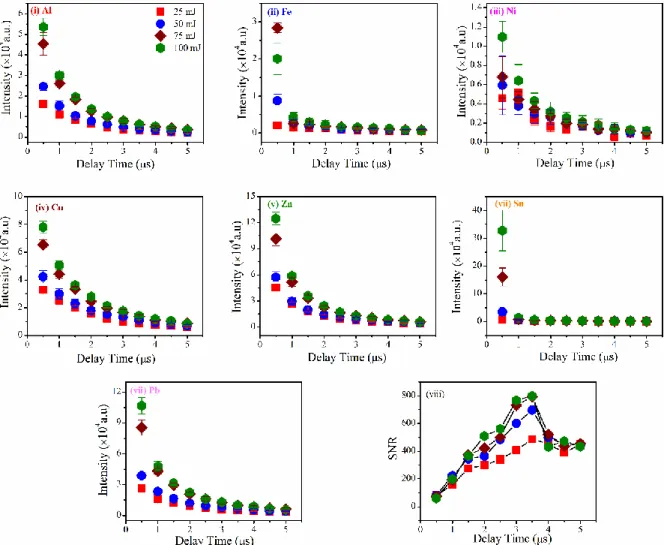
- Temporal evolution of emission spectra of copper alloys
- Temporal evolution of plasma temperature of copper alloys
- Temporal evolution of electron density of copper alloys
- Validity of optical thin condition of LIP of copper alloys
- Validity of LTE condition of LIP of copper alloys
- Percentage composition of constituent elements via CF-LIBS
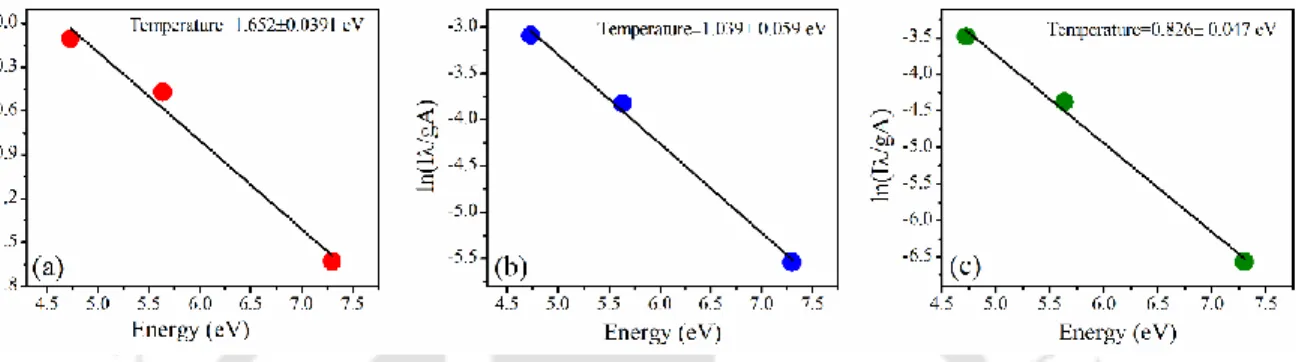
The temporal evolution of LIP spectra of the sample 2 at 50 mJ of incident laser energy Fig. The corresponding atomic spectral data for all these five lines are taken from NIST database and are listed in Table 6.2. The Boltzmann plot from CuI lines with a delay time of 0.5, 3.0 and 5.0 μs for the laser energy of 50 mJ is shown in Fig. 6.10(a) shown. The plasma cools adiabatically with the proceeding time after the termination of laser pulse.
Influence of spatial evolution of LIP on CF-LIBS measurements
- Spatial evolution of plasma emission
- Axial variation of plasma temperature
- Axial variation of electron density
- Assessment of optical thin condition of plasma as a function of separation from
- Assessment of LTE Condition of plasma in spatial extension
- Optimized spatial window for the measurement of percentage composition via
The axial variation of plasma temperature as a function of incident laser energy from the same six CuI passes as in the time evolution, Section 6.2.2, is shown in Fig. The drop in plasma temperature near the target surface is due to thermal conduction from. The maximum electron density is observed at a distance of 1.2 mm from the target surface.
Conclusion
By the observation in the section, it can be concluded that the optimal spatial window for CF-LIBS for the present experiment is in the range of 0.8-2.8 mm away from the target.
Surface Morphological Characterization of Laser Ablated
Experimental details
The surface of laser-ablated tungsten, molybdenum and copper alloys is studied using an optical microscope, surface profilometer, field emission scanning electron microscope (FESEM) and Raman spectroscopy. Crater depth is determined using a high-resolution non-contact surface profilometer with a field of view of 0.825 mm × 0.825 mm (Taylor Hobson, Taly surface CCI lite). The spatial resolution of the Raman spectrometer is 1 μm, and the spectral resolution is less than 1 cm-1.
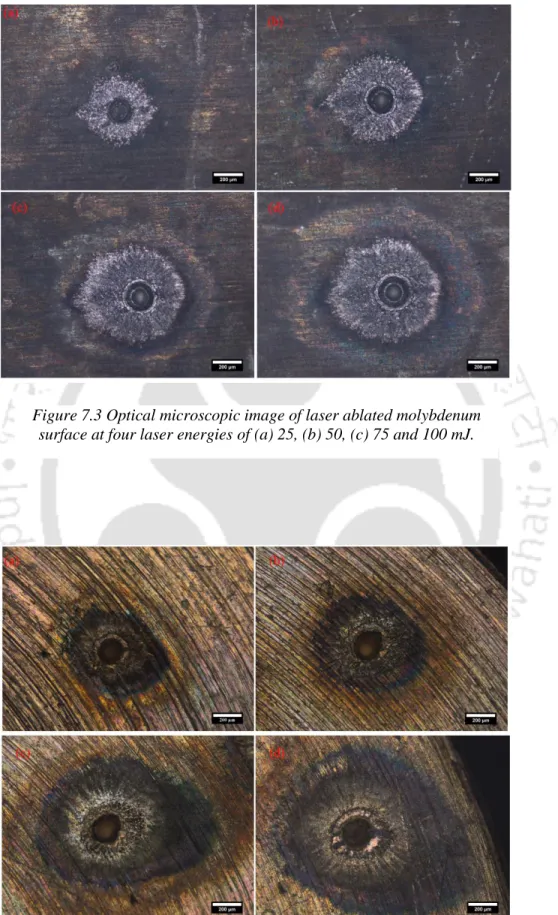
Surface characterization using optical microscope
7.7 (a) in green, yellow and red circle rusty for region (i), (ii) and (ii) on tungsten, molybdenum and Cu alloy at 25 mJ laser energy respectively. In the case of metal, laser energy is initially absorbed by the free electron through the IB process. The absorbed laser energy then spread to an area outside the focal region via thermal conduction, causing the irradiated target to reach its boiling and vaporization temperature.
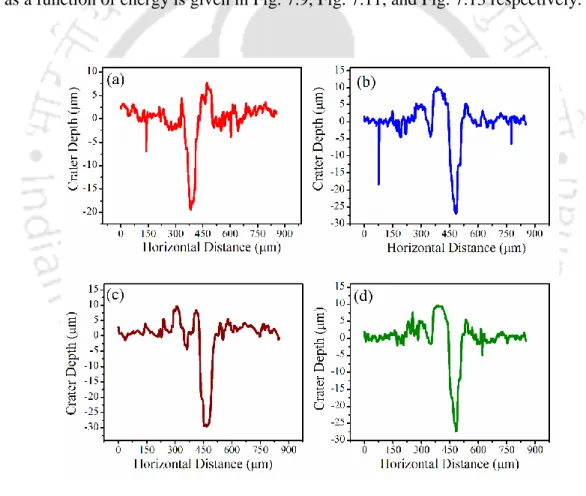
Depth profile measurement by Surface Profilometer
As in the present case, the ablation of the target is done by 30 consecutive laser pulses, the mass ablated per laser shot is obtained by dividing the total ablated mass by the 30. It is observed that the depth profile as well as mass ablation rate of all the three targets increases as the incident laser energy increases from 25-75 mJ, but at 100 mJ laser energy there is a drop in mass ablation rate for tungsten and for molybdenum target, where there, such as that of for Cu alloy, is hardly any change. This is due to the fact that initially with the increase in laser energy, the more energy is deposited on the target surface leading to higher mass ablation, but at higher energy due to excessive plasma density, the plasma shielding comes into play and the laser energy is prevented to reach the target and thus reduce the mass ablation rate.
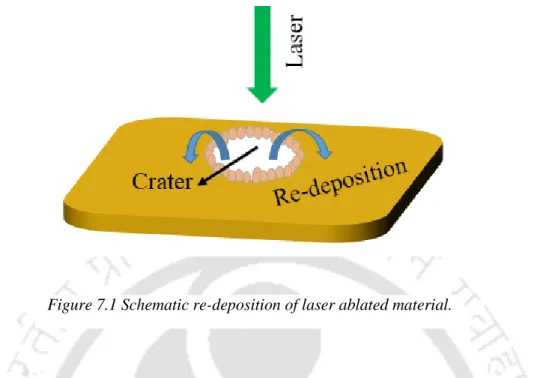
Characterization of re-deposited particulates by FESEM
All these FESEM images clearly reveal surface modification due to localized heating, melting, evaporation and re-solidification. The images in Fig (b) correspond to the rim of the crater which has grown due to the displacement and re-deposition of the molten layer. There is a deposit of mass on the rim of the crater due to splashing and displacement of the molten layer from the center of the crater.

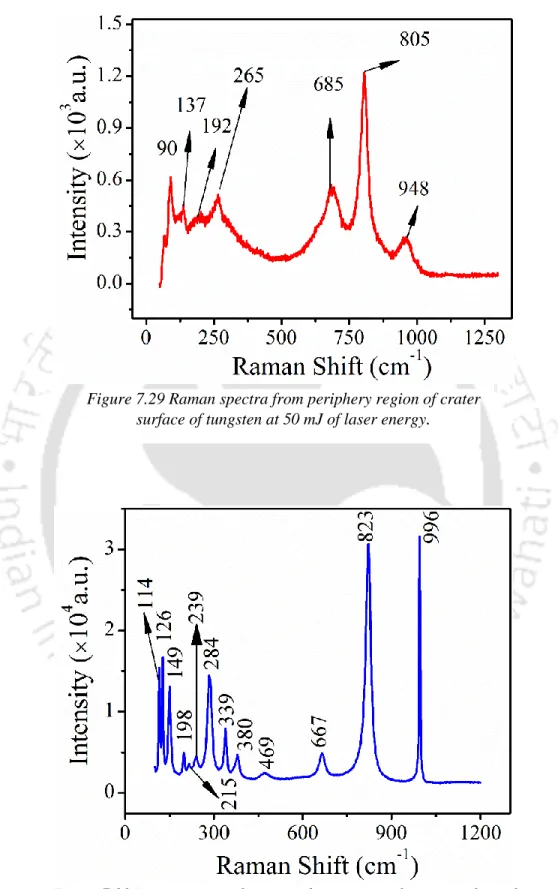
Structural studies on the re-deposited material by Raman spectroscopy
Raman spectra from a laser-ablated Cu-alloy in air (fringe region) for an incident laser energy of 50 mJ are shown in the figure. Although this target is made of Al, Fe, Ni, Cu, Zn, Sn and Pb (Chapter 6), but the concentration of Cu is the highest in the target.
Conclusion
Crater depth profiles are measured via non-contact surface profilometer at all laser energies for all three targets. It is observed that the HAZ, crater depth, and mass removal rate increase up to 75 mJ and then begin to saturate and decrease. Raman spectra from the peripheral region of the crater reveal the formation of the corresponding oxides of the target elements only in the peripheral regions.
Conclusion and Future Scope
Vadas, Quantitative analysis of pharmaceuticals by laser-induced breakdown spectroscopy, Spectrochimica Acta Part B: Atomic Spectroscopy. Palleschi, Calibration-free laser-induced breakdown spectroscopy: state of the art, Spectrochimica Acta Part B: Atomic spectroscopy. Pedarnig, Calibration-free laser-induced breakdown spectroscopy of oxide materials, Spectrochimica Acta Part B: Atomic spectroscopy.