It is certified that the work contained in this thesis titled "Adaptivity and Interface Design: A Human-Computer Interaction Study in E-Learning Applications" has been done by me, a student in the Department of Design, Indian Institute Of Technology Guwahati under the guidance of Prof. Yogesh Deshpande to the Indian Institute of Technology Guwahati for the award of the degree of Doctor of Philosophy has been done under our supervision.
User’s Adaptivity In E-Learning - An Introduction
- Introduction
- Need for Research in User Adaptivity in E-Learning
- Definitions of Terms Used In Thesis
- E-Learning Context (EC)
- User Adaptation (UA)
- Task Adaptation (TA)
- Learning Focus (LF)
- Interaction Efficiency (IE)
- Click Efficiency (CE)
- Page Efficiency (PE)
- Research Questions and Objectives
- Research Framework and Hypothesis
- Methodology and Experimental Design
- Thesis Contribution
- A new measure of task adaptation
- A new measure of user’s adaptivity to user interfaces
- Data collection and analysis of user adaptations and adaptivity
- Recommendations for e-learning designers
- Organization of the Thesis
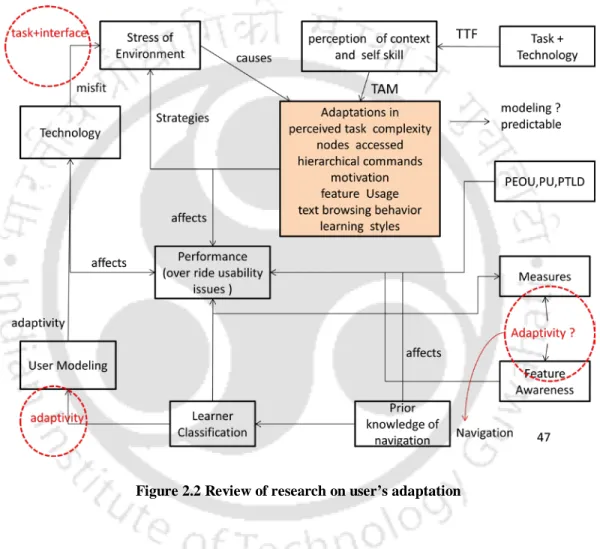
By learning context we mean the combination of learning task and learning application. User flexibility in e-learning is driven by the characteristics of the learner, the learning task and the e-learning system.
Literature Review
- Introduction
- E-Learning Acceptance and TAM
- The Task Technology Fit (TTF) in E-Learning
- Modeling the Learner in E-learning
- Limits of Learner Personalization
- Importance of User’s Adaptations in E-learning
- Internal Factors of User’s Adaptations
- External Factors of User’s Adaptations
- Measuring User’s Adaptivity to Interfaces
- Conclusions
The next section of this review summarizes research on user adaptations in e-learning settings. In the previous section, we reviewed works related to the internal human factors of user adaptations.

Methodology
- Introduction
- Participants & Sample size
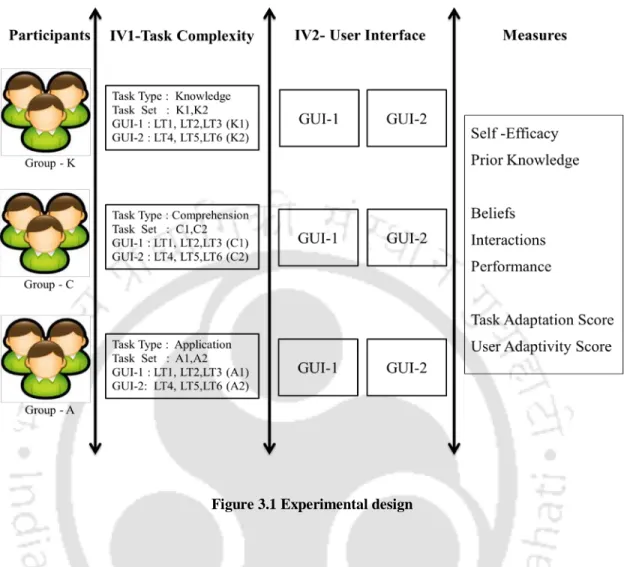
- Experimental Design
- Experimental Set-Up
- Measurement instruments
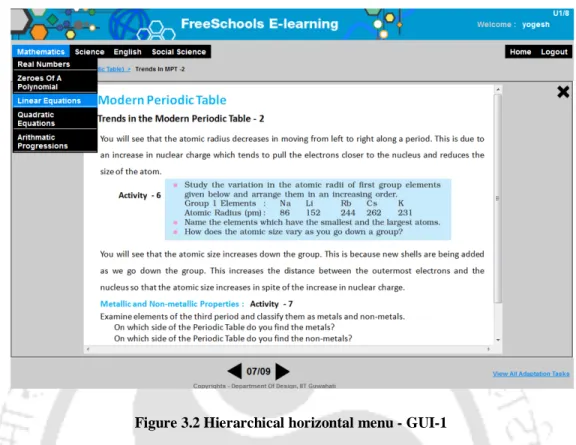
- E-Learning Application
- Learning Test – Based on Bloom’s Taxonomy
- User Adaptivity Testing Tool
- Experiment Procedure
- Statistical and Mathematical Methods Used for Data Analysis
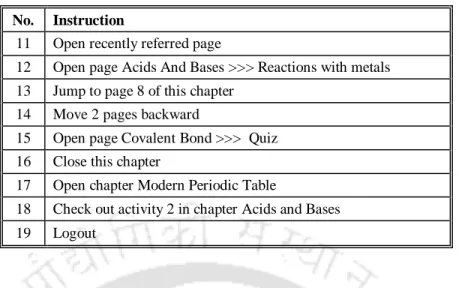
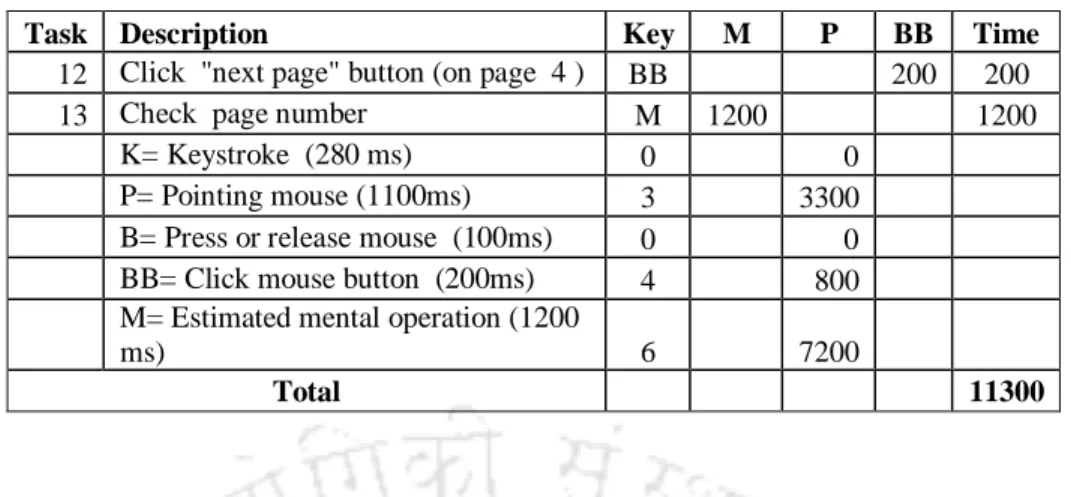
Participants executed a set of predefined instructions given in Table 3.6 and 3.7 in a sequence as a repeated task. The keyboard level model (KLM) was used to predict the completion time for each instruction of the repetitive task. A sample KLM analysis of the instruction, 'Go to Page No. 4 of the chapter Real Numbers of Mathematics' in GUI-1 is shown in Table 3.8.
An analysis of the demographic details of the three sample groups is shown in Table 3.9 and the corresponding questionnaire used for data collection is shown in Appendix A1.
Data Analysis of the Study on User’s Adaptations
Introduction
In this chapter, we present the data collection and analysis of the user's adjustments. To do this, we divided the participants into three sample groups (K, C and A) based on the type of learning tests they received. As you may recall, in Part A of the experiment, participants initially responded to Questionnaire Q1 (Appendix A1).
We repeated the same procedure for the same participants on the GUI-2 with a different set of learning trials of the same type.
The Measure of Task Adaptation Score (TAS)
We also calculated adjustments in GUI-1 and GUI-2 for all dependent variables (Table 3.2, Chapter 3).
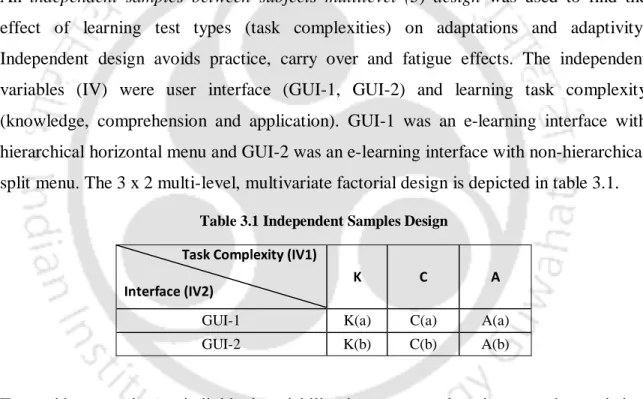
Adaptations in Beliefs
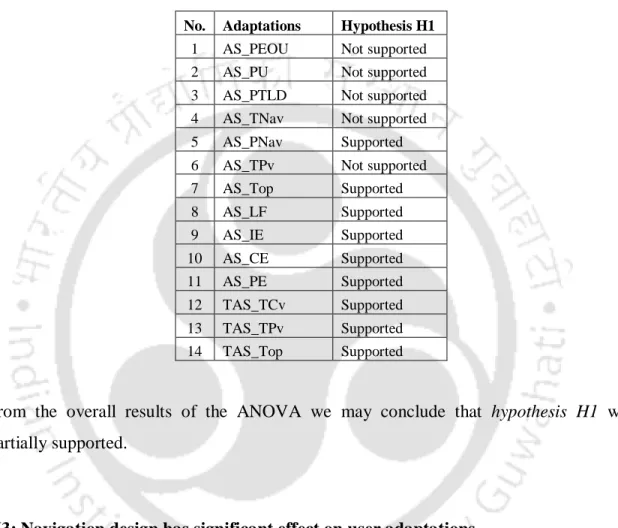
The last row shows the calculated fit scores across GUIs in the beliefs based on Eq. We observe low adaptation scores in PEOU, PU and PTLD induced by the two interface designs in all three sample groups K, C and A. We quantified adaptations in beliefs across GUI-1 and GUI-2 to respective adaptation scores AS_PEOU, AS_PU and AS_PTLD in according to Eq.
We correlated adaptation scores (AS), e-learning self-efficacy (ELSE), prior knowledge, and the sum of the learning test scores on GUI-1 and GUI-2.
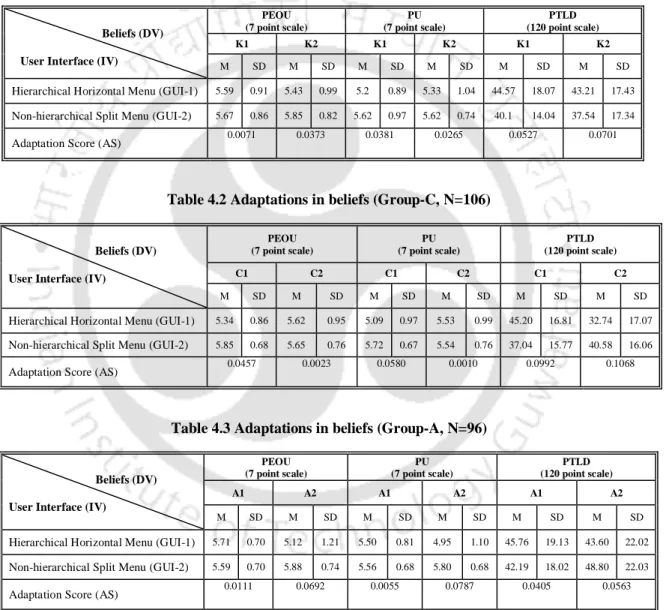
Adaptations in Navigational Behavior
We can conclude from this that user interface designs, which are currently being studied, induce significant adjustments in the use of subject commands during knowledge- and concept-oriented learning. It can be concluded that the user interface designs examined require significant adjustments in the use of page commands. Collectively, it is noted that the interface designs currently under study require significant adjustments in the overall operations or clicks.
We can conclude that the navigation designs of interfaces under investigation induce significant adaptations in TNav, PNav, TPv and Top.
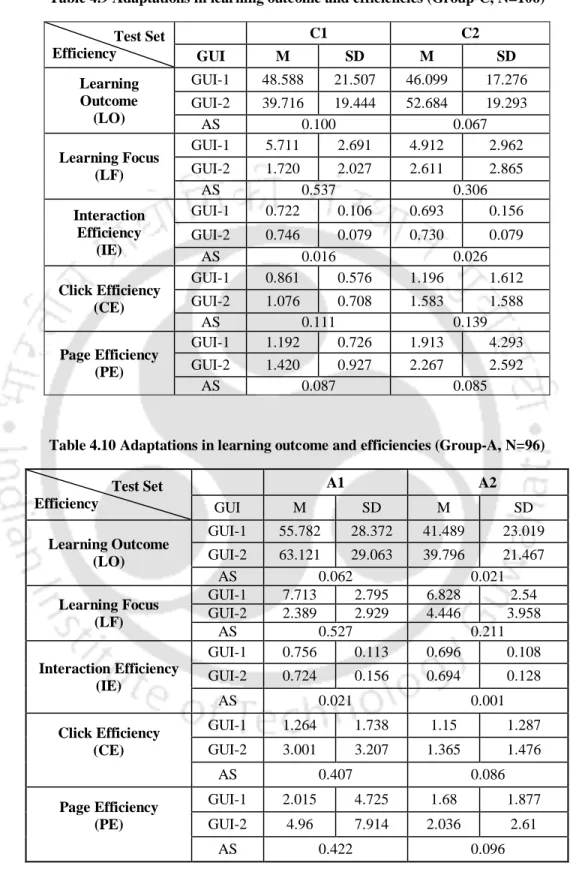
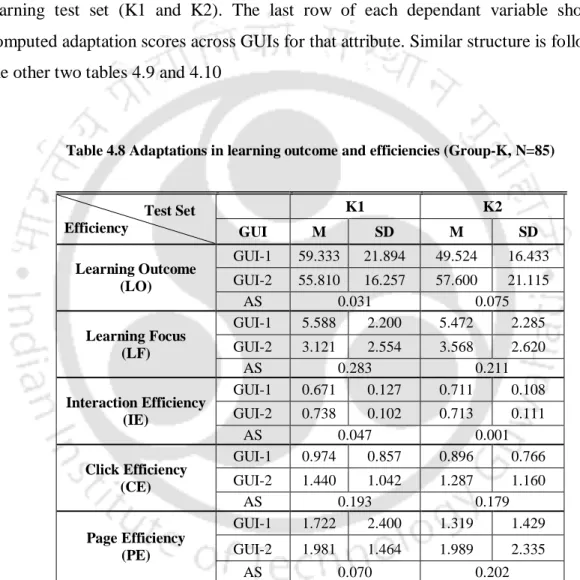
Adaptations in Learning Outcome and Efficiencies
We also checked for correlations of fit scores (AS) of floating attributes with e-learning self-efficacy (ELSE), prior knowledge, and sum of learning test scores on GUI-1 and GUI-2. We observed significant adaptations in CE and PE due to changes in the total operations required for GUI-1 and GUI-2. Higher learning focus adaptation scores reflect that interface designs impose a significant difference in page commands required for learning, i.e.
We performed a correlation analysis between adaptation scores (AS) of learning efficiency, e-learning self-efficacy (ELSE), prior knowledge and the sum of learning test scores on GUI-1 and GUI-2.
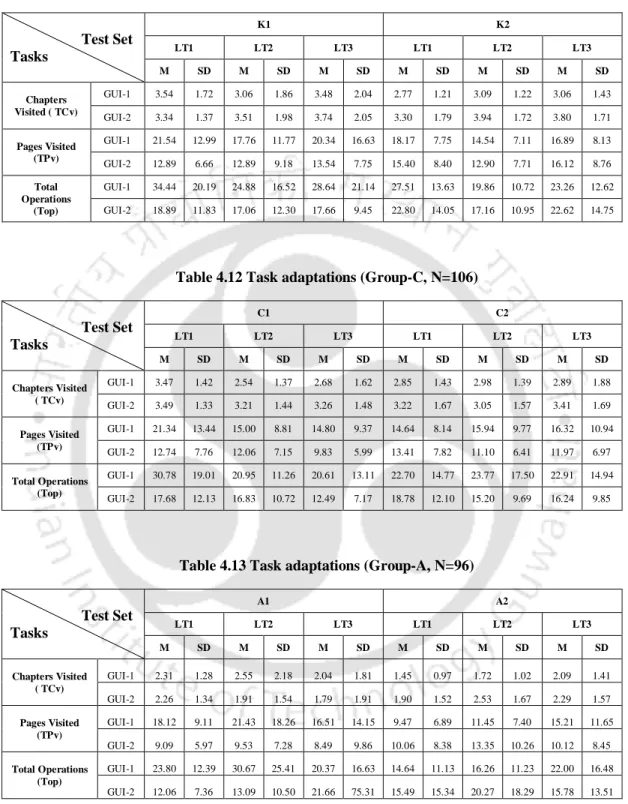
Task Adaptations within GUI
The tables show that there are no significant differences in the chapters visited (TCv) between GUI-1 and GUI-2 for all learning tests and in all three sample groups K, C and A. We calculated task adaptability scores (TAS). for the chapters visited (TAS_TCv), the pages visited (TAS_TPv) and the total edits (TAS_Top) between the learning tests for GUI-1 and GUI-2 for the participants within the same sample group, using Eqn. The navigation designs of the interfaces do not affect the task adjustments between the learning tests.
Higher ELSE increases the PEOU of the learning context and helps reduce perceived task load.
Validation of Hypothesis H1, H3
We conclude that hypothesis H1 is supported for adjustments in page assignments (PNav) and total operations (Bo) across user interfaces. From the overall results of the ANOVA, we can conclude that hypothesis H1 was partially supported. Effect of navigation design (GUI-1 and GUI-2) on adjustments in beliefs (section 4.2), navigation behavior (section 4.3), learning efficiency (section 4.3) and task adjustments (section 4.5) has already been shown together with the results of respective t-tests .
In summary, we can conclude that hypothesis H3 is well supported for beliefs, navigational behavior and learning effectiveness.
Conclusions
Data Analysis of the Study on User Adaptivity
Introduction
As part B of the same experiment, we studied how learners become familiar with an e-learning interface in repeated trials. In this chapter, we will present the data collection and analysis of these adaptability tests to study user adaptability. The aim of this part of the experiment was to check whether the complexity of the learning task and the navigation design have a significant effect on the user's adaptability (hypothesis H2, H4), whether the self-efficacy of e-learning has a significant effect on the user's adaptability (H5) and whether the user's adaptability has a significant effect on the learning result ( H6).
To compare user interfaces based on the user's ability to gain expertise, we propose a new measure in this thesis.
The Measure of User’s Adaptivity Score (UAS)
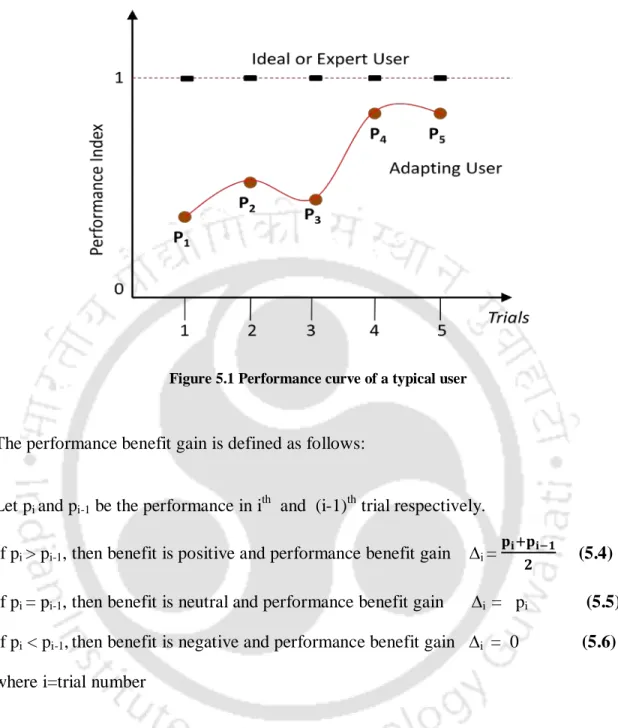
𝐽𝐭𝐮𝐥 𝐜𝐥𝐢𝐜𝐤𝐬 𝐨𝐩𝐞𝐫𝐭𝐞𝐝 𝐟𝐨𝐫 𝐭𝐡𝐞 𝐭𝐬𝐭 𝐤 (𝐂𝐭𝐭) (5.2) To measure the skill level of the user in the i-th experiment, we developed measures of integrated performance (Pi) as the product of Pt and Pc. User Adaptability Assessment (UAS) = performance benefits gained by the actual user. Optimal benefits for the experienced user. User adaptability therefore measures the level of user expertise achieved when familiarizing with the interface.
The participant's performance in the adaptability tests and the calculation of user adaptability scores for GUI-1 and GUI-2 for all three sample groups (K, C and A) are presented in the next section.
Computing User Adaptivity
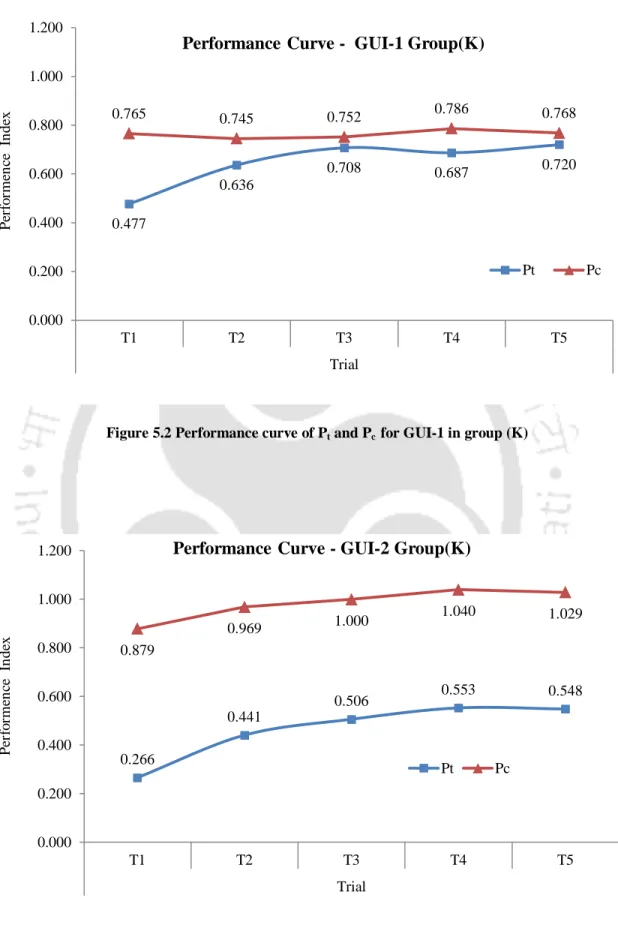
We can conclude that participants need more practice to complete tasks in minimum efforts using hierarchical horizontal menu compared to non-hierarchical split menu interface. Figures 5.8-5.13 show mean integrated performance index Pi of the group against trial, for GUI-1 and GUI-2 in sample groups K, C and A respectively. Total benefits accumulated by all participants of the group during the adaptation period (5 trials) on GUI-1 and GUI-2 in sample groups K, C and A are shown in table 5.1.
Flexibility tests show that consistency in performance improvement is better in a non-hierarchical split menu interface compared to a hierarchical horizontal menu interface.
Therefore, the user adaptability scores on the simplified GUI-1 are significantly higher than the results on the complex GUI-2 for group C. To determine the relationship between the user adaptability scores (UAS) and the student's e-learning self-efficacy (ELSE), we performed a correlation analysis. However, because the learning tests given were time-limited, we thought that a learner's level of user interface skill or user adaptability might influence his test scores.
To investigate this, we conducted a correlation analysis between user adaptivity scores (UAS) and learning outcomes (LO).
Validating User Adaptivity
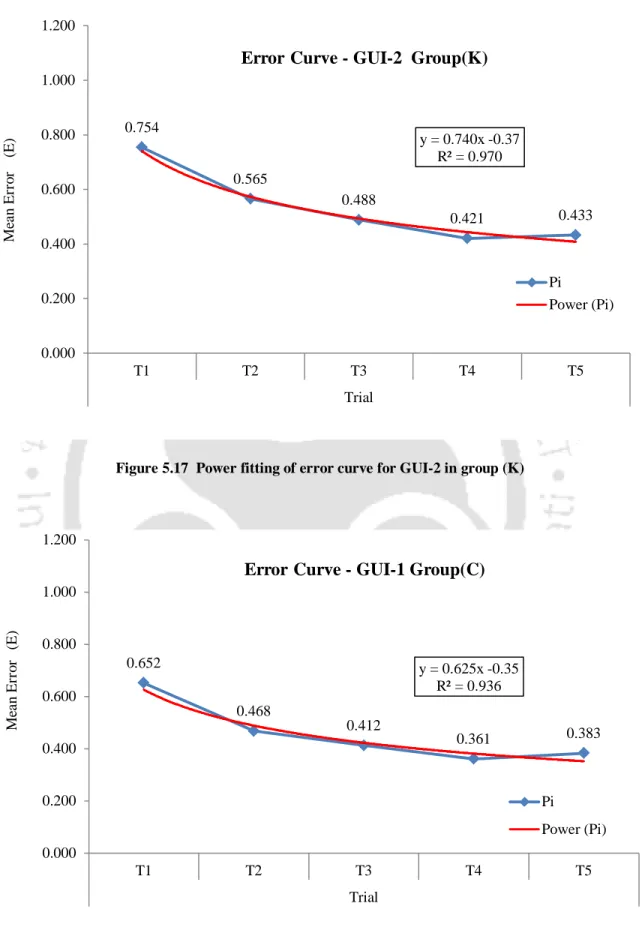
To get an idea, we will show the experience curves of 3 participants in GUI-1 and 3 participants in GUI-2 of the K-only knowledge-oriented group. The user suitability score (UAS) of the participant is also shown in the graphs for reference. The shape of the experience curve in Figure 5.22 and 5.23 and the value of R2 (goodness of fit) clearly show that #P1 and #P2 show non-adaptive behavior.
Lower value of R2 and slope are related to lower adaptivity scores reflecting a non-adaptive behavior.
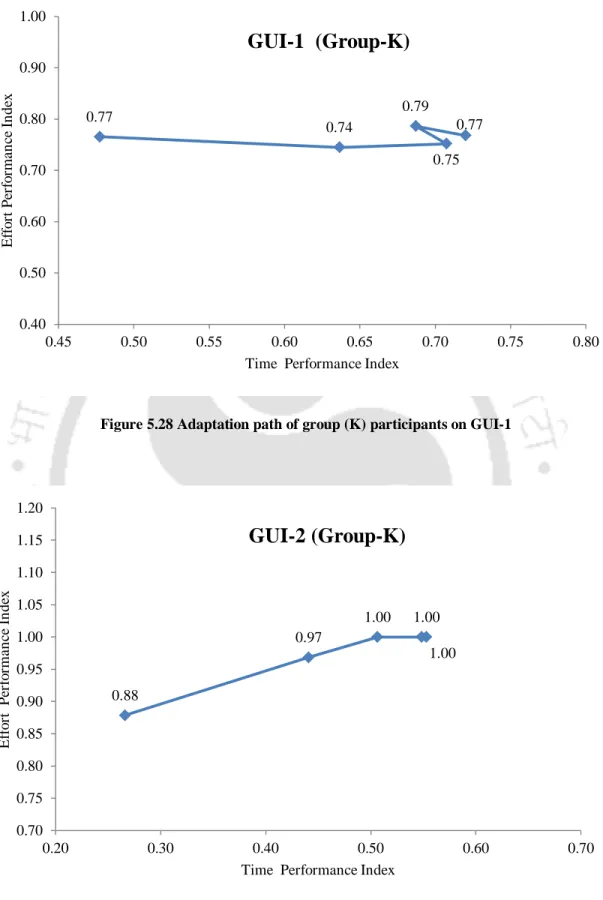
Tracing User’s Adaptation Path
We can conclude that the power law of practice can be used to model the measure of user adaptability. Therefore, the user adaptability score proves to be an integrated measure, reflecting the adaptability or level of experience. We also observe that GUI-2 users reach the level of accuracy (Pc) of the expert user, but take longer.
Therefore, by tracing the adaptation paths, we can determine to what degree the user has adapted to these two dimensions.
Conclusions
This reflects the complexity of the interface in terms of the density of interactive elements, which increases the response time. Two learning interface designs were compared based on user adaptability scores and learning curve equations. The next chapter will provide explanations of results obtained from the data analysis in Chapters 4 and 5.
Discussions and Conclusions
Introduction
In this research, we investigated the effects of varying user interface designs and task complexity in e-learning on student adaptation rates. It was found that, the complexity of the learning task had a significant effect on user adaptations in navigational behavior, learning efficiency and task adaptations (hypothesis H1). The empirical results obtained showed that in the horizontal hierarchical menu (GUI-1) user adaptability is influenced by the complexity of the learning task (hypothesis H2), which was not found in the hierarchical interface of the poured menu.
The effect of navigation patterns on user adaptability was found to be mediated by learning task complexity.
Discussions
- Effect of Navigation Design
- Effect of Learning Task Complexity
- Role of Task Adaptations
- User Adaptivity and Interface Design
- Guidelines for E-learning Navigation Design
Participants experienced higher perceived task load (PTLD) of learning on GUI-1 compared to GUI-2 in knowledge-oriented learning. For hierarchical horizontal menu (GUI-1) as well as non-hierarchical split menu (GUI- 2), the page assignments were significantly higher for knowledge-oriented learning compared to others. Thus, the difference in page assignments is seen more for comprehension and application oriented learning.
Finally, the total operations performed on GUI-1 and GUI-2 are significantly lower for application-oriented learning compared to the other groups.
Summary of Contributions
The effectiveness of the interaction of navigation plans will be important in situations of greater demands on pages of learning tasks, such as knowledge-oriented learning. If students' routine tasks involve extensive analysis or application of concepts, the effectiveness of the interaction will not be significant. Use multiple levels in navigation design to improve the surface processing efficiency required in knowledge- and comprehension-based learning.
Use multiple views of learning content to improve deep processing efficiency to build a germane load in application-oriented learning.
Limitations of the Research and Scope of Future Work
In Proceedings of the 17th Workshop on Adaptivity and User Modeling in Interactive Systems, Darmstadt, Germany (pp. 6-11). In Proceedings of the 13th international World Wide Web Conference on Alternative Tracks Papers and Posters (pp. 264-265). An analysis of the technology acceptance model to understand university students' behavioral intention to use e-learning.
In Proceedings of the 31st Annual ACM SIGIR International Conference on Research and Development in Information Retrieval (pp. 147-154).