The thesis focuses on the isolation and characterization of microalgae resistant to high CO2 values and temperature, capable of sequestering CO2 from flue gases, and the subsequent cultivation of microalgae in an open system and laboratory photobioreactor for improved CO2 sequestration. The maximum biomass productivity and CO2 fixation rate of SA1 at CO2 concentration was higher than most. ii relevant studies.
P AGETABLE
P AGE
Variation of (a) total inorganic carbon (TIC) concentration and (b) total organic carbon (TOC) concentration in culture medium at different light intensities with incubation time.
T HESIS O UTLINE
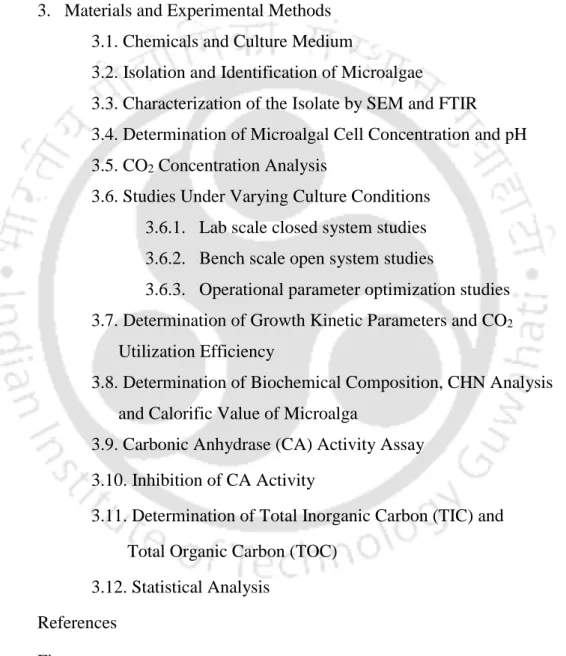
Literature Review and Objectives Chapter III: Materials and Experimental Methods
Conclusion and Future Scope
Introduction
Literature Review and Objectives
Materials and Experimental Methods
Results and Discussions
SA1 tolerated 40 °C temperature and CO2 concentration as evidenced by lab scale closed system studies. The optimized conditions obtained in the closed laboratory-scale system were used in subsequent studies.
C HAPTER I
I NTRODUCTION
- Introduction
- Microalgae as Agents of CO 2 Sequestration
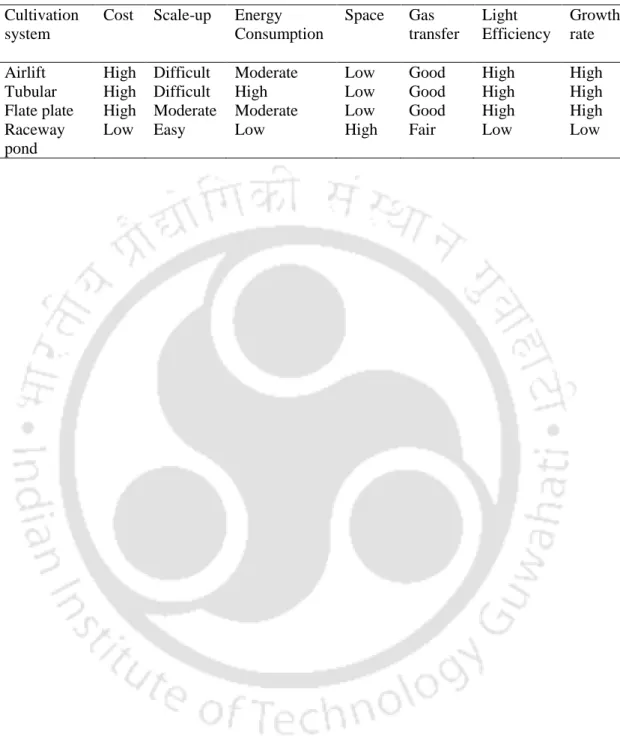
- Microalgae Cultivation Systems
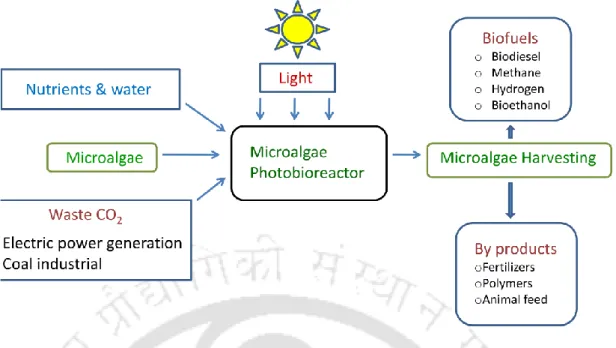
- Downstream Biomass Applications
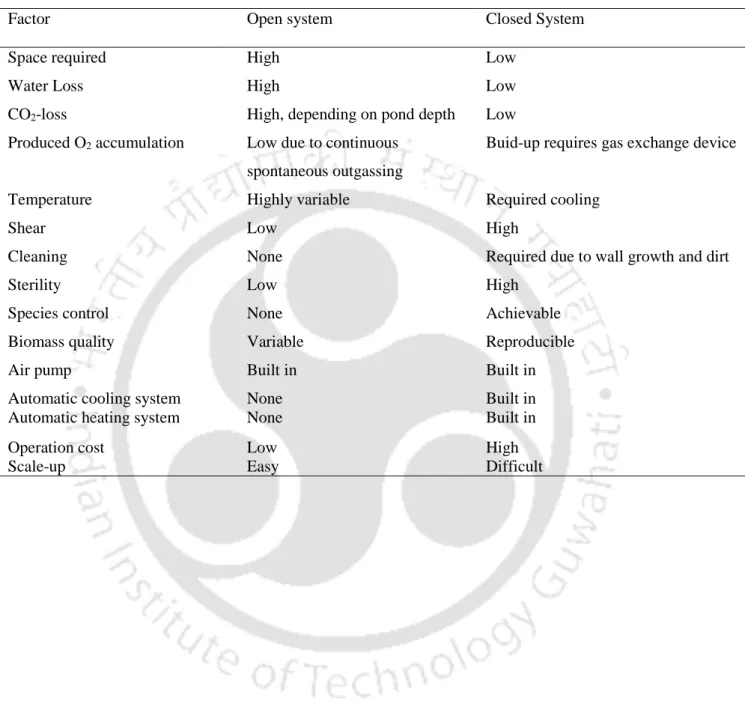
Most bioenergy studies dealing with microalgae have focused on biodiesel production (Kumar et al., 2010). A brief comparison of open and closed systems for the cultivation of microalgae (Harun etal., 2010; Ho et al., 2011).
C HAPTER II
Literature Review
- Effects of Physico-Chemical Parameters on Microalgal Biomass Production 1. Effects of CO 2 concentration
- Effects of temperature
- Effects of nutrients
- Effects of light
- Effects of pH
- CO 2 Sequestration from Flue Gas Using Different Microalgal Species
- Mixing and Aeration of CO 2 into the Cultivation Medium
- Biomass Recovery
- Objectives of the Present Work
The CO2 removal efficiency of a given system depends on the culture technique, microalgae strain, cell density, light intensity, temperature and CO2 concentration in the air stream (Farrelly et al., 2013). Phosphorus is the element required for photosynthesis, metabolism, formation of DNA, ATP and cell membrane (Cheah et al., 2015). However, successful cultivation of microalgae for CO2 sequestration requires a suitable nutrient profile of wastewater (Cheah et al., 2015).
However, above 13,000 lux, the CO2 removal ratio decreased due to inhibition of microalgae photosynthesis (Li et al., 2011). Inappropriate hours of light to hours of darkness can lead to unwanted photoperiodic effects (Razzak et al., 2013). In most cases, freshwater eukaryotic algae prefer acidic environments (pH 5-7), while cyanobacteria prefer alkaline environments (pH 7-9) (Razzak et al., 2013).
Harvesting allows microalgae to be dried and further processed to obtain desired products (Razzak et al., 2013). The most common harvesting processes are flocculation, sedimentation, centrifugation, flotation and filtration (Kumar et al., 2010). Some of the flocculants commonly used are aluminum sulfate, ferric chloride, and iron sulfate (Harun et al., 2010).
C HAPTER III
M ETHODS
- Chemicals and Culture Medium
- Isolation and Identification of Microalgae
- Characterization of the Isolate by SEM and FTIR
- Determination of Microalgal Cell Concentration and pH
- CO 2 Concentration Analysis
- Studies under Varying Culture Conditions
- Bench scale open system studies
- Operational parameter optimization studies
- Determination of Growth Kinetic Parameters and CO 2 utilization Efficiency Time-course profile of the biomass concentration (X; g L −1 ) was used to
- Carbonic Anhydrase (CA) Activity Assay
- Determination of Total Inorganic Carbon (TIC) and Total Organic Carbon (TOC)
- Statistical Analysis
Average light intensity maintained on the surface of the Erlenmeyer flask was 5496 lux using a digital light meter (model LX-101A, Lutron, Taiwan). The cell concentration of the culture in the Erlenmeyer flask was determined regularly by measuring optical density at wavelength 685 nm (OD685) using UV/Vis spectrophotometer (model Evolution 201, Thermo Scientific, USA). The amount of CO2 removed was determined from samples taken from the inlet and outlet gas phase of the system.
The culture was subjected to varying concentrations of CO2 supply, ranging from 15% to 35% and the growth of the organism was periodically monitored. The cultures were incubated at 25 ± 1°C and illuminated with daylight-type 20 W fluorescent tubes with a light intensity of 6000 lux maintained on the surface of the culture vessels using a Digital Light Meter (model LX-101A, Lutron , Taiwan). The light intensity on the surface of the PBR was measured with a Digital Light Meter (model LX-101A, Lutron, Taiwan).
Determination of growth kinetic parameters and CO2 utilization Efficiency Time course profile of the biomass concentration (X; g L−1) was used to The time course profile of the biomass concentration (X; g L−1) was used to calculate the maximum specific growth rate (µmax, d−1 ). After a new centrifugation step, the absorbance of the supernatant was measured in the UV/Vis spectrophotometer (Cuaresma et al., 2011). TOC analysis of the supernatant was performed in TOC analyzer (Model No. 1030, O-I-Analytical, Aurora, USA).
C HAPTER IV
Isolation of the Microalgae
The phylogenetic tree (Fig. 4.1.) indicated that strain SA1 fell within the evolutionary radiation occupied by the genus Scenedesmus and was closely related to S.
SEM and FTIR Analysis
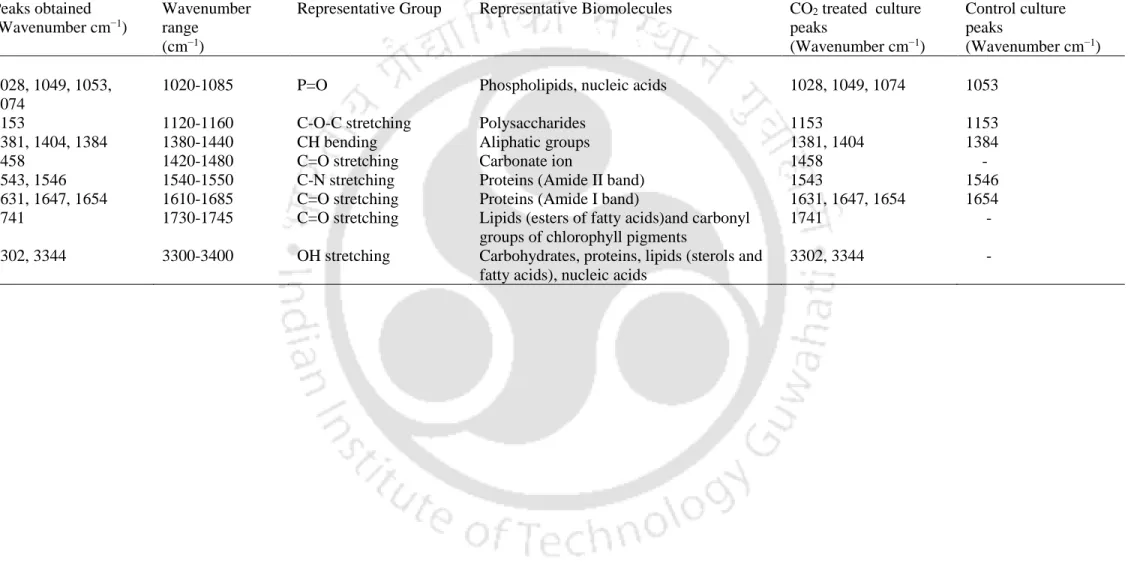
The peaks at ~1543 cm−1 and 1546 cm−1 were obtained in the case of CO2-treated SA1 and control, respectively, which were attributed to C–N stretching of proteins (amide II). A peak of particular interest at 1458 cm−1, corresponding to C=O stretching of carbonate ions, was observed in the case of the CO2-treated culture indicating only that HCO3−. The peak at 1153 cm−1 obtained for both the CO2-treated and control cultures was associated with C–O–C stretching of polysaccharides.
Peaks between 1020-1085 cm-1 for both cultures were attributed to P=O of phosphodiester groups of nucleic acids and phospholipids.
Lab Scale Closed System Studies 1. Evaluation of cell biomass v/s pH
- Analysis of CO 2 concentration
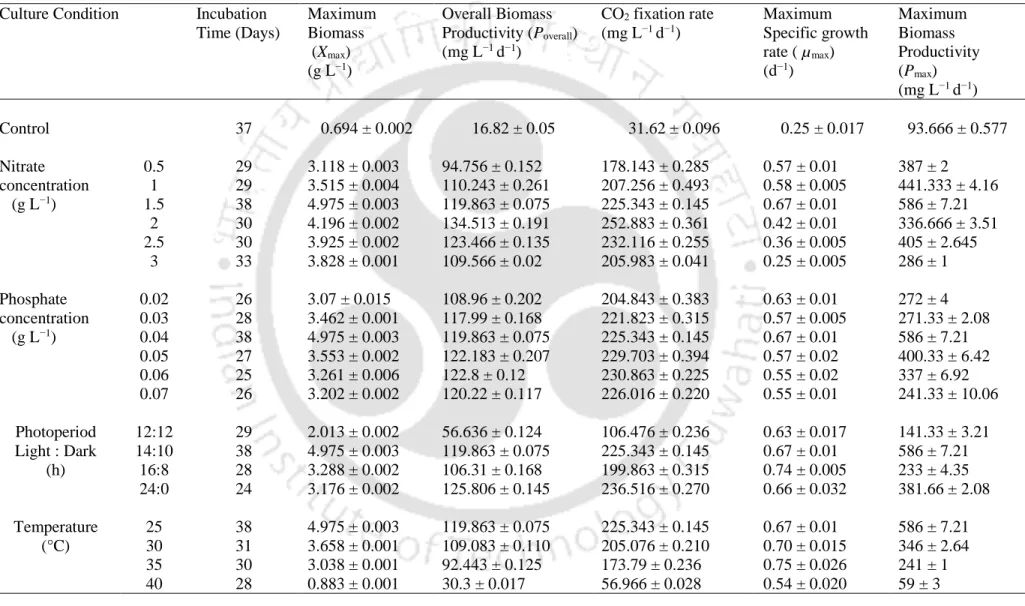
- Effect of varying culture conditions on the growth kinetic parameters of SA1
- Biochemical composition and CHN analysis
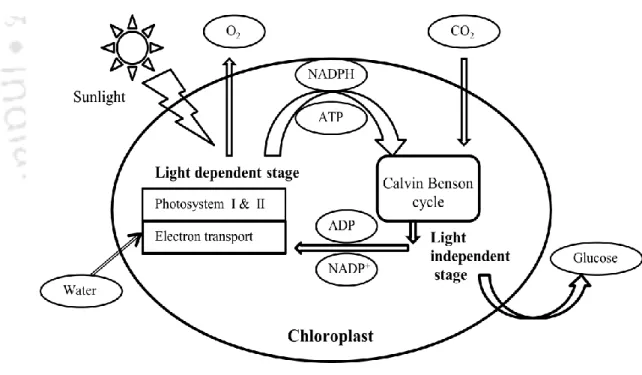
In addition to Ci transporters in the cell membrane, eukaryotic algae also possess inorganic carbon (Ci) transporters in the chloroplast, since photosynthesis takes place in the chloroplast. The increased CO2 concentration in the thylakoid lumen then diffuses through pyrenoid tubules in the thylakoid membrane to the pyrenoid matrix, where it is fixed by ribulose-1,5-bisphosphate carboxylase oxygenase (RuBisCo) in the Calvin cycle, converting it to organic carbon . (Chi et al., 2011). The average CO2 concentration in the inlet gas stream was during the experimental period, as determined by GC (Fig. 4.5.a).
Light regimes to which crops are subjected are considered to be an important factor in the productivity and yield of photosynthetic reactions (Jacob-Lopes et al., 2009). Photosynthesis is a process that involves two steps, light reactions that occur only when cells are illuminated and carbon fixation reactions, also known as dark reactions, that occur both in the presence and absence of light (Iverson, 2006). Strain SA1 was gradually subjected to higher temperatures in the presence of CO2 (Fig. 4.6.d) to study the effect of increasing temperatures on the kinetic parameters of growth.
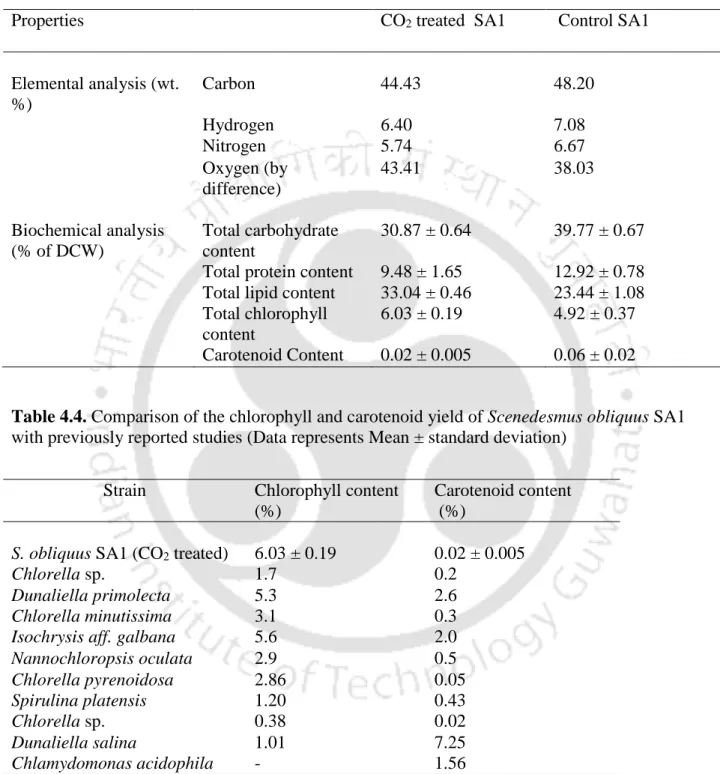
Although the carbohydrate and protein content of the CO2-treated SA1 strain was lower by 23% and 26% compared to the control, the lipid content and total chlorophyll content showed an increase of 30% and 18%. The carbohydrate content obtained for the SA1 strain after the CO2 fixation was also high enough to make CO2. Thus, SA1 strain may prove to be a suitable candidate for biodiesel production due to the high lipid content.
Inoculum Size Optimization
Bench Scale Open System Studies
- Effect of varying CO 2 concentration on biochemical properties of SA1 The use of microalgae with high CO 2 concentration tolerance, fast growth
- Effect of varying CO 2 concentration on total CA activity
- Effect of inhibitors on CA activity
The culture depth was varied at 15% CO2 concentration (typical CO2 flue gas concentration) in the open system from 0.0425 m to 0.17 m. Our result corresponded with the study of Chiang et al. 2011) who reported an increase in chlorophyll content in the cyanobacteria Anabaena sp. A pH gradient is established across the thylakoid membranes of the chloroplast in the presence of light.
Under these conditions, HCO3− is the predominant species of inorganic carbon (Ci) in the chloroplast stroma, while CO2 is the most abundant form of Ci in the thylakoid lumen. HCO3− transported into the acidic thylakoid lumen is rapidly converted to CO2 by CA present in the thylakoid lumen, raising the CO2 concentration above ambient levels, and these CO2 molecules are then fixed by RuBisCo located in the pyrenoid for further formation of the organic compounds . The production and concentration of CO2 in the acidic thylakoid lumen and then fixation of these CO2 molecules using RuBisCo increases the rate of photosynthesis.
Multiple isoforms of CA may exist, which are localized in the periplasmic space, cytosol, chloroplast stroma, and thylakoid lumen depending on the microalgal species that function in the CCM (Ghoshal et al., 2002). The CA activity in the control culture receiving ambient CO2 was higher than the CA activities for 15% and 35%. Our result was consistent with these reports as CA activity in the control culture was much higher than the CO2-treated cultures except on days 15 and 17.
Operational Parameter Optimization Studies
- Effect of varying operational parameters on growth kinetic parameters of SA1
- Periodic variations of CO 2 fixation rate and CO 2 utilization efficiency in SA1
- Analysis of TIC and TOC in cultivation media
Continuous gas irrigation in the cultivation media in the open cultivation system leads to significant diffusion and escape of CO2 to the atmosphere and thus less amount of CO2 is utilized by microalgae. SA1 showed an increase in all the growth kinetic parameters with an increase in the duration of CO2 spraying. Maximum CO2 utilization efficiency value of 10.23% in the open tillage system under 15% inlet CO2 concentration was 3.96 times higher than the value (2.58%) reported by De Morais and Costa (2007a) who cultivated S.
TIC values in the culture medium increased as the incubation time progressed in all three different light intensity studies up to day 12 of incubation (Fig. 4.14.a). Due to the continuous supply of CO2, the TIC values in the media increased until day 12, after which the value decreased as a result of the increased uptake of CO2 by the microalgae. An increased biomass concentration of microalgae at a light intensity of 4351 lux could have led to increased respiration, leading to an increased TIC value in the culture media.
The biomass concentration obtained at 2445 lux was also lower than that obtained at 2735 lux, leading to increased TIC levels in the cultivation media at 2735 lux. The TOC values in the cultivation media also showed increasing trends with increase in light intensity values. Variation of growth kinetic parameters of Scenedesmus obliquus SA1 in the laboratory scale closed system studies (Data represent Mean ± standard deviation).
Biochemical properties of Scenedesmus obliquus SA1 obtained in laboratory-scale closed system studies (data represent mean ± standard deviation). Biochemical properties of Scenedesmus obliquus SA1 obtained in bench-scale open system studies (data represent mean ± standard deviation).
C HAPTER V
Conclusions
However, the peak at 1741cm−1 obtained in the case of SA1 treated with CO2 is attributed to C=O stretching of lipids (fatty acid esters) and carbonyl groups of chlorophyll pigments. This peak was not observed in the control case, which indicated that lipid and pigment accumulation in the present microalgae strain was facilitated by CO2 supply. Strain SA1 was found to completely fix CO2 supplied with organic carbon in laboratory-scale closed system studies as the inlet CO2 concentration was reduced to 0.5% after 14 days of incubation, as evidenced by gas chromatography analysis of the streams of inlet and outlet gas.
Also, the lipid and chlorophyll content of the CO2-treated SA1 strain was respectively 1.41 and 1.23 times higher than that of the control culture which is consistent with the data obtained in FTIR. SA1 strain was grown in a bench scale open system at varying CO2 levels ranging from 0.03-35% (v∕v) and then the carbonic anhydrase (CA) activity and the biochemical properties were monitored. Since the SA1 strain showed increased growth rates and biomass productivities under CO2 concentrations ranging from 15% to 35%.
Since extracellular (periplasmic) CA functions to accelerate the equilibration of CO2 and bicarbonate in alkaline medium so that CO2 is formed, it appears that the SA1 strain possessing an extracellular CA activity of E.U./mg chla, CO2 as the preferred species of inorganic carbon of the medium. Total inorganic carbon and total organic carbon concentration of the cultivation medium were monitored with time which showed increasing trends with increase in biomass concentration. The residence time of CO2 in the cultivation medium can therefore be maximized by adopting the aforementioned operational conditions.
L IST OF PUBLICATIONS