동해생태계의 장기적 변화를 예측하기 위한 시범연구. 동해남부 표층수온을 이용한 용승변화 분석. 동해남부 해안 용승 전망 분석.
이산화탄소와 수온 증가가 식물성 플랑크톤 군집에 미치는 영향 분석. 수온 및 이산화탄소 농도 상승에 대한 박테리아 및 원생 동물 군집의 반응. 이산화탄소 분포와 탄산칼슘 포화도.
CO2 농도 지역 수온과 CO2 농도는 . 이산화탄소의 분포와 탄산칼슘의 포화도 6.
SUMMARY
Title
- Objectives of the study
- Necessities of the study
- Research period
- Contents and scopes of the study
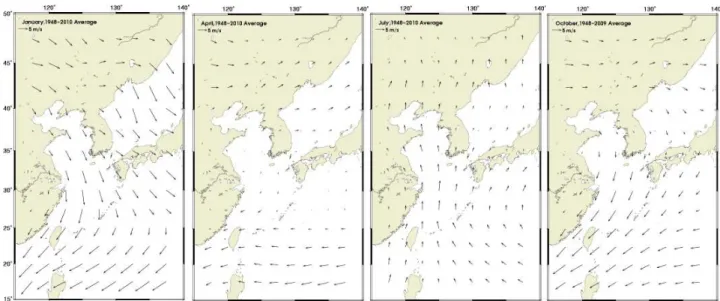
- Long term trend of coastal upwelling along the southeastern coast of Korea
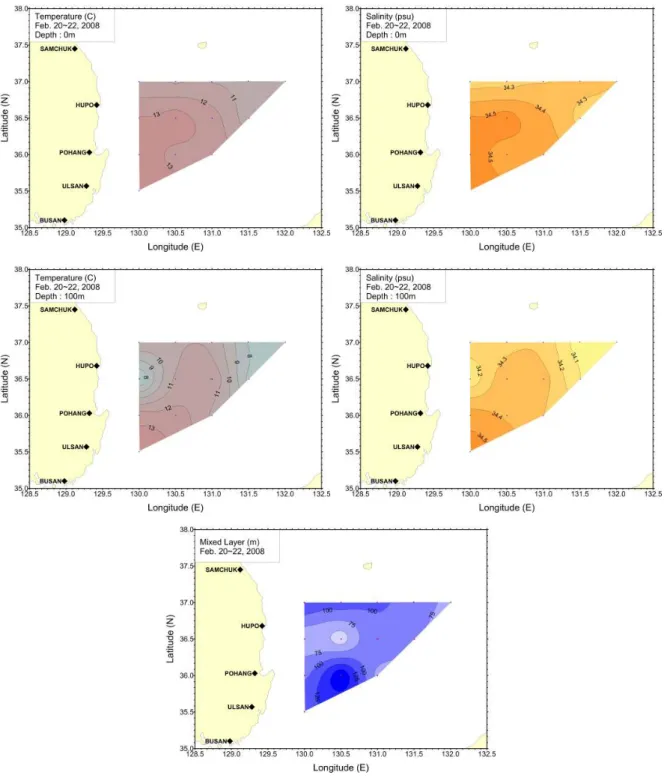
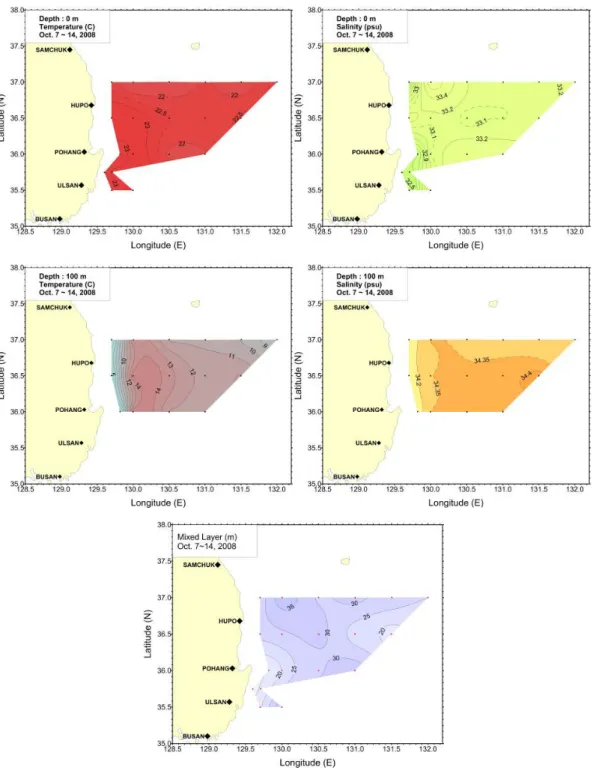
- Projected future changes in the mixed layer depth in the East Sea A. The mixed layer in the East Sea was projected to shoal in most regions
- Phytoplankton A. Field survey
- Bacteria and protozoa A. Field study
- Meso-zooplankton
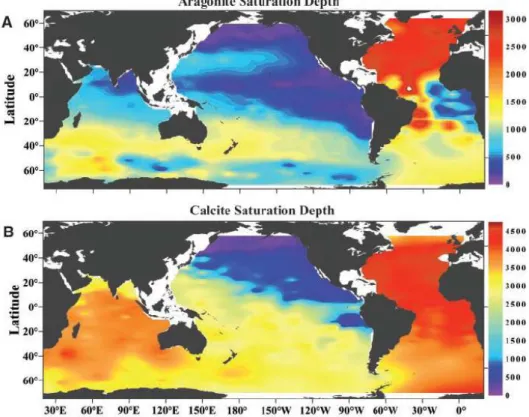
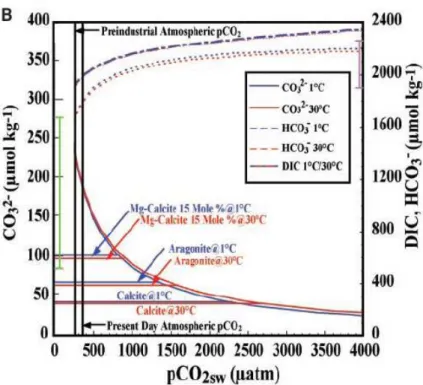
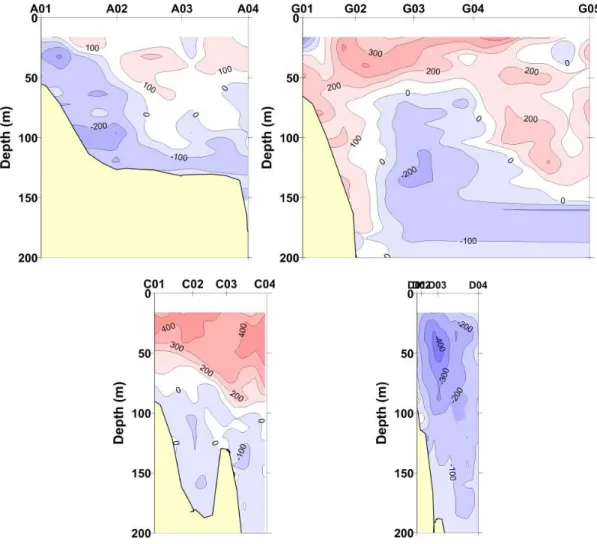
- Distribution of surface f CO 2 and degree of saturation of CaCO 3
Analysis of mixed changes in mixed layer depth in the East Sea predicted by CGCM. However, we could find that the relatively lower chlorophyll a in the elevated CO2 samples, the greater abundance of diatoms and cyanobacteria at elevated temperature and CO2. In experiment II (i.e. and 800–2700 ppm CO2 concentration; elevated CO2 concentration only; elevated temperature and CO2 concentration), EPR, hatching success and survival rate of the adult female were not significantly different among the three treatments.
In Experiment III (i.e. CO2 concentration of 350 ppm/750 ppm; elevated temperature only; elevated CO2 concentration only; both temperature and CO2 concentration elevated: greenhouse treatment), the EPR and survival rate of adult women did not differ between the four treatments with >90% of the survival rate. However, hatching success was only significantly decreased in the elevated temperature group than in the control group, and hatching success was more significantly reduced in both the elevated temperature and CO2 (greenhouse treatment) than in the control group. In the coastal area of the Baltic Sea, both aragonite and calcite were fully saturated in the upper 200 meters.
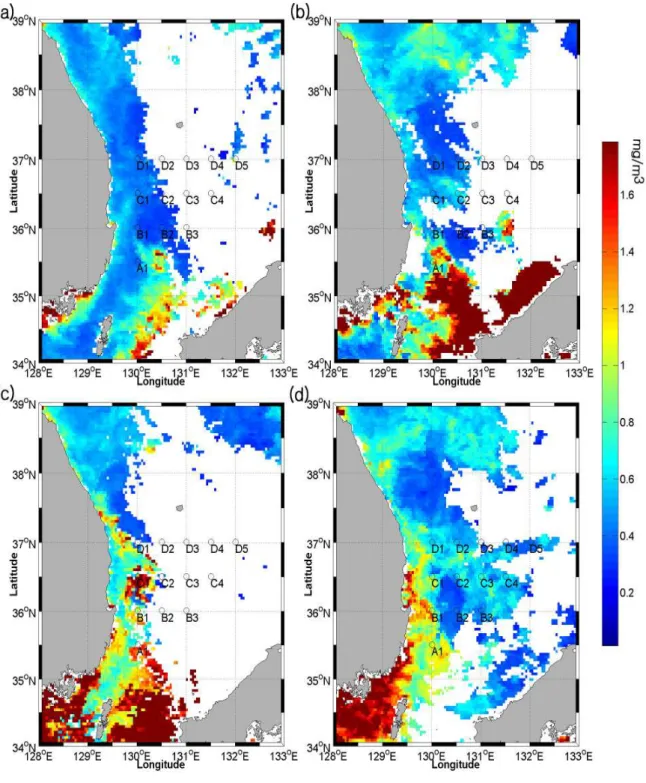
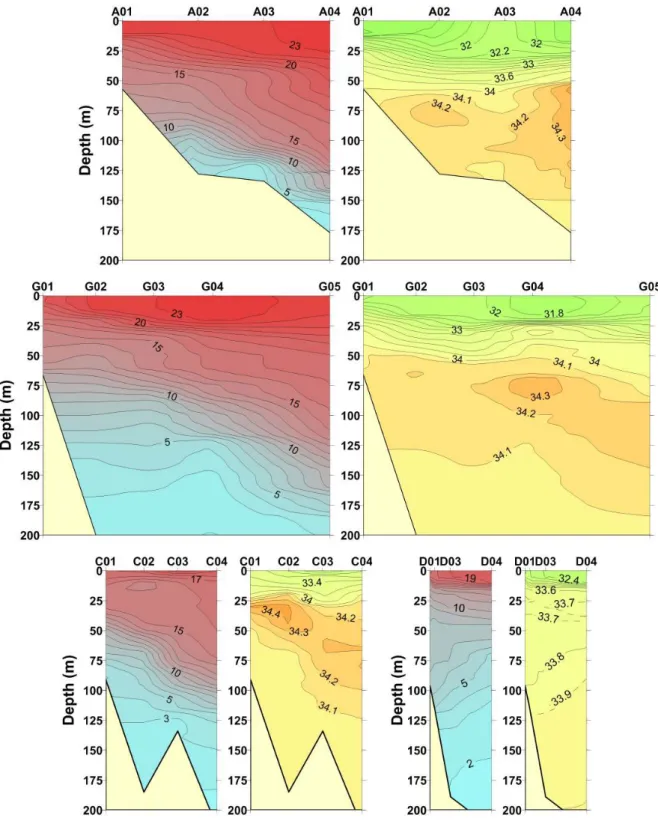
Understanding the effects of coastal growth on phytoplankton distribution and primary production can be applied to estimate annual primary production using satellite and physical model data and thereby manage living resources in the Eastern Sea. Changes in carbon chemistry and processes in the Ulleung basin can be assessed from the results of this study; surface fCO2 distributions.
CONTENTS
States of technical development in the home and foreign
Achievements of objectives and contributions to the related area
- 기술적 측면
지구 환경 변화는 현재 진행 중이며 해양 생태계에 광범위한 영향을 미칠 수 있습니다. 기후변화로 인해 해양수온이 상승하고 있으며, 특히 과거 우리나라 연안해역의 표층수온이 상승한 바 있다. 변동과 관련하여, 바람 변화로 인해 용승의 빈도와 강도가 장기적으로 어떻게 변할지 예측하는 기술이 필요합니다.
건강한 유기체의 반응에 대한 연구의 필요성이 대두됨에 따라 향후 표준화 계획을 검토, 검토하여 국내에서도 해수 산성화에 대한 해양생물의 반응을 모니터링하고 있습니다. 선진국에서는 기후협약을 통해 이산화탄소 배출을 규제하려고 노력하고 있습니다. 국가 경제에 직·간접적으로 영향을 미치기 때문에, 해수 산성화에 따른 해양생물의 변화에 대한 연구는 궁극적으로 국가 산업에 기여할 수 있습니다.
지구 온난화 등 기후변화에 대한 사람들의 관심이 높아지고 있는 상황에서, 기후변화로 인한 생태계의 장기적인 변화에 대한 체계적인 연구가 필요합니다. 지구 온난화로 예상되는 해양생태계의 장기적인 변화를 예측하는 다양한 기술.
획득
이산화탄소 농도가 증가함에 따라 바닷물의 산성도가 증가합니다. 울릉분지 해양 산성화 경향 규명. 지구 기후변화 예측 모델의 결과.
그러나 식물성 플랑크톤 중우주의 이산화탄소 농도가 증가합니다. 그리고 바다에서의 추정된 1차 생산량. 부산의 월평균 상승지수를 나타냅니다.
두 번째 관찰에서는 해안으로 더 축소된 것으로 나타났습니다. 수온이 낮은 것은 발트해 남부 해안에서 여름철에 발생하는 연안 용승에 따른 것으로 추정됩니다. 바닷물의 CO2 농도는 에서 증가할 것으로 예상됩니다.
2 a 수온 증가에 따른 대조군과 실험군의 농도. 3차 실험기간에는 이산화탄소 농도의 변화가 대조군에서는 큰 변화를 보이지 않았으나, 이산화탄소 증가 실험군에서는 지속적으로 감소하였으나, 식물플랑크톤의 바이오매스가 감소한 시점부터 약간 증가하였다(도 2). 3.4.2.9).
8일차 온실 밭의 두 번째 피크는 높은 이산화탄소 농도로 인해 발생했습니다. 보다 현실적인 이산화탄소 농도를 이용한 생물반응 실험이 필요해졌습니다. 아산만에서 채집된 요각류의 CO2 증가에 대하여
아산만에서 채집된 요각류의 이산화탄소 증가일(T)에 이산화탄소 농도만 증가한 경우 상대적으로 감소하는 경향을 보였다(Fig. 20일 아산만에서 채집된 요각류의 CO2).
이 v.와 함께 예제 프로젝트가 설명되었습니다.