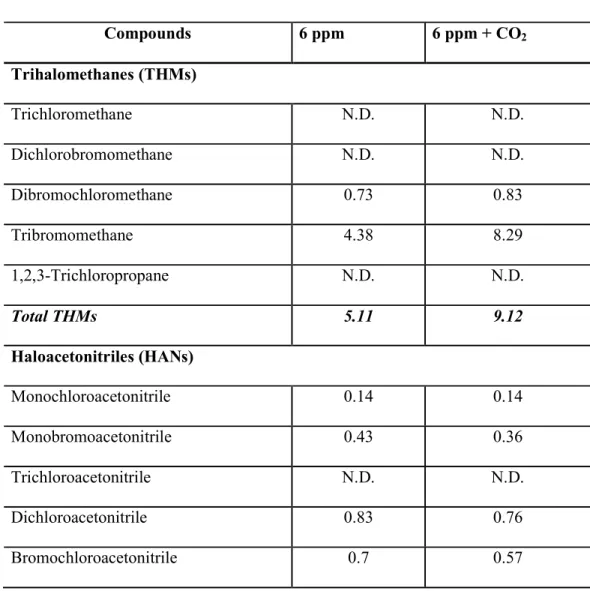
그러나 에너지 소비와 과도한 부산물 발생이 문제가 되고 있다(저자 서신). DBS 분석은 식염수 조건 하에서 0일에만 수행되었습니다. DBP의 트리할로메탄(THM)과 할로아세트산(HAA)의 총 농도는 기수 조건에서 단지 6ppm으로 처리한 물보다 6ppm + CO2로 처리한 물에서 더 높았습니다. 이것보다 2~3배 정도 더 많이 발견됐다.
기획연구의 필요성
특히, 향후 선박 배출가스에 대한 CO2 포집 활용도 고려되어야 할 것으로 보인다. 이 경우 배기가스는 이산화탄소이며, 선상 CCS가 현실화된다면 이에 대한 활용 기술 개발이 필요하다. 탄소 포집에 대한 합의를 구축합니다.
이는 궁극적으로 CO2 배출 저감에 기여할 것으로 기대된다. 현재 (주)테크크로스는 이를 수락하고 있습니다. 기존 처리 방식을 개정하고 차세대 처리 장비를 개발하는 정부과제(내부 보안으로 인해 데이터 접근이 불가능함) 선박폐수는 전기분해를 통해 처리할 수 있으므로(Kim and Gil 2007), 포집된 이산화탄소를 활용하면 하수처리 효율이 높아질 것으로 기대된다.
기획연구의 목표 및 내용
포집된 이산화탄소에 대한 기술개발 동향 및 환경분석. 포집된 이산화탄소의 선상 이용 분야의 최첨단 분석 방법론입니다. 연도별/국가별 특허 출원 동향] [국내외 주요 출원인의 기술 개발 동향 분석].
IP 장벽 결정을 통한 알려진 기술의 연구 활용 분석]. 특허동향 조사자료를 활용한 유망기술 발굴 사례]. 통합기술 흐름에 따른 특허 동향 조사].
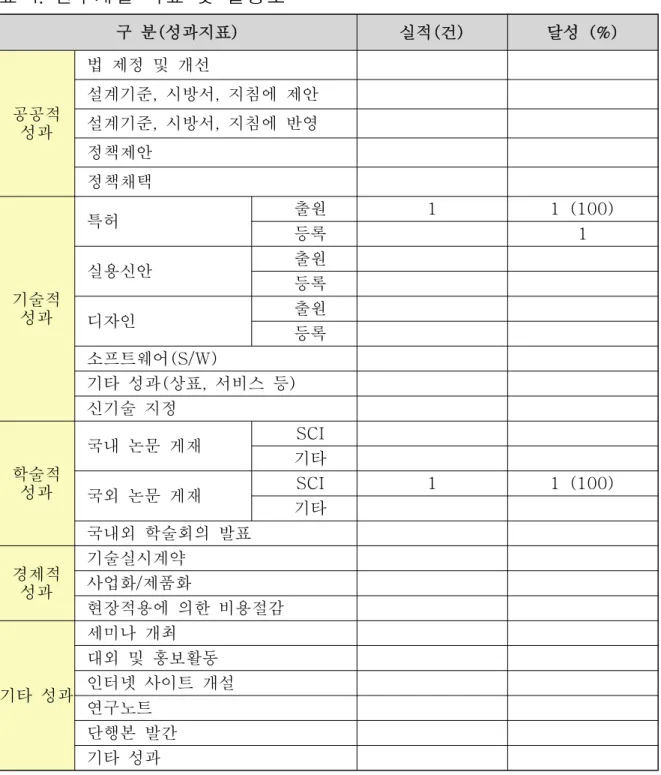
아니요. 연구내용 세부 추진계획 및 방법. R&D 성과평가를 위한 정량적, 정성적 성과지표와 평가방법을 제시합니다. 성명 연구과제명 연구기관 참여시작 참여개월수.
과학자 및 기술자 수 부서명/과제명 참여형태 참여 종료 연구개발비(백만 원) 도서 국제해사정책, 법률국가정책연구 다양한 정책과제 참여. 해당 사업과 관련된 주요 연구 성과나 활동을 연대순으로 나열하세요.
참고 문헌
연구수행체계 및 연구참여진(연구조직)
USCG 2단계 시험, 평가 및 인증 시스템 구축. 한국해양과학기술진흥원. 소속 한국해양과학기술원 직위 선임연구원. 선박평형수 통합관리 기술 개발 기획 연구.
기술진흥원 남해권 PNV 홍보를 기획하고 있습니다. 살조 활동 구조 i. 해충에 대한 티아졸리딘디온 유도체 TD49. 국제 상선의 평형수에서 수집된 식물성 플랑크톤 종. 현재 참여하고 있는 국가 연구개발 프로젝트(해당되는 경우에만 완료).
연구개발비 소요 명세서
해당 연도의 연구개발에 소요된 총 지출을 요약한 것입니다. 민간연구공헌 참여기업의 기여금액(참여기업이 있는 경우에만 표시) 비용 항목별 R&D 지출에 대한 일반적인 요구 사항을 요약합니다.
시험, 분석, 검사, 임상시험, 기술정보 수집, 특허정보 검색 등 R&D 서비스 이용에 드는 비용. 출장 목적 및 이유 제4회 이산화탄소 활용 컨퍼런스 2015 연구개발사업 참여. 연구환경 유지를 위한 장비 및 소모품 구입, 유지관리 비용 등
연구성과의 등록ㆍ기탁 의향
과 제명 포집 이시시탄소의 선상활용GT. Oñeme’ẽva’erã umi resultado análisis calidad y rehegua y prueba ñepyrũrã rehegua (TSS, DOC, hamba’e) ojerureháicha umi directriz OMI G8-pegua oñentende porãve haguã umi resultado estudio rehegua. Ko’ã 3 referencia (IMO 2008 a), b) ha c)) ndoikéikuri pe lista de referencia-pe, opakuévo pe artículo.
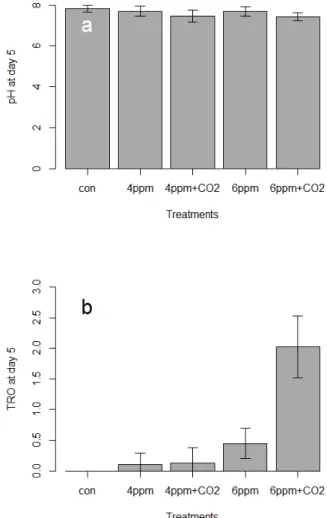
Results for treated water should be reported as "< detection limit" specifying the detection limit value of the analytical method applied. Why could CO2 reduce TRO and DBP when the study noted that: 1) TRO decay was slower with Co2 than without CO2, 2) most DBP concentrations were higher in the test water with CO2 than without CO2. The results of the study show the opposite; that most DBP concentrations were higher with CO2 than without CO2.
Introduction
Despite its advantages, ballast water electrochlorination has two major problems that need to be addressed. It would therefore be better to find an inexpensive means of achieving high efficiency in killing organisms in ballast water with relatively low TRO, while producing easily degradable disinfection by-products. An improvement in the efficiency of the electrochlorination process can lead to better and more environmentally friendly treatment of ballast water.
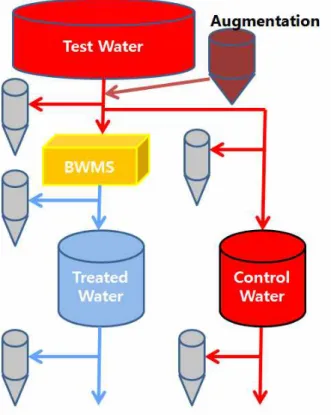
Increased CO2, and thus a decreased pH, will increase the proportion of HOCl and HOBr, which could increase the toxicity to organisms (Kim et al. 2013). In this study, we investigated the combined effects of elevated CO2 and TRO levels on the survival of plankton and heterotrophic bacteria in simulated ballast water. The study was designed to test whether injection of CO2 increases plankton death in ballast water and thus could be used for BWMS using electrochlorination.
Materials and Methods
The water bath was maintained at 28 °C with continuous air-flow ventilation during cyst development (Madhu 2009). Natural seawater was filtered through a membrane filter with a nominal pore size of 0.7 µm and autoclaved at 121 °C for 20 min and stored at 4 °C until use for phytoplankton culture. All water was filtered through a 32 µm nylon mesh screen immersed in water of the same salinity to concentrate A.
Zooplankton survival was determined based on appendage movement under a Zeiss Stemi SV11 stereomicroscope (E729 2007, E1440 2012). Each sample is stained by adding 100 µl of working solution to 3 ml of sample (final concentration: 1.7 µg ml–1 FDA). For the analysis of heterotrophic bacteria, 0.1 ml of sample water was spread with an L-shaped spreader on a Petri dish containing Zobell marine agar.
Results
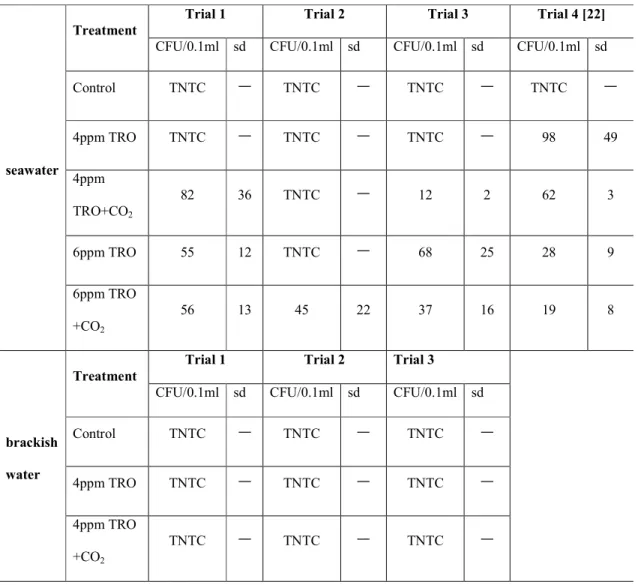
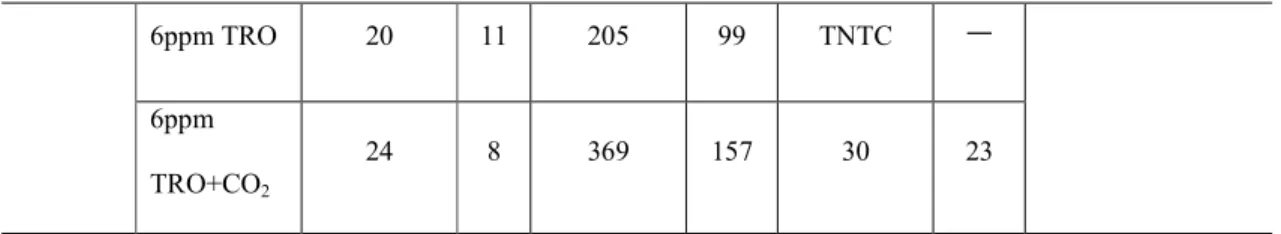
Other HAAs that increased with CO2 injection were dichloroacetic acid, trichloroacetic acid, and dibromoacetic acid. Heterotrophic bacterial colony formation (CFUs/0.1 ml) on marine agar for seawater and brackish water showed greater reduction with CO2 addition (Table 2). For Tetraselmis suecica, the synergistic effects of CO2 addition could not be confirmed as all phytoplankton were effectively killed at 4 ppm and above by TRO.
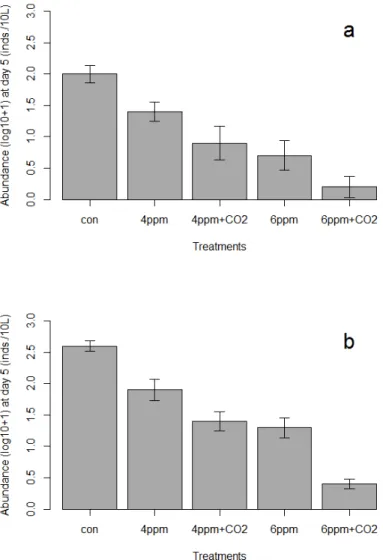
Live Artemia franciscana at the end of the experiments (day 5) for seawater (Figure 3a, n=5) and brackish water (Figure 3b, n=4) were consistently lower in the 6 ppm + CO2 treatment than in the 6 ppm without CO2 both for sea salt. A similar pattern was observed in the 4 ppm treatment, with fewer organisms surviving in CO2-supplemented water than in the 4 ppm treatment alone. Survival in the 4 ppm + CO2 treatment was comparable to survival in the 6 ppm TRO for seawater and brackish water.
Discussion
For example, the stability of haloacetonitrile decreases and their rate of hydrolysis to dihaloacetic acids increases with increasing pH and the number of halogen atoms in the molecules (Glezer et al. 1999, WHO 2000). Current density is an important parameter affecting the production of total residual chlorine oxidizers in ballast water (Lacasa et al. 2013). The TRO generation is also dependent on the concentration of electrolytes, requiring more energy to produce the same amount of TRO at lower salinity (Lacasa et al. 2013).
Low current densities can also reduce the amount of harmful chlorine species produced during disinfection (Tsolaki et al. 2010) which is currently a major concern of ballast water management systems that generate reactive substances as by-products (IMO 2012, Werschkun et al. 2014). Although TRO was higher in CO2 treated water before chlorination in the present study, the amount of initially generated TRO and related DBPs appears to be much lower than reported in other electro-chlorination BWMS studies (Delacroix et al. 2013). This can reduce the risk of accidental mixing of HCl and NaOCl and thus chlorine gas formation (Gomà et al. 2010).
Conclusion
MEPC (2014) MEPC 66/INF.2 Harmful aquatic organisms in ballast water, List of ballast water management guidelines, guidance documents and approved ballast water management systems. 2004) Disinfection byproducts (DBPs) in drinking water and predictive models for their occurrence: a review. 2012) Effects of CO2-induced pH change and salinity on the hatching rate of Artemia franciscana. 2004) Increasing atmospheric CO2 boosts phytoplankton productivity. The electrochlorination system: a unique method for preventing biofouling in seawater desalination. 2010) Electrochemical disinfection of simulated ballast water using Artemia salina as an indicator. Hazards Emerging from Ballast Water Treatment: Preparation of the International Convention on Ballast Water Management.
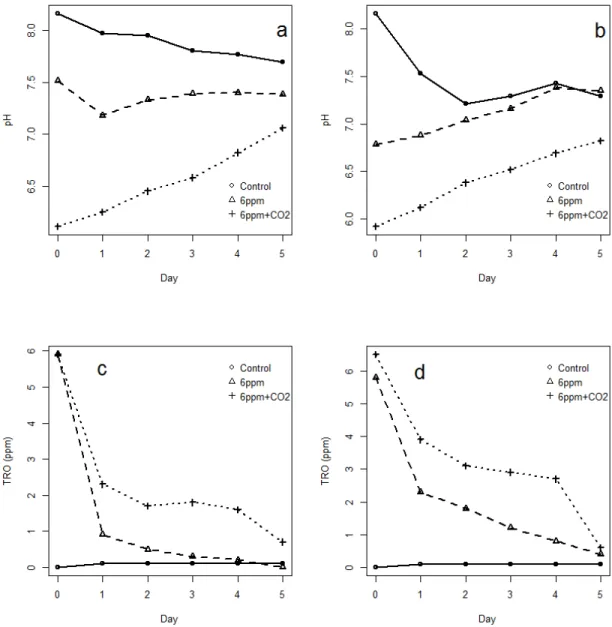
Note that the TRO concentration decreases less in the water treated with electrolysis and CO2 than in the water treated with electrolysis only. Note that the numbers living at 4 ppm TRO + CO2 are similar to the 6 ppm TRO treatment, and much fewer survive at 6 ppm TRO with CO2. Note that the TRO concentration decreases less in the water treated with electrolysis and CO2 than in the water treated with electrolysis only.