53 3.18 Recognition rates (%) of emotion classification with speech signal using EMODB database. TEO†= TEO-CB-Auto-Env, Comb = Multi-scale amplitude+HPER+Respiration+MFCC+TEO†). 54 3.19 Recognition rates (%) of emotion classification with SEVTI signal using EMODB database. TEO†= TEO-CB-Auto-Env, Comb = Multi-scale amplitude+HPER+Respiration+MFCC+TEO†).
Overview of Stressed Speech Recognition
Stressed speech recognition can be very useful for the person who works in hazardous environments (such as chemicals and explosions). Based on different articulators (jaw, lips, tongue, mouth and lips), different sounds are produced.
General Framework for Stressed Speech Recognition
Feature Extraction
Continuous features, including pitch-related features, timing features, formants, and energy-related features provide important signals of various stress conditions. Tahon and Devillers have used an acoustic feature set, extracted from pitch, energy, spectral, formant and voice quality for emotion recognition in real-world applications [22].
Feature Selection
Ghazale and Hansen have shown that the LPCC and MFCC features outperform the LPC function for stress classification [19]. Altun and Polat used four feature selection algorithms and have shown that least square bound feature selection algorithm is superior among the four [30].
Classifier
- Hidden Markov Model
- Gaussian Mixture Model
- Support Vector Machine
- Artificial Neural Network
- Extreme Learning Machine
Using a kernel function in SVM maps the data vector into a higher dimensional space where linear separation of the data vectors is possible. The main objective is to maximize the difference between two classes while minimizing the training errors ξm.
Scope of the Present Work
Organization of the Thesis
- EMODB Database
- IEMOCAP Database
- FAU AIBO Database
- OBS Database
- OBSAN Database
- URTIC
- IITG Cold Speech Database
The registered database is named Exhaled Speech Database for Active and Non-Active Categories (OBSAN). Similarly, the categories for shallow breathing and normal speech contain 216 and 504 examples recorded from physically active and physically inactive persons respectively.
Existing Method of Feature Extraction
- Continuous Features
- Voice Quality Features
- Spectral Features
- Mel Frequency Cepstral Coefficient (MFCC), Modified MFCC and Ex-
- Linear Predictor Coefficient (LPC)
- Nonlinear TEO based Features
- TEO-FM-Var
- TEO-Auto-Env
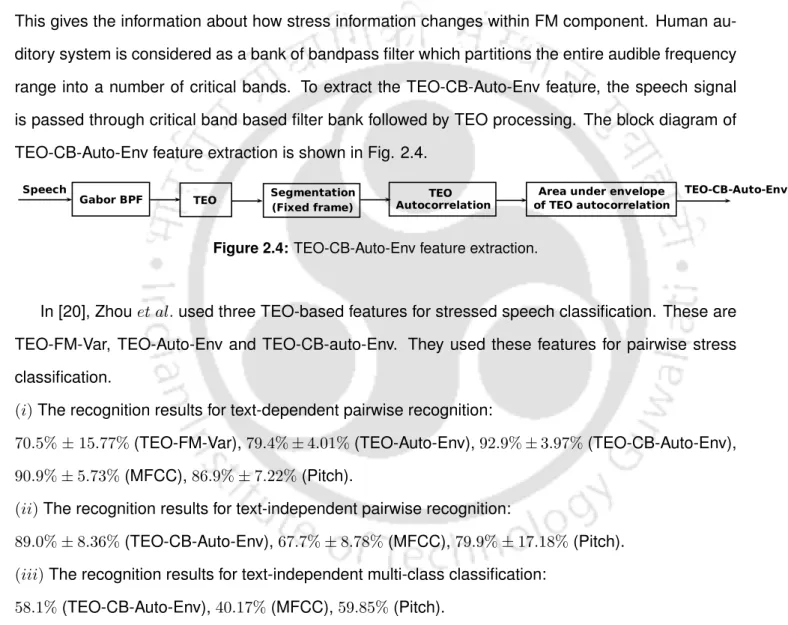
- TEO-CB-Auto-Env
- Sinusoidal Model based Features
- PH Vocal Source Feature
- Breathiness Feature
- Period Perturbation Quotient (J3)
- Amplitude Perturbation Quotient (S7)
- Harmonic-to-Noise Ratio (HNR)
- Glottal-to-Noise Excitation Ratio (GNER)
- Harmonic Energy (HE)
- Harmonic Energy of Residue (HERes)
- Harmonic-to-Signal Ratio (HSR)
These deficiencies of the prosodic features limit the efficient stress recognition from the speech signal. One possible option is to invert the speech signal, which separates excitation source information from the vocal tract.
Motivation
Proposed Feature
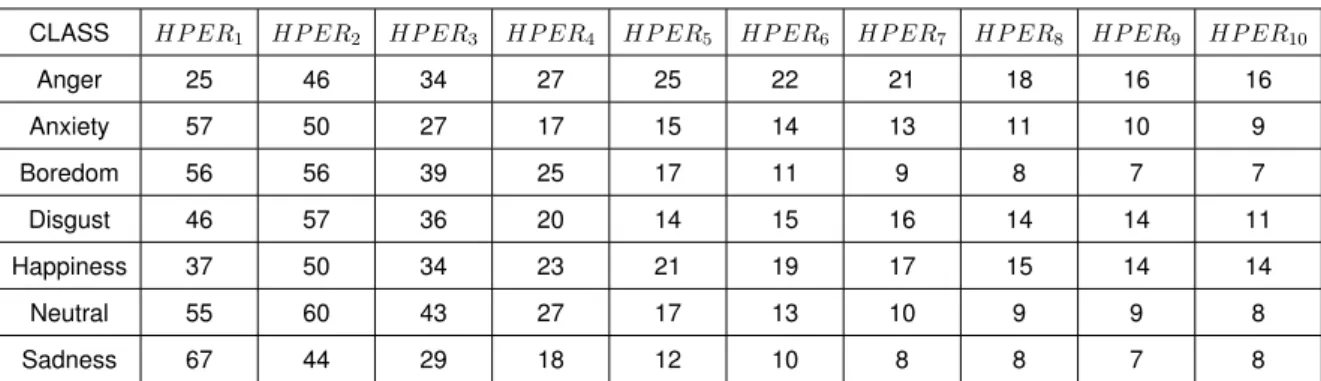
- Harmonic Peak to Energy Ratio (HPER)
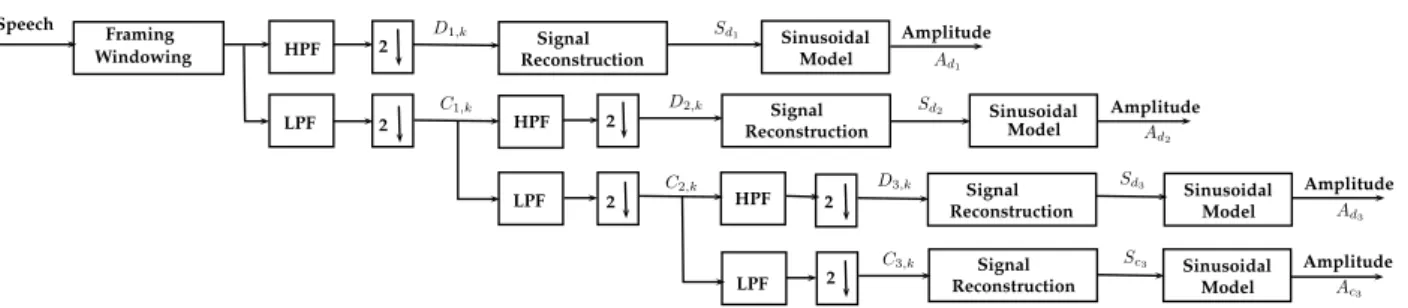
- Multi-scale Amplitude Feature
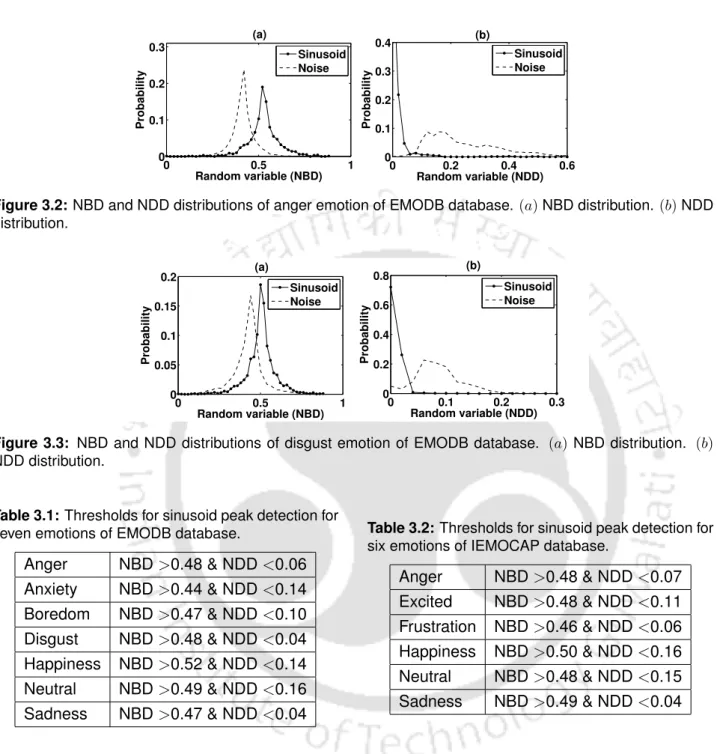
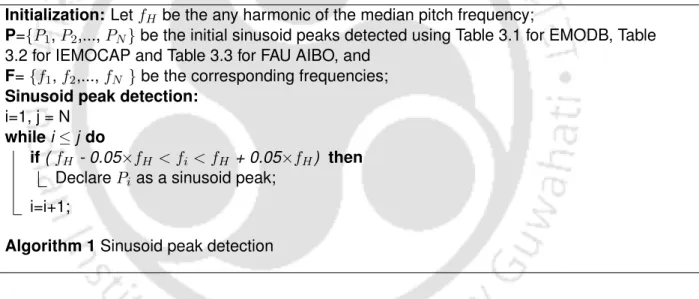
Peak harmonic energy ratio (HPER) is defined as the ratio of harmonic peaks to the total energy of the speech signal. The amplitudes of these sinusoids are calculated from the peaks of the DFT magnitude spectrum. The detection of the sinusoidal peaks from the DFT spectrum is performed by a two-level decision tree.
Evaluation of the Proposed Feature
Vocal Tract Information Enhancement
Therefore, when speech emerges from the mouth, there is an overall attenuation of 6 dB/oct as the frequency increases above about 1000 Hz [97]. A pre-emphasis filter is a high-pass filter that increases the spectrum in the high-frequency regions [107]. The maximum performance is achieved at αc = 0.94, so this value of αci is used in this work.
Statistical Analysis of the Proposed Feature
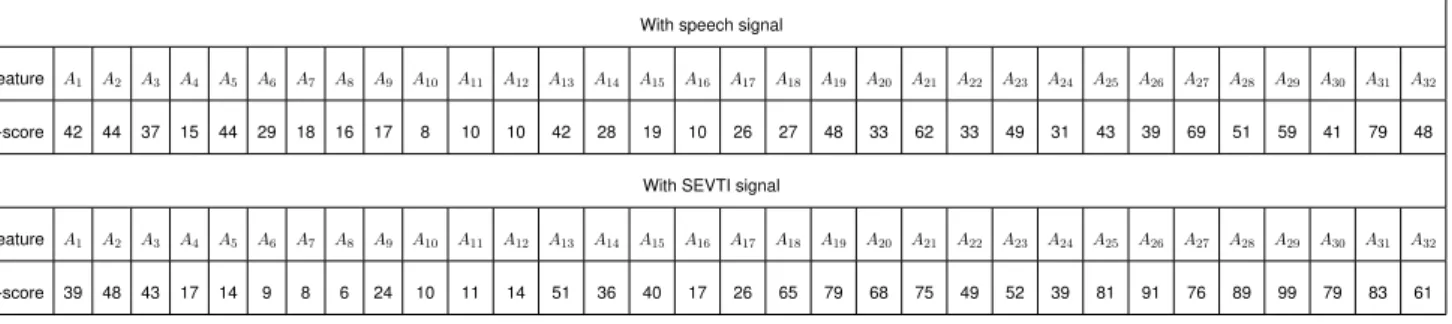
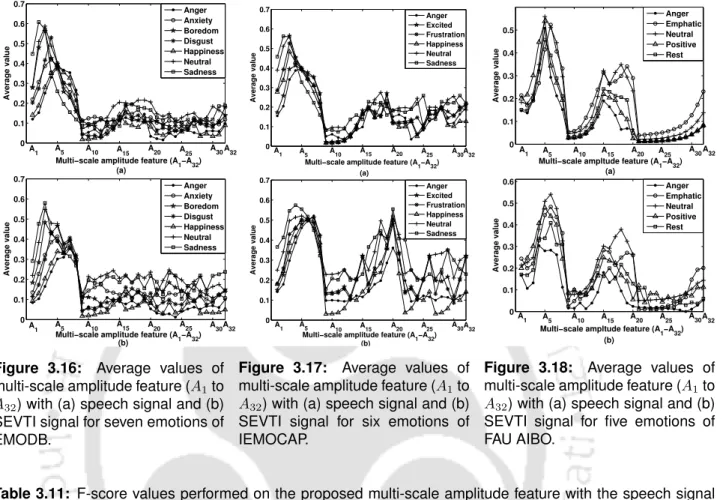
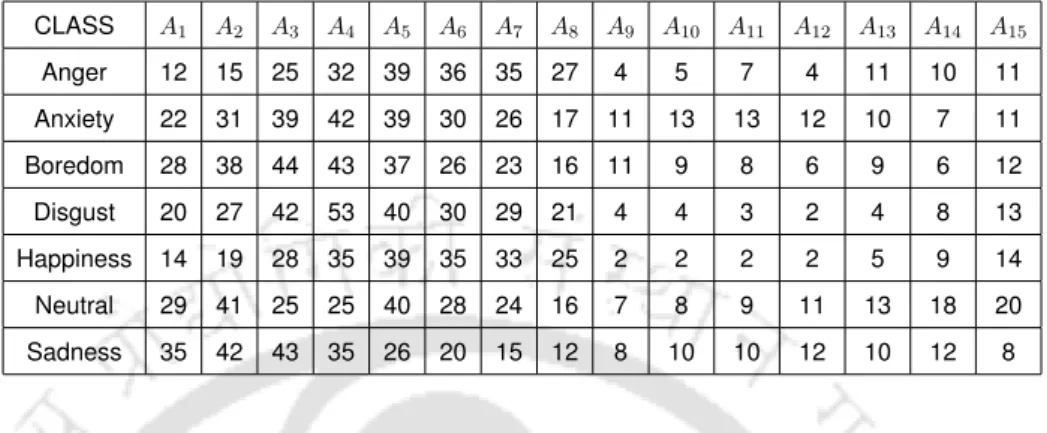
The variations of mean values of HPER feature with speech signal and SEVTI signal are shown in Fig. It is noted that the A2-A4 and A9-A32 features have higher F-score values with SEVTI signal than those obtained with the speech signal. The F-score values are higher for A2-A4 and A11-A32 features with the SEVTI signal than with the speech signal for IEMOCAP database.
Results and Discussions
- Performance Analysis using EMODB Database
- Performance Analysis using IEMOCAP Database
- Performance Analysis using FAU AIBO Database
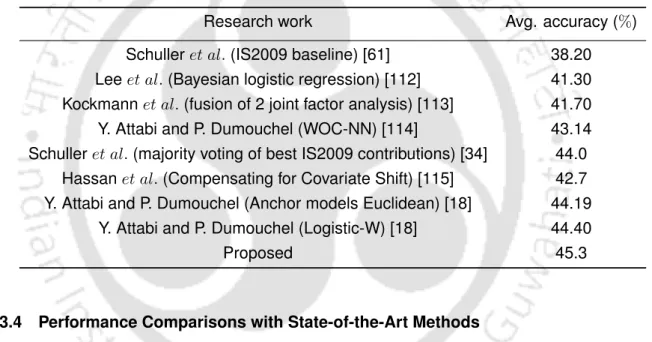
- Performance Comparisons with State-of-the-Art Methods
- Cross-Corpus Evaluation
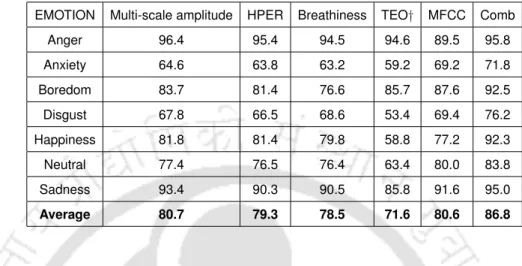
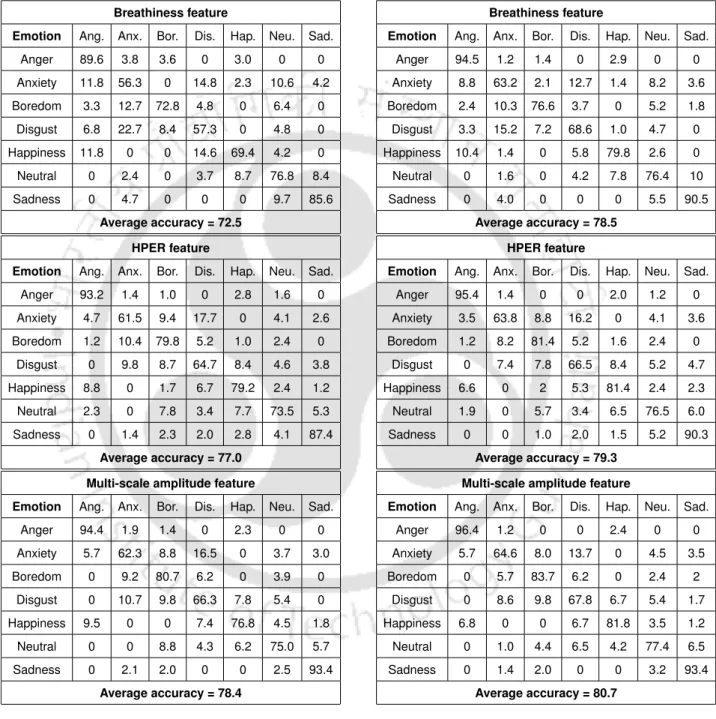
The multiscale amplitude feature shows an average recognition rate of 78.4%, which is higher than that obtained with respiration, HPER, TEO-CB-Auto-Env and MFCC fea-. The average recognition rate increases from 65.1% with the speech signal to 66.7% with the SEVTI signal using multiscale amplitude. For all combinations, the proposed multiscale amplitude feature shows higher recognition rate than the other features.
Summary
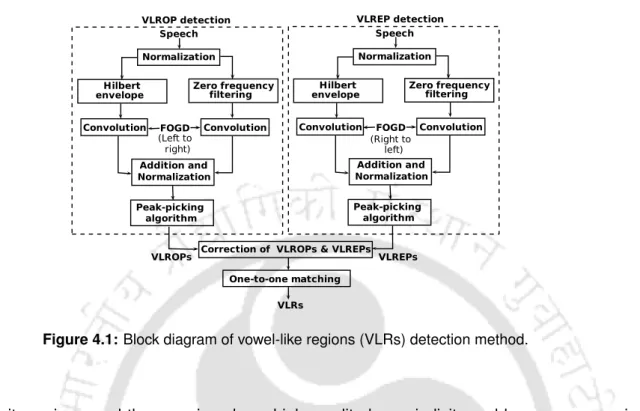
- Vowel-Like Region Onset Points (VLROPs) Detection using Hilbert
- Vowel-Like Region Onset Points (VLROPs) Detection using Zero Fre-
- Vowel-Like Region End Points (VLREPs) Detection
- Detection of Vowel-Like Regions using VLROPs and VLREPs
- Segmentation of Non-Vowel-Like Regions (Non-VLRs)
- Performance of Vowel-Like Region (VLR) and Non-Vowel-Like Region (Non-
The remaining areas of active speech can be considered non-vowel-like areas (without VLR). VLR segmentation is done by identifying VLR start points (VLROP) and VLR end points (VLREP). Therefore, the segmentation of non-VRLs involves detecting the active speech region and subtracting the VLRs from the active speech region.
Emotion Classification using VLRs and Non-VLRs
A distinction is then made between the non-negative valence category to separate happiness and neutral emotions. The negative valence category includes anger and emphasis, while the non-negative valence category includes neutral, positive, and rest classes. Second, a non-negative valence category distinction is used to separate neutral class from positive and rest classes.
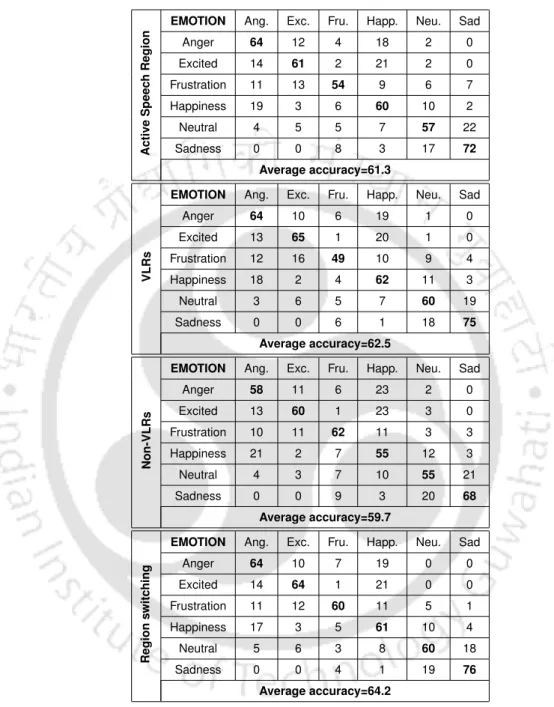
Emotion Classification using Region Switching
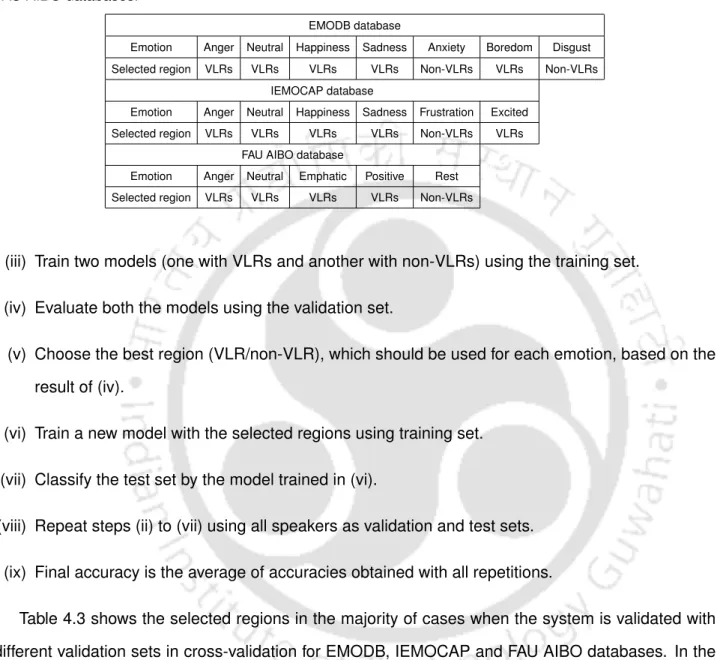
Emotion Anger Neutral Happiness Sadness Anxiety Boredom Disgust Selected area VLR VLR VLR VLR Non-VLR VLR Non-VLR. Emotion Anger Neutral Happiness Sadness Frustration Excitement Selected area VLR VLR VLR VLR Non-VLR VLR. Emotion Anger Neutral Stressed Positive Other Selected Area VLR VLR VLR VLR Non-VLR. iii).
Results and Discussions
- Performance Analysis using EMODB Database
- Performance Analysis using IEMOCAP Database
- Performance Analysis using FAU AIBO Database
- Performance Comparison of the Proposed Region Switching based Method
Therefore, the results of our proposed method using FAU AIBO database can be compared with other state-of-the-art methods. It is noted that the proposed method shows higher recognition rate compared to the state-of-the-art methods. The proposed method shows an average recognition rate of 45.2%, which is higher compared to the average recognition rates obtained with the modern methods.
Summary
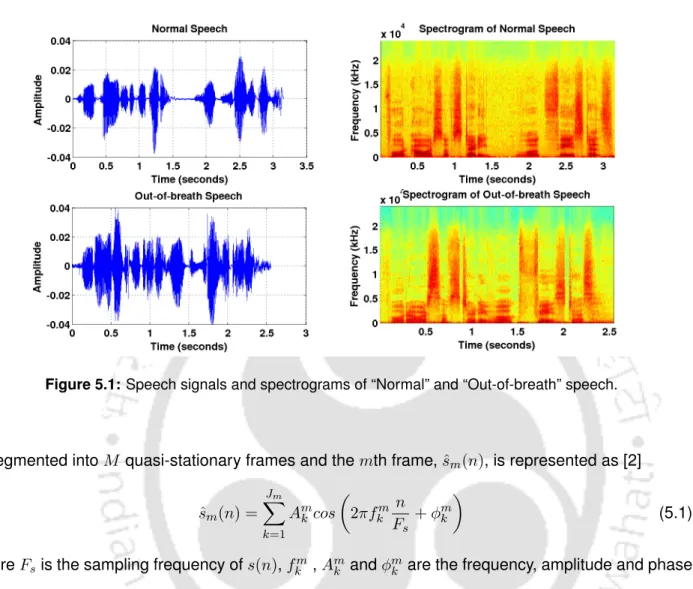
Out-of-Breath Speech (OBS) Database
These three classes are breathless speech, breathless speech, and normal speech. Breathless speech is recorded from the speakers immediately after they undergo running for 6-8 minutes. Then, the speech utterances recorded by the speakers are labeled as breathless speech.
Out-of-Breath Speech Database for Active and Non-Active Categories (OBSAN) 99
Of these, 9 speakers are physically active persons, and the remaining 21 speakers are physically inactive persons. This means that breathless speech contains 216 examples from physically active people, and 504 examples from physically inactive people. It is observed that there is a noticeable difference in heart rate between physically active and physically inactive individuals in the case of breathless and low breathless categories.
Fourier Model of Speech
The harmonic structure of the Fourier model is a Fourier series representation of the periodic components of the speech signal. Amplitudes of breathless speech are higher than normal speech. These energy variations in frequency and time scales can be better exploited in the amplitude and frequency of the Fourier model.
Proposed Method of Feature Extraction
- Fourier Parameters
- Difference and Ratio of the Fourier Parameters
- Proposed Features
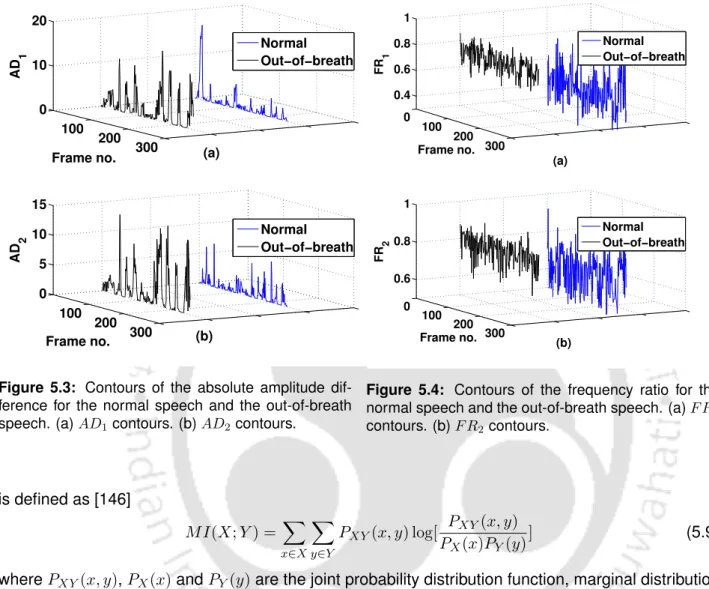
It is observed that the F R1 and F R2 values of breathless speech are higher than those of normal speech. This indicates a relatively greater shift in frequency values in the case of breathless speech compared to normal speech. The proposed work evaluates four features using the mutual information (MI) in the amplitude and frequency parameters of the Fourier model.
Statistical Analysis of the Proposed Fourier Model based Features
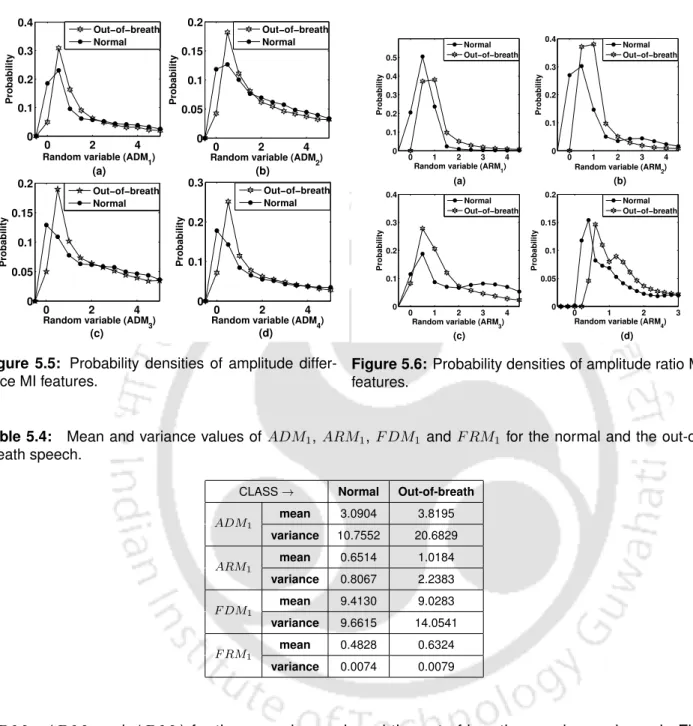
ADM2, ADM3 and ADM4) for normal speech and breathless speech are shown in figure. Breathless speech has a different distribution compared to normal speech for all features. These PDF features represent the qualitative differences of the feature values between normal speech and breathless speech.
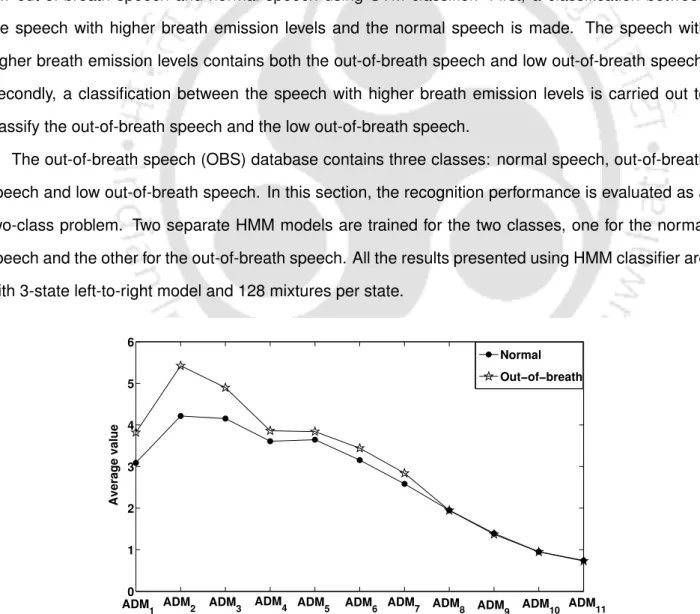
Classification of Out-of-breath Speech and Normal Speech
It is noted that for model order 5, the difference between the average ADM values between the normal speech and the exhaled speech is maximal. The ADM function shows a classification rate of 82.6% for breathless speech and 71.7% for normal speech. These results establish the potential of the proposed Fourier model-based features for the classification of impaired speech and normal speech.
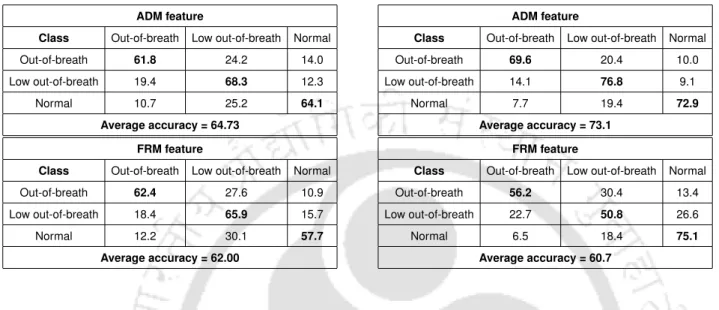
Classification of the Speech Signals at Different Breath Emission Levels
The proposed ADM and FRM features show a higher recognition rate for breathless speech, compared to those obtained with the features of dyspnea, TEO-CB-Auto-Env, cepstrum difference, cepstrum ratio and MFCC. With the exception of the breathless speech, the ADM feature gives the higher recognition rates for all classes, compared to the other features. In the case of low breathless speech, higher recognition accuracies are obtained with both proposed features (ADM and FRM features).
Assessment of Physical Fitness using Out-of-breath Speech
Fourier Model based Posteriorgram Feature
- Gaussian Posteriorgram
- Generation of Gaussian Posteriorgram
In Section 5.2, we derived four features using mutual information (MI) on the differences and ratios of Fourier parameter values to analyze and classify breathy speech. In this section, we derived a new feature using the Fourier parameter to classify physically active and physically inactive subjects from breathy speech and low breathy speech. A Gaussian posterior (GP) is defined as a probability vector that consists of the posterior probabilities of the Gaussian components for a speech frame [152].
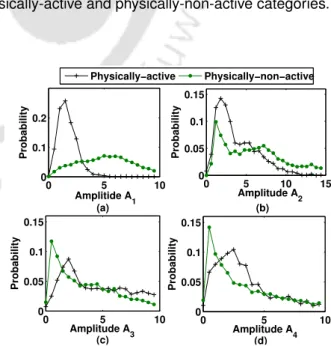
Statistical analysis of Fourier Amplitude
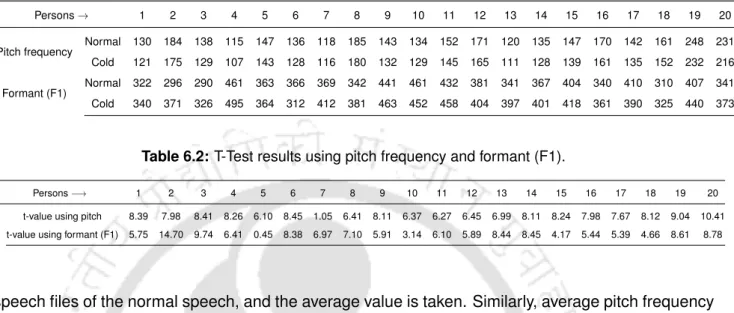
A higher t-value and smaller p-value mean that the two categories are statistically more different from each other. It is observed that all FA traits (except A4) have higher t-values and lower p-values. This means that using exhaled speech may be more effective for classifying physically active and physically inactive categories.
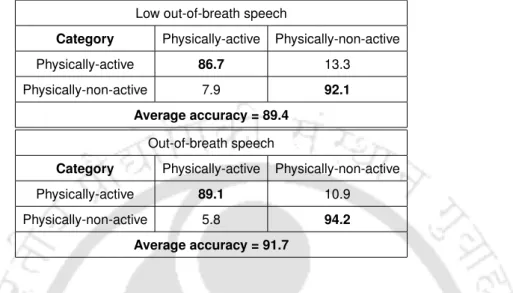
Results and Discussions
The Gaussian posteriorgram feature shows a classification rate of 86.7% for the physically active category and 92.1% for the physically inactive category using low-breathing speech. The Gaussian posteriorgram function with exhaled speech shows a recognition rate of 89.1% for the physically active category and 94.2%. The proposed Gaussian posteriorgram feature shows an average classification rate of 91.7% with breathless speech.
Summary
IITG Cold Speech Database
In this work a new database is recorded and the recorded database is named as IITG cold speech database. The normal speech is recorded from the same person without pathology and free from stress conditions. The cold speech is recorded first and the normal speech is recorded from the same person after his/her recovery from common cold.
URTIC Database
Unlike other databases, this database contains a new pathological speech called cold speech, and it is the database recorded for phrases instead of phonemes. During the recording of the cold speech, the subject had nasal congestion and headache, but no runny nose. In both cases (normal and common cold), the data is recorded in the morning session so that the subjects are free from stress due to the day's workload.
Classification Method
- Pre-processing
- Variational Mode Decomposition
- Feature Extraction
- Weight Assignment and Classification
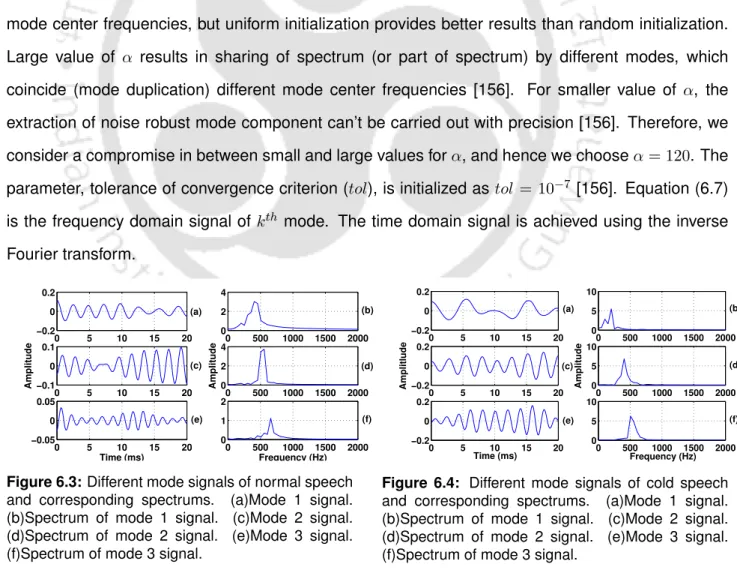
The center frequency of each mode is calculated using equation (6.8), and is used as a feature for cold speech analysis. The most significant peak (ie, the peak with the highest amplitude) of each mode signal is evaluated from the frequency domain signal, and it is used as peak amplitude feature for cold speech analysis. The regularity of different mode signals of cold speech may differ from that of normal speech.
Results and Discussions
- Distributions of Training/Testing Partitions of the Database
- Characteristic-Differences between Normal Speech and Cold Speech
- Statistical Analysis between Normal Speech and Cold Speech
- Performance Analysis
- Performance Comparisons of the Proposed VMD based Feature with Other
- Cross-Corpus Evaluation
- Performance Comparisons of Proposed Method with the State-of-the-Art Meth-
Statistical analysis of the proposed VMD-based features can be useful in exploiting characteristic differences between normal and cold speech. 6.5(a), (b) and (e), it is observed that the mean values of cold speech are higher than those of normal speech. Energy values have greater variation in cold speech than in normal speech.
Summary
Breathless speech is recorded by a person immediately after he/she undergoes physical exercise. We use breathless speech and breathless speech for fitness assessment. The main contributions of the research work reported in this thesis include. i) Respiration feature analysis and proposal of two new features, harmonic peak-to-energy ratio (HPER) and multiscale amplitude, for speech emotion classification. ii) Demonstration of the importance of enhanced vocal tract information for speech emotion classification. iii) Emotion classification method based on region switching, where VLR or non-VLR is processed for each emotion, instead of processing the entire active speech region.
Scope for Future Work
Kaiser, "Nonlinear feature-based classification of speech under stress," IEEE Transactions on Speech and Audio Processing, vol. Hansen, "Speech enhancement using a constrained iterative sinusoidal model," IEEE Transactions on Speech and Audio Processing, vol. Yegnanarayana, “Epoch extraction from speech signals,” IEEE Transactions on Audio, Speech, and Language Processing, vol.
MFCC feature extraction
TEO-FM-Var feature extraction
TEO-Auto-Env feature extraction
TEO-CB-Auto-Env feature extraction
Block diagram of HERes calculation
Proposed method of multi-scale amplitude feature extraction (HPF = High pass filter,
NBD and NDD distributions of anger emotion of EMODB database. (a) NBD distribu-
NBD and NDD distributions of disgust emotion of EMODB database. (a) NBD distribu-
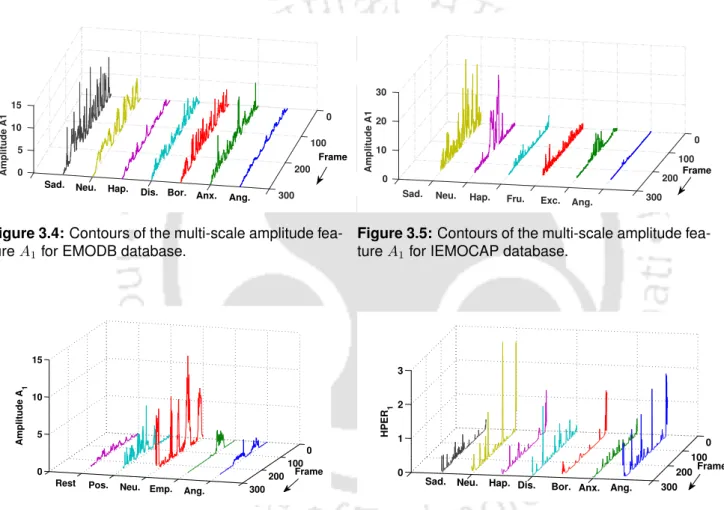
Contours of the multi-scale amplitude feature A 1 for EMODB database
Contours of the multi-scale amplitude feature A 1 for IEMOCAP database
Contours of the multi-scale amplitude feature A 1 for FAU AIBO database
Contours of the HPER feature for EMODB database
Contours of the HPER feature for IEMOCAP database
Contours of the HPER feature for FAU AIBO database
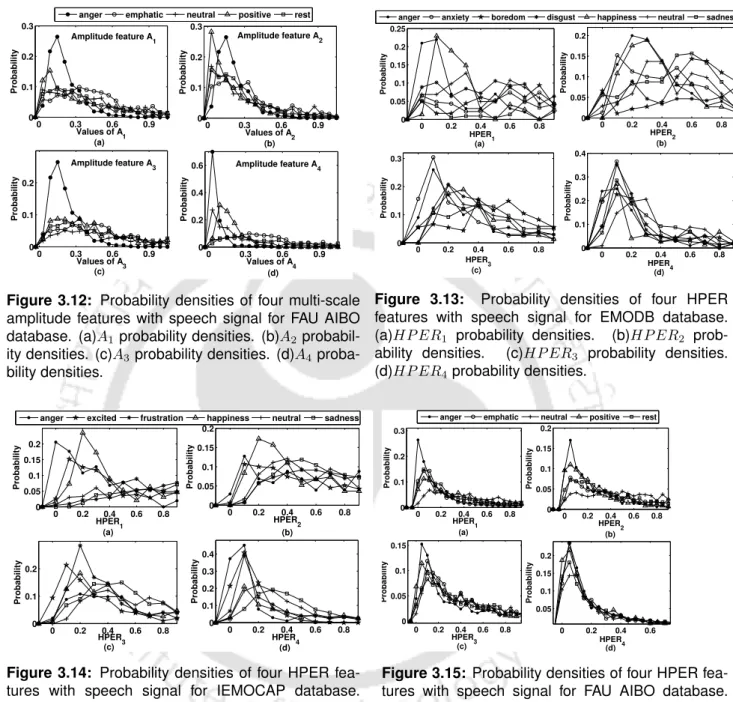
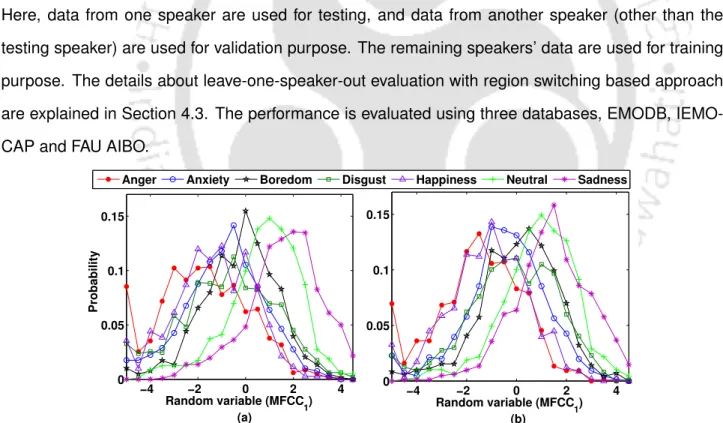
Probability densities of four multi-scale amplitude features with speech signal for EMODB
Probability densities of four multi-scale amplitude features with speech signal for IEMO-