Issue 32 - October 2008
Summary
The Russian economy reached the lowest point of its post-communist slump in 1998, when the state defaulted on debt and was forced to devalue the rouble. After that, economic life in Russia got better.
Between 1998 and 2007 the Russian economy grew at an average annual rate of 7.0%.Russia’s leaders are now confident and believe that Russia is economically “sovereign” and can fend for itself.
Theaim in this report is to assess that economic performance, identifying both strengths and weaknesses, and to look ahead at prospects over the next five years or so.
This involves, first, a review of macro- economic development in Russia under Putin in comparative
perspective, with some consideration of the sources of the growth we have seen; an account of trends in foreign trade and a closer look at the role of oil. In the second section of the report it is the role of economic policy that comes under scrutiny. The third section is a review of prospects. This is an informal projection based on some key numbers, derived from the Russian government’s strategies both for the economy as a whole and for the energy sector in particular. In the final section is offered a brief look at western economic policies as they affect Russia: are we helping or hindering our own interests so far as Russia is concerned?
Philip Hanson is an Associate Fellow at Chatham House Russia and Eurasian Program.
The economic development of
Russia: between state control and
liberalization
Philip Hanson
Russia and EU Eastern Neighbours Program
This paper is part of a research project on Russian political and economic prospects, which has been supported by the Italian Ministry of Foreign Affairs.
The Russian economy reached the lowest point of its post-communist slump in 1998, when the Russian state defaulted on debt and was forced to devalue the rouble. After that, economic life in Russia got better. Between 1998 and 2007 the Russian economy grew at an average annual rate of 7.0%. That means that Russian economic activity increased over the whole period by more than four-fifths: a huge gain, by any reckoning. The material conditions of most Russians improved substantially. The Russian state is no longer deeply indebted to the outside world and struggling to make ends meet. Russia’s leaders are now confident – indeed, rather full of themselves – and feel free to criticise any other power in the world, secure in the belief that Russia is economically “sovereign” and can fend for itself.
My aim in this report is to assess that economic performance, identifying both strengths and weaknesses, and to look ahead at prospects over the next five years or so. This involves, first, a review of macro-economic development in Russia under Putin – that is, from 2000 – in comparative perspective, with some consideration of the sources of the growth we have seen; an account of trends in foreign trade and a closer look at the role of oil. In the second section of the report it is the role of economic policy that comes under scrutiny: in particular the rise of state direction from 2003 and the reasons for and consequences of that shift. The third section is a review of prospects. This is not a projection based on formal modelling. It is informal but with some key numbers, derived particularly from the Russian government’s strategies both for the economy as a whole and for the energy sector in particular. In the final section the conclusions are pulled together, with a brief look at western economic policies as they affect Russia:
are we helping or hindering our own interests so far as Russia is concerned?
1. Russia’s growth since 2000 1.1. Patterns of growth 2000-07
In 2000 the Russian economy was already emerging from a deep slump. Sometimes labelled – unhelpfully – a “transition recession”, this saw Russian real GDP fall by about 40% between 1989 and 1996, revive a little in 1997, then plunge in 1998 under the impact of the financial crisis, and finally embark in 1999 on sustained recovery and, latterly, growth that goes well beyond a simple return to former output levels.
It is worth remembering that the decline began before the USSR ended. In 1989-91 the Soviet economy was, in George Soros’ words, «a centrally planned economy with the centre knocked out» (Wall Street Journal, 7 December 1989). Central planning no longer worked. A functioning market economy was not yet in place. The fall in output ended, for practical purposes, only after the rouble was devalued some fourfold in late 1998. That allowed domestic industrial production to revive. Russian producers had been incapable of competing with imports at around 5 roubles to the US dollar, but could do so when the exchange rate moved to 20 or more roubles to the dollar. Then oil prices began to rise in 1999 and continued, with some early hiccups, to rise still further.
Chart 1 shows some features of this recovery. It displays nine fat years: rising output and large balance-of-payments current account surpluses, accompanied, except in 2001-02, by rising oil prices. The oil price has been highly significant, and more will be
____________________________________________________
* The Author is indebted to Dr. Elizabeth Teague for comments.
said about it in a moment. For now, let us note that rising oil (and therefore gas and oil products) prices do not by themselves constitute an increase in Russian real output;
what they do is generate increased income of government, firms and households; that in turn increases demand for goods and services, and at least some of that increased demand is met by increased Russian production. It is by their indirect effects, in other words, that oil and gas price rises have fuelled Russian growth.
Chart 1: Russia 1998-2007: year-on-year % growth of GDP; Current account balance as % GDP and annual average Urals oil price ($/barrel)
-10 -5 0 5 10 15 20
1998 1999 2000 2001 2002 2003 2004 2005 2006 2007
% change yoy/% of GDP
0 10 20 30 40 50 60 70 80
Urals oil price $/b
GDP%Δ current/GDP Urals oil p
Sources: Rosstat; Central Bank of Russia; Troika Dialog.
Sustained acceleration of a country’s economic growth can come about for a wide range of reasons. This was shown by a study of 83 cases between 1957 and 1992 where a nation’s GDP growth increase by at least 2% a year and the increase was sustained for at least eight years (Hausmann et al. 2004). Their main finding was that such accelerations did not require a full-blown, Washington-Consensus-style liberalization of the economy. A shift to a more stable political regime, or limited liberalization, or a rise in the world price of a key export commodity, can do the trick.
Russia’s nine years of growth so far were triggered by changes in two prices: the price of the rouble and the price of oil. The growth was made possible, however, by institutional changes during the 1990s that created a population of real, market- responsive firms in Russia. These changes stemmed from the liberalization and privatization policies of the Gaidar and other governments, starting in 1992. They also required a subsequent grass-roots development within these firms themselves, moulding and welding the collections of assets that emerged from privatization into
functioning firms; this process was rough and ready, to put it mildly (see Adachi 2005), but it worked, in the sense that Russian producers responded to the market opportunities that rouble devaluation and oil-price hikes presented. Soviet enterprises would not have done so. They would merely have pretended to do whatever the planners told them.
I would argue, in short, that Russia’s economic growth under Putin is the product of fundamental institutional changes that took place under Yeltsin and fortunate circumstances, in the shape of an enforced, unplanned devaluation and a rise in the world oil price. This is not to say that the growth will necessarily stop or slow down soon. The oil price is high and is widely expected to stay high. Russia still has a population of real, profit-seeking firms. The main influence that has changed is that the rouble’s real (inflation-adjusted) exchange rate against a trade-weighted basket of other currencies (dominated by the US dollar and the euro) is back very roughly to where it was before the 1998 devaluation.
To point out that Putin was a lucky economic inheritor is not to claim that Putin-era policies had no merit of their own. The nation’s finances were prudently managed through the fat years, so that inflation was held in check and, at least until 2007, reduced. That was a major contribution to the country’s sustained growth. Along with some less constructive policies of the Putin leadership, it will be discussed in section 2.
Russia’s growth may have been oil-fuelled, but it has also been consumer-led. Average annual growth of household consumption between 1999 and 2007 has been faster than that of GDP, at10.1% (Rosstat data as reported by Troika Dialog, Russia Economic Monthly, February 2008). Since population has been falling, this translates into about 10½% per annum per head of population – a heady rate of growth in people’s prosperity. Nor does that per capita growth come from an average of huge gains for the better-off with little improvement for the rest. For what the official figures are worth – and they are worth a good deal, for all their limitations – 25% of the Russian population were living on incomes below the official subsistence minimum in 2002, and this was down to 14% in 2007 (BOFIT Weekly, 22 February 2008).
1.2. How does recent Russian growth compare with that of other countries?
One way to put Russia’s recent growth in perspective is to compare it with that of other countries. The fact that it is faster than that of the established, developed countries, is not surprising. Middle-income countries, with the potential to absorb more advanced technology from the most highly developed nations, can and often do grow fast. Among large, middle-income countries, Russia has recently been growing faster than Brazil, Mexico or Turkey, a shade more rapidly than India (over 8-9 years) but significantly less rapidly than China.
The most immediately appropriate comparison, however, is with the other CIS countries. They share the same starting-point, so far as economic institutions are concerned, and their starting-points in overall development level and in human capital are fairly close. In this particular comparison, as Chart 2 shows, Russia does not come out particularly well.
Chart 2: Russia and other CIS countries: average annual GDP growth, 1999- 2007(%)
0 2 4 6 8 10 12 14 16 18
Armenia Azerbaijan Belarus Georgia Kazakhst Kyrgyz Moldova Russia Tajikistan Ukraine Uzbekistan
% p.a.
Note: Meaningful data for Turkmenistan are not available.
Source: Mezhgosudarstvennii statisticheskii komitet SNG.
Of course, each CIS state has its own story. The particularly rapid recent growth in Armenia and Azerbaijan is the product, in part, of recovery from a slump in economic activity even more pronounced than Russia’s, created in part by war. And if the two states again came to blows over Nagorno-Karabakh, as some local politicians threaten, economic activity would slump again. Ukraine’s growth averages out about the same as Russia but is more uneven, reflecting, in part, political turmoil. Perhaps the most resonant comparison is with Kazakhstan – also large, also heavily dependent on natural-resource-based exports, but growing significantly faster. Perhaps the most we can say is that Russia’s growth has been impressive but not outstanding. The contention of several Russian liberals has been that Russia could have grown faster if economic policy under Putin had been more free-market in orientation. This argument will be investigated later. For now, we can say that comparison with other ex-Soviet economies does not suggest that Russia has done especially well. And the former Soviet republic that has been subjected to the most liberal policies of all, Estonia, has certainly grown faster. Still, by international standards more broadly, Russian growth has been rapid.
1.3. Developments in foreign trade
Foreign trade has played a crucial part in that growth. Since the collapse of communism, and even while the economy was contracting, Russia has been
integrating itself into the world economy. That integration, so far as merchandise trade is concerned, has taken the form of shifting trade towards the developed West, and Europe in particular, at the expense of trade with other CIS states, and focussing exports more narrowly on products in which Russia has a comparative advantage – oil, gas and metals.
The direction of Russian trade reveals, increasingly, the gravitational pull of Europe as a neighbouring giant market and source of supply. Europe – that is, the EU of 27 plus Norway and Switzerland – takes more than half of Russian exports. The other CIS countries’ share has been falling, to around 15%. The United States’ share is only around 3-4%, for the simple reason that Russia exports natural-resource-based products, and these are costly to transport and the US is far away.
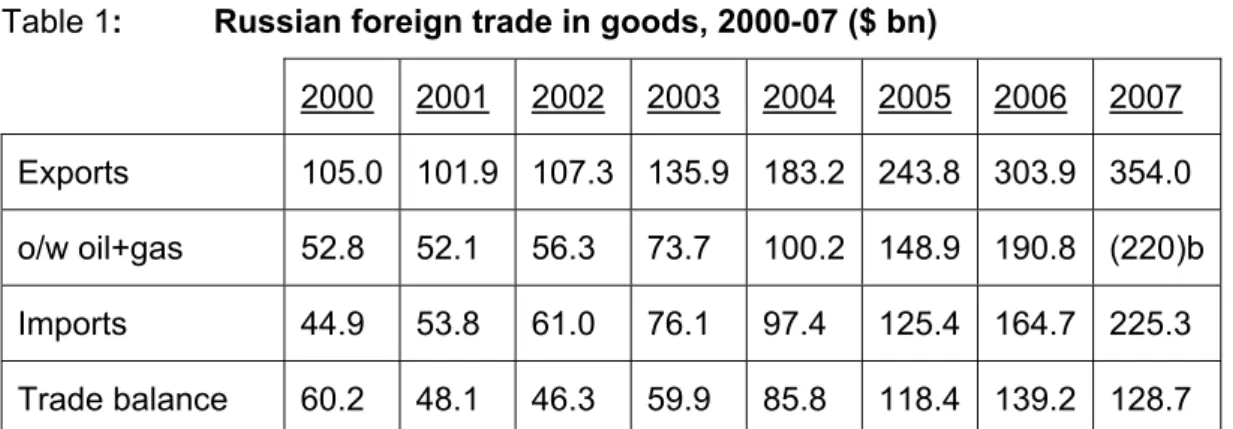
The growing value of merchandise trade is shown in Table 1.
Table 1: Russian foreign trade in goods, 2000-07 ($ bn)
2000 2001 2002 2003 2004 2005 2006 2007 Exports 105.0 101.9 107.3 135.9 183.2 243.8 303.9 354.0 o/w oil+gas 52.8 52.1 56.3 73.7 100.2 148.9 190.8 (220)b Imports 44.9 53.8 61.0 76.1 97.4 125.4 164.7 225.3 Trade balance 60.2 48.1 46.3 59.9 85.8 118.4 139.2 128.7
Notes: a: crude oil plus oil products plus natural gas; b: Author’s estimate, extrapolating from January- September data.
Source: Central Bank of Russia.
It will be seen that in most years the growth of oil and gas exports has amounted to more than half of the overall increment of exports (in dollar terms). In recent years oil and gas have amounted to around three-fifths of Russia’s total exports. If metals (steel, aluminium, platinum group metals and others) are added, and diamond and timber exports as well, the share of natural-resourced based products in overall Russian merchandise exports has latterly been around four-fifths. Arms exports are often mentioned as another Russian strength. They are not identified in the data published by the Russian Customs Service, but various figures circulate within Russia. Nemtsov and Milov (2008) quote $7bn for arms exports in 2007. That is a mere 2% of aggregate merchandise exports.
1.4. Oil and gas exports and the Russian economy
The role of oil and gas in Russia’s exports, budget revenue and GDP is illustrated, for 2006, in Chart 3.
Chart 3: Shares of the oil and gas sector in Russia’s federal budget revenue, exports and GDP, 2006 (%)
0 10 20 30 40 50 60 70
GDP exports budget y
oil & gas as %, 2006
Sources: Central Bank of Russia; Aleksei Kudrin lecture at Higher School of Economics, 21 February 2007 (GDP share, presumably value added share of GDP in current prices).
Note: The Economist of 1 March 2008 quotes an estimate of 31.6% for the oil and gas share of GDP in 2007, from Andrei Illarionov.
That chart suggests that Russia is a petro-state. In some respects, it is, with exports and budget heavily dependent on hydrocarbons. In one important respect, however, Russia is unlike, say, a typical OPEC member: its oil and gas industries employ less than 2% of the workforce. That is fewer than are employed on Russia’s railways. This helps to explain why high earnings in the hydrocarbons sector exert little upward pull on average earnings in the rest of the economy. Indeed, it appears that income inequality tends to be even greater within Russian oil-and-gas-producing regions than within other Russian regions (Buccellato and Mickiewicz 2007). Nor – though this probably does not distinguish it from out-and-out petro-states – does the oil and gas sector generate a great deal of demand for inputs from other sectors of the Russian economy (Nakamura 2006).
These features may limit, for Russia, some of the pathology ascribed to natural- resource-exporting countries. Thus the growth of Russia’s oil, gas and metals exports have indeed tended to drive up the real exchange rate of the rouble, raising demand for imports; but domestic manufacturers do not have to cope with labour costs pulled upwards by earnings in the resource sector. On the other hand, the success of the country’s natural-resource exports has added to the growth of demand for services; this tends to pull resources out of the production of tradable goods, further limiting competitiveness.
For the time being, at least, Russian economic activity levels and average real incomes have benefited from hydrocarbons exports. This makes the slowdown in oil production after 2004 a concern. See Table 2.
Table 2: Russian oil industry dynamics, 2000-07 (% change year on year in crude oil production and number of new fields entering into exploitation each year)
2000 2001 2002 2003 2004 2005 2006 2007 Prodn growth
(%)
6 7 8 11 10 5 3 2
New fields
(number) 6 16 2 9 10 9 8 4
Sources: Rosstat; Kryukov and Borkova 2008.
The slowdown in output growth displayed in Table 2 has fed through to a slowdown in the growth of oil export volume. That has not stopped oil (and gas) revenues from rising, because in 2004-08 world prices have risen dramatically. But it does mean that the growth of hydrocarbons revenues, driven in 2000-04 by both volume and price increases, has latterly been dependent very largely on price hikes. This is illustrated in Chart 4.
If, as Chart 1 suggests, Russian GDP growth has been sensitive to the oil price, then Russia’s vulnerability to a fall in that price is heightened by the loss of dynamism in the oil industry. And we need not judge merely by the look of lines and columns on a graph; several econometric studies support the linkage. One study, by the Bank of Finland’s Institute for Transition (BOFIT), concludes that a sustained $10 a barrel rise in the price of oil raises Russian GDP (by the indirect routes already described) by 2%.
It may seem as though too much attention is being paid here to oil. What about gas?
As a source of tension with CIS countries and with European customers, gas looms much larger than oil. That is because gas is delivered mostly – and in the case of Russia’s exports almost entirely – by pipeline. That makes for rigid, segmented dealings between a supplier at one end of the pipeline and a customer at the other – unlike oil, which can be freely moved around, bought and sold. But so far as the effects of exports on Russia’s economy are concerned, oil has dominated and will continue to do so. This is partly because oil production did grow rapidly through 2004 while gas production has been sluggish for decades; partly because gas prices in long-term supply contracts are based on formulae relating to oil-products prices; but mainly because oil simply earns far more for Russia than gas.
Chart 4: From 2004 oil price rises, not volume growth, drove earnings: year-on- year changes in oil + oil products export volume and average Urals oil price per barrel (%).
-20 -10 0 10 20 30 40 50 60
1999 2000 2001 2002 2003 2004 2005 2006 2007
% change yoy % ∆ oil p
%∆ oil X vol
Sources: Russian Customs Service (www.customs.ru) for tonnage figures; Troika Dialog for average annual price.
In 2007 Russia exported almost 70% of its oil output but around a quarter of its gas production (derived from Rosstat and Russian Customs data)1. Export earnings from gas consequently amounted to only a quarter of those from oil and oil products. Most gas is consumed at home. The Russian economy is notoriously wasteful in its usage of energy. And the fuel it really specialises in wasting is gas. This is a subject to which we will return when considering prospects.
The large trade surpluses apparent in Table 1 grow strongly from 2002 through 2006.
The slight reduction observed in 2007 is expected by the Russian government and central bank to be more than just a short-term fluctuation. Even with oil prices projected to stay high, the rapid growth of imports is expected to erode the trade balance, causing the surplus to disappear around 2010-2011 (see e.g., the interview with Central Bank of Russia deputy chairman Aleksei Ulyukaev in Vremya novostei online of 17 March 2008). This, too, is a point to which we shall return.
1 www.gks.ru/bgd/free/B07_00/1ssWWW.exe.stg/d120/2-21.htm, and www.customs.ru/ru/stats/stats/
trfgoods/popup.php?id286=376, respectively, both accessed 9 March 2008. It is not clear from the Customs source whether the re-export of Central Asian gas is included in the export figures. If they are, the export share of Russian-origin gas is smaller than is stated here.
Meanwhile, it is worth noting that the rapid growth of imports appears to provide prima facie evidence that Russia has begun to suffer from the “Dutch disease”2. This is associated with growing natural-resource exports driving up the exchange rate, reducing the competitiveness of non-natural-resource producers of tradable goods and thus opening the way for imports to replace domestic production – at the margin, that is; there is no implication that domestic production must decline absolutely as a result.
Ollus and Barisitz (2007), looking at EU trade data, showed that, product-group by product-group, Russia’s imports from the EU were rising faster than domestic output.
Curiously, surveys of Russian businesspeople show if anything that import competition is a declining rather than a growing concern. One conjecture about this is that Russian producers have slotted themselves into market niches at the lower end of the product range within each product-group. They therefore avoid too much head-on competition from imports. At the same time, if this conjecture is correct, as Russian household incomes rise and consumers upgrade their purchases, Russian business becomes less well-placed to benefit.
1.5. The balance of payments
The large trade surplus has, for the whole of Mr Putin’s presidency, ensured that Russia has had a large surplus in the current account of its balance of payments. That surplus is shown, as a percentage of GDP, in Chart 1, above. For several years this large surplus fed a large net outflow of private capital, a relationship depicted in Chart 5.
From 2005 the net outflow was transformed into a net inflow. That change reflected growing inflows of private finance into Russia: lending, portfolio investment and direct investment, together with – at least in 2006 – a contraction in capital flight. One striking feature of the new situation was that Russian banks and (non-bank) corporations were increasingly borrowing from abroad while continuing steadily to put funds offshore3. This is illustrated in Chart 6.
The fall in estimated capital flight in 2006 is associated with the establishment in mid- year of full capital-account convertibility. That might have been expected to end illegal or semi-legal expatriation of capital by legalising it; it appears however to have resumed in 2007, perhaps because much of the movement is of funds that either stem from illegal activities or are being moved to evade tax. The latter phrase is used politely, as though there were a clear distinction in Russia between evading (illegally) and avoiding (legally) tax payments. Regrettably, the Russian authorities still do their best to keep the distinction blurred – a point to be picked up again in section 2.
2 The term was coined to describe developments in the Dutch economy following major natural-gas discoveries in the 1970s. The Dutch have got over it now.
3 I define capital flight here as the sum of two items in the Central Bank of Russia’s balance of payments estimates. The first is net errors and omissions. The second is the row ‘Export revenue not received on time, the value of goods and services imports paid for but not supplied and transfers for fictitious operations in securities’; these are all dodges for moving funds offshore unobtrusively. I exclude net purchases of foreign cash, so as to focus as nearly as possible on the activities of the corporate sector.
Chart 5: Russian balance of payments: net private capital flows and current account balance, 2000-07 ($ bn, annual figures)
-40 -20 0 20 40 60 80 100 120
2000 2001 2002 2003 2004 2005 2006 2007
$ bn p.a.
current ac net pte k
Source: Central Bank of Russia.
Chart 6: Russian balance of payments: corporate foreign borrowing and capital flight, 2000-07 ($ bn, annual figures)
-60 -40 -20 0 20 40 60 80 100
1998 1999 2000 2001 2002 2003 2004 2005 2006 2007
$ bn p.a.
corp borr.
K flight
Source: Central Bank of Russia.
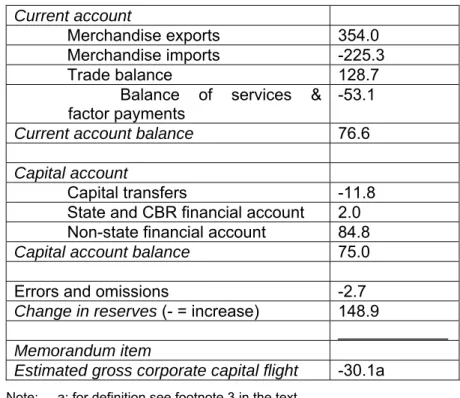
The main components of the 2007 balance of payments are shown in Table 3.
Table 3: The Russian balance of payments in 2007 (preliminary estimates, $bn)
Current account
Merchandise exports 354.0
Merchandise imports -225.3
Trade balance 128.7
Balance of services &
factor payments
-53.1 Current account balance 76.6 Capital account
Capital transfers -11.8
State and CBR financial account 2.0 Non-state financial account 84.8 Capital account balance 75.0
Errors and omissions -2.7
Change in reserves (- = increase) 148.9
____________
Memorandum item
Estimated gross corporate capital flight -30.1a
Note: a: for definition see footnote 3 in the text.
Source: Central Bank of Russia.
The large net private capital inflow is somewhat less encouraging when considered in detail than it appears. To look at it more closely, one has to start by reviewing the gross flows, particularly the gross inflow. The net private capital flow is, after all, merely the balance of the flows in and out.
The gross inflow of $193 bn was made up chiefly of borrowing, with only $47.1 bn of inward foreign direct investment. Much of this “non-state” borrowing abroad was by companies that are in fact state-controlled, such as Gazprom, Rosneft, Sberbank and Vneshtorgbank. These have the advantages either of borrowing against hydrocarbons export revenues or against the belief that the Russian state would, in a crunch, bail them out – or both. What makes for comparatively safe lending, however, does not necessarily guarantee that the borrower will invest the funds productively. There is widespread doubt about the effectiveness of an investment boom (which there undoubtedly was in 2007) that rests heavily on decisions by state-controlled entities.
This is a consideration that will be taken up again in Section 2, and its implications for the future will be reviewed in Section 3.
1.6 Foreign investment, both into and out of Russia
The inward foreign direct investment (IFDI) of an estimated $47.1bn in 2007, plus inward foreign portfolio investment (IFPI) of $0.8bn is almost exactly balanced by the Russian corporate sector’s reported outward foreign direct plus portfolio investment (OFDI + OFPI – the two are reported as one total) of $47.8bn. So it is the large net inflow of money borrowed from Western banks and (via bond issues) capital markets that has created the overall net private capital inflow.
That borrowing has been a striking feature of recent years. It has, as noted above, been accompanied by a continuing outflow of flight capital. Own money out; foreigners’
money – or so one is tempted to say.
Still, the inflow of foreign direct investment, though still modest by international standards, at 3.7% of GDP in 2007, is a gain, even if not all observers see it that way.
Some Russian analysts dismiss it as marginal and even damaging for the economy.
They note that a large part of the inflow is of Russian-controlled funds coming back from offshore havens; that much IFDI consists of acquisitions, changing ownership of assets rather than creating new assets; and that the Central Bank’s IFDI statistics include re-invested profits of foreign affiliates operating in Russia (e.g., Navoi 2007).
These are dubious arguments. It is presumably better for Russia if funds earlier parked offshore are brought back to work onshore than if they stayed abroad. Acquisitions may sometimes be defensive and may not presage future inputs to develop the firm, but often they are the prelude to growing the business, using funds, technology and management skills that might not otherwise be available in the host country. And that is, presumably, exactly what reinvested profits are being reinvested for. The conventional view that, by and large, in the main, on balance (etc) inward investment benefits the host country may be boring but it is unlikely to be untrue. In Russia the consumer sector has been partly built by foreign investors in brewing, confectionery, motor vehicles and retailing. About 20% of banking assets belong to foreign-controlled banks. The foreign presence in hydrocarbons has been reduced by state policy (see the next section) but it remains significant.
Russian OFDI has grown strongly. Several Russian firms, mainly in metals, oil and gas, have become global players (Kalotay 2006 and 2007, Liuhto and Vahtra 2006). UC Rusal is now the world’s largest aluminium company. It is a striking example of the new Russian transnational companies.
Rusal has production assets in Australia, Guinea, Guyana, Jamaica and Nigeria, all the result of foreign direct investment (e.g., a 20% stake in Queensland Alumina Ltd), as well as representative offices in China, Germany, Japan and the US (www.rusal.ru/business/geography, accessed 16 March 2007). Its February 2007 acquisition of the Aluminium Smelting Company of Nigeria (Alscon) was described in its press release as completing the establishment of full-cycle production facilities in West Africa, facilitating Rusal’s entry as a supplier into new markets (www.rusal.ru/press/issues/?ID=32695, accessed 16 March 2007).
In general, the Russian companies that have extended their operations abroad on a substantial scale are companies in the natural-resource sector that have strong market
power in Russia plus sizeable exports. In moving outwards, they are behaving very much as their counterparts in developed Western countries did some time ago. They are part of a recent, strong tendency for new transnational companies to emerge from economies that are themselves categorised as “emerging” (UNCTAD 2006).
Metals companies are the most noteworthy. Apart from Rusal, the steel firms Severstal, Evraz and Mechel have all established themselves abroad on a substantial scale. A recent example is the Evraz acquisition of North American steel-making assets from the Swedish SSAB (SSAB press release of 14 March 2008; Vedomosti, 17 March 2008). The deal was for $4.025bn. Evraz acquired SSAB’s IPSCO tube plants in both Canada and the US, and was selling on the American plants to another Russian company, Trubnaya metallurgicheskaya kompaniya (TMK). TMK thus becomes a leading supplier of steel pipe in the US market. Evraz had bought Oregon Steel Mills in 2006, and also bought Claymont Steel.
It is worth describing some of these details because they illustrate Russia’s growing integration into the world economy, almost regardless, it may seem, of politics.
Sometimes Russian OFDI gives better market access – particularly valuable when anti- dumping restrictions limit Russian steel exports. Sometimes it allows a company to move into a more sophisticated sub-branch of its industry, basically by acquiring foreign plants that already are engaged in more added-value operations. Occasionally that may feed back into technological upgrading in the home industry. An example, apparently, of this is the plan of a Norilsk Nickel-Interros joint venture to make hydrogen energy equipment in Russia after acquiring a 35% stake in a leader in the field, Plug Power (Khaifets 2007). Sometimes a foreign acquisition provides upstream raw material-producing assets or a set of assets that offer a complete cycle of production nearer to a target market; that applies to a number of Rusal purchases. In all of these cases, commercial considerations provide an adequate account of the motivation involved. It may be wise to look out for hidden “political” motives but, with the possible exception of the oil and gas sector, it hardly seems necessary.
In general, this sort of transaction testifies to a process that can only be described as
“normal development”. Russia is becoming more embedded in the networks of trade and investment that make the world economy go round. Eventual accession to the World Trade Organisation would help (National Bureau of Asian Research 2007).
There should perhaps be some qualification of this description of Russian trade and investment development as “normal”. For a middle-income country, Russia invests unusually heavily abroad. This seems to be the case even if one takes into account only officially-recorded outward foreign investment, and leaves capital flight out4.
Two other features of Russia’s economic adaptation to world capitalism are striking and perhaps not to be regarded as “normal”. One is the weakness of Russian industry outside oil, gas and metals, as revealed in the commodity-composition of Russian exports (Cooper 2006a) and in the pattern of Russian OFDI just described5. The other
4 I have found strong evidence for this in a regression analysis of OFDI flows of 38 countries. See Hanson 2007a.
5 It is true that owners of Russian mobile-phone companies have invested abroad. Alfa Group bought Turkcell (a Turkish company) in 2005. But, shipping companies apart, only natural-resource-based companies have developed assets outside the CIS and Turkey. As for arms exports, as an instance of
is the pronounced role of the state since 2003 and the extent to which economic policy is influenced by fear of foreigners. Both are considered in the next section.
2. Policies: between free markets and Kremlin control
Russia’s economic policies under Putin have been a mixed bag. Macro-economic policy has been prudent and disciplined, bringing inflation down and helping to provide a stable environment for growth. Micro-economic policies, at any rate from 2003, have been dominated by increases in direct state control. This has been brought about by selective use of administrative pressure on firms, which has weakened development towards a rule of law. It has tended to raise political uncertainty and has been associated with an increase in corruption. Government is not joined-up anywhere. Still, the economic policies of the Russian state are particularly incoherent.
2.1. Macro-economic policies
The foundation of macro-policy during the Putin years was a tight, conservative management of the federal budget. The impressive sequence of eight successive years of federal budget surpluses is illustrated in Table 4.
Table 4: Federal budget revenue and expenditure, 2000-07 (as % GDP); inflation (end-year, year-on-year increase in consumer prices, %) and broad money supply growth (M2 end-year, year-on-year growth, %)
2000 2001 2002a 2003b 2004 2005 2006 2007
Revenue 15.4 17.6 20.3 20 20.5 23.7 23.5 23.6
Spending 13.2 14.6 18.4 17 16.1 16.2 16.0 18.2
Balance 2.2 3.0 1.9 3 4.4 7.4 7.5 5.4
CPI change 20.2 18.6 15.1 12.0 11.7 12.5 9.8 11.9
M2 change 62.4 40.1 32.3 52 35.8 39.0 48.8 47.5
Notes: a: Social and pension funds included in both revenue and expenditure from 2002, so not precisely comparable with earlier figures; b: Annual total missing from source, so interpolated;
approximate.
Sources: Economic Expert Group (attached to the Ministry of Finance), www.eeg.ru/pages/39?PH PSESSID=40061151cBfa39bd523ae903349elcc5; for 2000-05 budgets; BOFIT Weekly, 20 March 2008: 1 for 2006-07 budgets;M2 and CPI from Troika Dialog.
A surplus in the federal budget, in contemporary Russia, virtually entails an overall government surplus, including sub-national budgets and off-budget funds. Regional and local authorities have minimal borrowing rights, so they are forced to balance their budgets. Many regions do so only with the assistance of regular transfers from the
technical sophistication in merchandise exports: they are not only modest in total (see above) but showing signs of technological age. Russian arms exporters have had difficulties selling beyond the group of long- established customers such as India; India has itself pushed for more co-production; and in February 2008 Algeria returned 15 MiG fighters delivered to it in 2006-07 – perhaps for reasons other than defects, but an unusual development nonetheless (Kommersant, 18 February 2008).
federal budget, but the post-transfer balance of all sub-national budgets taken together has in recent years tended to be a small positive sum. Therefore the general government balance has been positive and slightly larger than the federal balance:
7.9% of GDP in 2005, 8.3% of GDP in 2006 and 6% in 20076.
Government revenue and spending in total (federal plus sub-national plus off-budget funds) loom large in the Russian economy, compared with most middle-income countries: in 2007 total state revenue was 40% of GDP and expenditure 34%. But the control of sub-national spending and the restraint in federal budget policy have allowed overall surpluses to be posted throughout the boom years.
Table 4 also shows the deceleration of inflation and the fluctuating, generally rapid, growth in the broad money supply. Evidently, inflation did not slow through 2006 because monetary expansion slowed. On the contrary, M2, the standard measure of broad money in Russia, accelerated in 2004-06. We will come back to monetary issues in a moment. For the present, the important point to make is that it is primarily fiscal policy, at any rate up to 2007, that borne down on inflationary pressure. Government spending, in the face of soaring export earnings and increases in reserves and the huge current-account balance-of-payments surplus (shown in Chart 1), was held down, and budget surpluses accumulated. It is only in 2007, with parliamentary and presidential elections looming, that budgetary discipline is somewhat relaxed: spending rises faster than GDP and faster than revenue, and the surplus is somewhat reduced.
It might be argued that it was easy with soaring oil prices to run budget surpluses. In fact, the political pressure to spend much more was very strong, and was stoutly resisted – with a small retreat in 2007. The resistance was put up, above all, by Finance Minister (and latterly also deputy prime minister) Aleksei Kudrin. He lost some battles but most of the time he won. He presented a clear, well-argued case for fiscal restraint in the cause of defeating inflation. It may have helped that the Russian population had recent and very unhappy memories of high inflation in the Yeltsin era.
But it was probably more important that Putin – on the whole – backed him. After all, Kudrin, like other ministers in the “economic block” of the government, is merely an official, a chinovnik. He is not a politician in the sense in which highly-placed members of the Presidential Administration are, with power bases in either the security and military or the Putin-centred St Petersburg circle, or both. He almost certainly would have lost most battles if Putin had not been on his side.
One can say that fiscal policy was crucial without implying that monetary policy was in some way defective. It is rather that, in contemporary Russia, monetary policy can be only a limited tool. Open-market operations to manage the money supply are not yet feasible. There needs first to be a sizeable supply of short-term government debt instruments, equivalent to US Treasuries, which the central bank can buy and sell. This is not yet the case. Central Bank of Russia (CBR) actions are only just beginning to influence commercial bank interest rates directly.
6 Rosstat and Bank of Finland sources. For 2005 and 2006 www.gks.ru/bgd/regl/607_13/lssWWW.exe /Stg/do5/22-05.htm, and for 2007 (preliminary estimates) BOFIT as in Table 4.
Changes in the money supply have been dominated by the large net inflows of foreign currency that have been entering the country. These have stemmed mostly from the huge current-account surplus in the balance of payments, but in 2007 also from a substantial net capital inflow (see Section 1 above). The inflows have presented Russian policymakers with a dilemma: either the CBR stands back and lets the exchange rate of the rouble rise rapidly or it intervenes by buying foreign currency and selling roubles, allowing reserves to rise but moderating or even halting the rise of the exchange rate. In the first case, a rapidly-appreciating rouble damages the competitiveness of Russian producers, whether against imports on the home market or as exporters7, but the domestic money supply can rise more slowly. In the second case, producers suffer less from a rising real effective exchange rate but the money supply rises faster as more roubles are printed to purchase foreign exchange. The CBR was just beginning in early 2008 to target inflation rather than the exchange rate.
For most of Putin’s presidency the CBR gave priority to managing the exchange rate.
Hence the very large increases in broad money supply shown in Table 4. Hence, too, the key role of budgetary discipline in fighting inflation.
Also important in combating inflation was the Stabilization Fund (2003-2008), divided from February 2008 into two successor funds: a Reserve Fund and a National Prosperity Fund (for details and extended analysis see Tabata 2007). The Stabilization Fund and its direct successor, the Reserve Fund, are financed from resource- extraction tax and export-duty revenue on crude oil and (latterly) also on oil products and gas. Transfers into the stabfond, to use its Russian abbreviation, were about a quarter of federal budget revenue in 2005-06 (ibid.). By end-2007 the stabfond was equivalent to 11.6% of GDP (Troika Dialog, Russia Economic Monthly, February 2008, p. 2). The stabfond/Reserve Fund serves two purposes. It provides a reservoir from which budget revenue can be topped up if the oil price falls significantly. And it takes out of circulation a substantial part of the potentially-inflationary inflow of foreign currency (it “sterilizes” part of that inflow). I estimate from the increase in the stabfond during 2007 and the value of oil exports that about 58% of crude oil export revenue was sterilized in this way, and 32% of all oil, oil products and gas export earnings8. As the stabfond and the foreign exchange reserves grew, they looked more and more like treasure chests to be raided. At $465bn at end-2007, the reserves were among the highest in the world, and could have paid for that year’s imports twice over. Influential politicians and some influential industrialists called for the budget spending to be increased from these supposedly “idle” and “excessive” stores of wealth. They claimed that housing, roads, pensions, high-tech industry and many other good causes would benefit. Kudrin and his allies responded that much of the spending would go to waste and its chief effect would be to boost inflation. Behind this debate, and usually
7 To be precise, it will damage competitiveness unless domestic producers can raise productivity about as fast as the real (inflation-adjusted) effective (against a trade-weighted basket of currencies) exchange rate is rising. There are limits, in any country, to how rapidly productivity can be raised.
8 It was only in 2008 that the base for building up the fund was extended from taxation on crude oil only to include taxation on oil products and gas as well. The stabfond was drawn on to repay sovereign foreign debt, and I have added the $5bn reduction in sovereign debt over 2007 to the net increase in the stabfond to guesstimate flows into the fund.
unspoken, was the belief that the would-be big spenders were seeking to enrich themselves.
From February 2008 the Reserve Fund is targeted to be about 10% of GDP. The separate National Prosperity Fund – Russia’s first sovereign wealth fund – starts off much smaller but can be invested in riskier, higher-yielding assets and is viewed as, effectively, a fund for future generations, somewhat on the lines of the Norwegian and other such funds. Of the total tax revenue potentially destined for these two funds, an amount up to 3.7% of GDP can be diverted to the federal budget, and that budget, in turn, is to have a ceiling on its deficit excluding oil and gas revenue of 4.7% of GDP.
There are two difficulties about these new arrangements.
One is that the trade surplus, and therefore the current account, is expected to shrink as imports grow faster than exports; that development reduces the inflationary threat of currency inflows, yet the sterilising mechanism is sensitive only to gross revenues from hydrocarbons, not to the balance – which is for macro-economic management purposes more important.
The other is that, whatever happens to the current account, there is a strong possibility that there will be a substantial net inflow of private capital (see Section 1)9. There might therefore continue to be an inflationary inflow of funds, but it would stem from a source that was not subject to stabfond-type sterilization.
Inflation, in other words, could well continue to be a problem. We will come back to this issue in Section 3.
To sum up: macro-economic policy has been sound. The prelude to the elections of 2007/2008 tested it, but not to destruction. It has been the creation of a rather small contingent of high officials in the Ministry of Finance, the Central Bank of Russia and, to a somewhat lesser extent, the Ministry of Economic Development and Trade (MERT). This is a platoon of economic liberals in an army of state officials who are often corrupt and not much inclined, on the whole, to coherent policies – let alone to coherent liberal policies. If the Chief Faction Manager of Russia10, President Putin, had chosen to disband or simply to ignore this platoon, the Russian economy would be in a macro-economic mess, with high inflation and, probably, sluggish growth.
The opportunistic, asset-grabbing and statist inclinations of a large part of the state administration, however, do show up, unfortunately, in policies that have impaired the functioning of individual markets for goods, services and factors of production.
9 Deputy CBR chairman Aleksei Ulyukaev said in March 2008 that there had been net outflows of private capital in January and February but it was still expected that over the year as a whole there would be a net inflow of the order of $40bn (Vremya Novostei online, 17 March 2008). That would be only about a half of the 2007 figure, but still part of a significant new shift in flows from 2005 on (see Chart 5).
10 This phrase ought to be © Richard Sakwa. I have adapted it from Professor Richard Sakwa of the University of Kent.
2.2. Fluctuating, uneven policies
It should be said at the beginning of this sub-section that the first three-and-half-years of Putin’s presidency saw a vigorous continuation of the reforms initiated under Yeltsin.
Legislation was introduced that allowed a market in land to function, that reduced the tax burden and that reduced bureaucratic barriers to the creation and expansion of small firms11.
It should also be said that there are large and important segments of the Russian economy in which the operating environment for companies has improved, even in more recent years. These are areas where the grass-roots development of business institutions and practices has been below the politicians’ radar, or where political resistance to the establishment of more open and competitive arrangements has been overcome.
Here are some examples.
Russian commercial banks now do far more of the fundamental and constructive business of obtaining funds from savers and channelling them to the finance of real investment. Bank credit outstanding to the private sector, including households, was R12.8 trillion at 1 February 2008 (CBR data), or equivalent to 39% of 2007 GDP – modest by international standards but well above figures earlier in the decade.
Foreign banks have a growing presence in the Russian banking sector. In the course of 2007 non-residents’ share of banking capital rose from 15.9 to 25.1% (Vedomosti, 21 February 2008). With the CBR’s adjustment of the data for 2non-resident capital” that is in fact controlled by residents (via offshore companies in Cyprus and the like), these figures become 14.8 to 22.8% - not hugely different. The growth of foreign banks in Russia is not a development that Russian nationalists warm to; but serious analysts, Russian analysts included, regard it as a source of improvement in the banking sector.
It has been facilitated by negotiations with the US over Russian accession to the World Trade Organization, in which Russia lifted its cap on foreign bank ownership, keeping in reserve an agreed power to block further foreign investment if the foreign proportion of bank ownership reaches 50% (see Johnson 2007).
A more general indication of strengthening of the financial services sector is the reduced spread between deposit and lending rates, as monitored by Troika Dialog. The annual average spread has dropped steadily since 2000, when it was 18.9%, to 4.5%
in 2007 (Troika Dialog, loc. cit.). True, in 2007 both rates were negative in real terms.
This is hardly efficient. Still, the fall in the spread indicates an increasingly robust sector.
The banking sector is not a special case. The growth of consumer-related industries, from brewing to retailing, was noted in the previous section. Even in the energy sector there are bright spots: the privately-owned and generally thriving coal industry (see Monaghan 2007) and the continuing – if delayed and somewhat flawed – privatization
11 Six rounds of surveys of small firms by the Center for Economic and Financial Research (TsEFIR) have shown that this de-bureaucratization legislation has on balance improved the business environment for small business – though not so much as it should have, and with some back-sliding. See www.ce fir.ru/php?1=rus&id=5 (accessed 21 March 2008).
of electricity generation. In general, the Russian economy is a patchwork. Some lines of production are developing in what might be described, for want of a better word, as a
“normal” fashion. In others a weak rule of law and ad hoc state intervention curb development.
For the economy as a whole, however, there is strong evidence of high and worsening levels of corruption and a weak and deteriorating rule of law, affecting many economic activities in Russia.
2.3. How the Russian business environment looks in international perspective
The quantitative, survey-based information is clear. Sources include the World Bank’s surveys of governance and of the Ease of Doing Business (across 212 countries in 1996-2006 and across varying numbers of countries, rising to 178, in 2004-08, respectively); the World Economic Forum’s Global Competitiveness Index (131 countries in 2007-08) and the World Bank-EBRD Business Environment and Enterprise Performance Surveys of ex-communist countries in 2002 and 200512.
Summary recent rankings are shown in Table 5. They are not encouraging for Russia.
Table 5: Russia’s governance and business environment: rankings by international organizations for 2006-08 (rank number or percentile ranking, with number of countries surveyed)
Russia Out of (n countries) WEF Global Competitiveness Index 2007-08 58 131
World Bank Ease of Doing Business 2008 106 178 World Bank Governance 2006 (percentile rank):
- Government effectiveness 37.9 212
- Regulatory quality 33.7 212
- Rule of law 19.0 212
Note: In the percentile rankings 1 = worst, 100 = best, so the rankings shown here put Russia, in descending order of the indicators shown here, near the top of the bottom-ranked two-fifths of countries; marginally above the bottom third; and in the bottom fifth, or of the order of 132nd, 141st and 172nd, respectively.
Sources: See note 12 in the text.
Each of these surveys is intended to measure something specific, so they are not closely and directly comparable. The World Economic Forum competitiveness index covers “basic requirements” of institutions, infrastructure, macro-economic stability and health and primary education; “efficiency enhancers” ranging from market size (where Russia comes 9th) through assessments of goods and labour markets efficiency to
“financial market sophistication”, where Russia comes 109th. Finally, the index also includes measures of business sophistication and innovation. It is striking that on
12 The sources cited here are, in the order of surveys listed in the text: Kaufmann et al., 2007; www.doing business.org/ExploreEconomies/?economyid=159 (accessed 21 March 2008); www.gcr.weforum .org/pages/analysis.aspx (accessed 23 November 2007); and Anderson and Gray 2006.
“institutions” Russia ranks 116th. Its relative strengths show up as market size, labour market efficiency and macro-economic stability.
The Ease of Doing Business Survey (EoDBS) compiles information on the ease and cost (including time taken) of carrying out a number of standard business activities in a particular country: starting a business; dealing with licences (using the example of getting a warehouse built); hiring and firing workers; registering property; getting credit;
protecting investors; paying taxes; trading across borders; enforcing contracts; and closing a business.
Under these headings Russia comes out not too badly on starting a business (50th), registering property (45th) and enforcing a contract through the courts (19th). It comes out very badly on paying taxes (130th), trading across borders (155th, due to the notoriously corrupt Customs Service) and 177th on dealing with licences (and these are not the contentious natural resource extraction licences but only what should be routine arrangements to build a warehouse).
Overall, the Russian business environment emerges from the EoDBS rankings as bad for an “upper middle-income country”, which is how the World Bank classifies it. Nearly all the countries below it in the rankings are poorer, and quite a few of those ranked above it are also poorer.
Compared with other CIS countries, Russia is seventh out of the eleven covered, with Georgia ranked a surprising 18th in the world (no other CIS country is in the top 70, though Kazakhstan ranks 71st).
Compared with other members of the Goldman Sachs-invented BRICs club, Russia does rather better. Its ease of doing business is ranked well below China’s (83rd) but clearly above India at 120th and Brazil at 122nd. But the other three are all poorer than Russia.
The World Bank’s “Governance” scores are designed to give a broader comparative assessment of what we might call the state of the state. In Table 5 I have selected the indicators that might be expected to bear most heavily on a nation’s economic performance: the effectiveness of government administration, the quality of regulation and the rule of law. It is striking, again, that Russia “underperforms” for its development level. Governance is positively and significantly associated with development level, and the average percentile rank on rule of law for a country with Russia’s per capita GDP is 60.9 – way above its actual 19.0.
For these indicators, Kaufmann and his co-authors show scores over several years.
Changes in Russia’s scores between 1998 and 2006, however, are within the margin of error (90% confidence interval). From these scores, therefore, we can say only that there is no clear sign either of improvement or of deterioration.
One study does show a worsening over time, in an important aspect of the business environment: corruption. Anderson and Gray find that between their two surveys of businesses in 2002 and 2005, the volume of bribery increased by about 50% (p. 38).
That is in line with other assessments such as those of Transparency International. It could be that the increase in central control from 2003 provided officials with more opportunities to extract back-handers.
So much for the ranks and scores generated by surveys. What is it that has been going on in Russia from 2003 that has at the very least blocked improvement in the business climate, and perhaps made it worse?
2.3. The turn to statism: Yukos and after
The Russian state’s re-assertion of direct control over big business started with the arrest in summer 2003 of Platon Lebedev, a stake-holder in Yukos, the largest Russian oil company. It escalated with the arrest in October of that year of the boss of Yukos and its main stake-holder, Mikhail Khodorkovskii. The affair then passed through any number of twists and turns. The company was presented with huge back-tax demands, and its assets were frozen by the courts. Putin said that there was no intention of bankrupting Yukos, but it was eventually declared bankrupt in 2006. The main Yukos production company was bought in December 2004 by an unknown shell company that turned out to be acting on behalf of the state oil company Rosneft. The purchase was made in an auction with only one bidder. In 2007 Rosneft acquired most of the other Yukos assets in Russia. Khodorkovskii and Lebedev were both sentenced to eight years’ imprisonment. At the time of writing additional charges are being prepared against Khodorkovkii13. For a detailed narrative and analysis covering the Yukos affair up to mid-2006, see Konończuk 2006; see also Hanson 2007b.
Meanwhile the state’s control of the oil industry was also strengthened by Gazprom’s purchase of Sibneft, and its control of the gas industry by two other Gazprom actions:
the acquisition of controlling stakes in the East Siberian Kovykta gas field14, from TNK- BP and in the previously Royal Dutch Shell-led Sakhalin-2 offshore project. The Yukos acquisition was done by administrative and legal pressure. The other acquisitions were purchases of a superficially more normal kind. But in the cases of Kovykta and Sakhalin-2 the acquisition was preceded by administrative pressure – allegations of licence infringement and environmental damage, respectively. The targeted “seller” is first softened up, until it becomes clear that the buyer’s offer, when it comes, is one that cannot be refused. At the time of writing, such pressure was being renewed against the UK-Russian joint venture, TNK-BP (Financial Times, 22 March 2008). The acquisition of Sibneft from Roman Abramovich is a mystery, with perhaps a rather different story behind it. It is not clear where the money for Sibneft ended up; it has been suggested that part of it accrued to companies whose ultimate beneficiary owner is Vladimir Putin15.
The state’s extension of its formal ownership of assets has been chiefly in the oil industry. In 2004 19% of oil production came from state-controlled companies, whereas that share is now approaching 50% (Hanson 2007b). The state already dominated the gas industry, the great bulk of which had never been privatised.
13 For a detailed narrative and analysis covering the Yukos affair up to mid-2006, see Konończuk 2006;
see also Hanson 2007b.
14 At the time of writing the terms of the Kovykta transaction are still being negotiated.
15 See for instance Stanislav Belkovskii’s interview in the Guardian, 21 December 2007, where he claimed to have evidence that Putin had a personal fortune of $40bn, based on 4-5% of Gazprom, 37% of the Surgutneftegaz oil company and 75% of the oil trader Gunvor. See also Belkovskii and Golyshev 2006.
The extension of state control has not, however, been confined to the oil industry.
There have also been acquisitions by the state over the period 2004-08 in banking and in engineering. A number of state holding companies have been formed, mostly in 2006-08: Rostekhnologii (containing the state arms trader, Rosoboroneksport, and its assorted holdings, which include the AvtoVAZ car works and the VSMPO-Avisma titanium plant, the Krasnyi Oktyabr’ special steelworks, the Oboronprom holding and others); the United Aviation Company (aircraft making, not airlines); the United Shipbuilding Company; and holdings dealing with nuclear power generation (Atomenergoprom) and nanotechnology. These entities contain a mixture of already- state-owned and partly-private assets. There is a considerable amount of squabbling over which holding gets what assets. An article in Vedomosti of 19 March 2008 reports Deputy Prime Minister Sergei Ivanov’s attempt to slap down Rostekhnologii boss Sergei Chemezov’s efforts to obtain aircraft assembly plants.
Elsewhere (Hanson 2007b) I have described in more detail this turn to statism and reviewed alternative accounts of its origins and consequences. Here I will summarise.
There are three main lines of explanation of what has been going on.
The first interpretation is that Russian policy-makers, disillusioned by the alleged failure of market reforms in the 1990s, have come round to policies characteristic of a
“developmental state” or, in a recent coinage, “the world without the West”: direct state intervention has come to be seen as a better way of ensuring growth than the liberal policies advocated by Washington. In addition, state control of hydrocarbon reserves is the norm across the world these days; the privatisation of most of the Russian oil industry in the 1990s could be presented as an aberration to be corrected in the cause of state-led development. In a similar way, the research, development and high-tech production assets of the country need, it is claimed, to be directed by a state programme if the economy is to be diversified and Russia is to begin to compete as a knowledge economy.
The second version of events is a more traditional Russian story. The present occupants of the Kremlin are practising what Gaidar (2007) calls “soft authoritarianism”.
Competition for high political office is not to be allowed. Sources of social and political power that are independent of the present rulers are also not allowed. Therefore members of the political and economic elite need to be in a state of what Ledeneva (2006) calls “suspended punishment”: laws and other formal rules are often ambiguous and courts obey the Kremlin, so that people in positions of influence can always be convicted of something if the authorities so desire; informal rules prevail and these were contravened by Khodorkovskii. His punishment was a signal to other wealthy entrepreneurs that they must serve the state as and when required, not pursue any social or political agenda of their own. The approach of the Putin leadership is patrimonial. Wealth, if not held directly by the state, is held provisionally by private persons, but always at the state’s discretion.
The third story is the simplest. Those in power – that is, primarily, high officials in the Presidential Administration but also others with the right connections – are grabbing assets in order to become very rich. If stories circulate about Putin owning $40bn, that is because they are true. This honey-pot effect accounts for the presence of high officials like Igor Sechin on the boards of big state companies (Sechin chairs Rosneft).
With weak courts and a general preference for opacity in the management of state- controlled corporations, siphoning money out of such entities is not a problem. (See the allegations about this by Oleg Shvartsman in Kommersant, 30 November 2007.)
In my judgement, none of these stories on its own quite fits the facts. If the Putin leadership were increasing direct state control of “strategic assets” simply because they believed that this was for the good of Russia, the attack on Khodorkovskii – an action that could have been carried out without nationalising the company – requires some other explanation. But it preceded the attack on the Yukos company. The bankrupting of Yukos looks rather like an action that developed serendipitously, in the wake of an attack on an over-mighty citizen. One might also expect any shift in economic policy to have been led by the economic-policy-making departments of government: MERT and MinFin. They were not. The heads of both ministries in fact criticised the change (Hanson 2007b, p. 879). The policy shift came from the Presidential Administration.
On the other hand, if venal asset-grabbing was the beginning and end of the entire turn to statism, why not take it further? Why not move on to re-nationalise Lukoil and the giant metal companies?
Probably elements of all three “explanations” have been in play. But the sequence of events – particularly the slide from attacking Khodorkovskii to attacking Yukos and from the Yukos affair to further (if marginally more civilised) acquisitions of other oil and gas companies – suggests that the second explanation, the drive to ensure obedience, may have given the whole process its initial impetus. Then asset-grabbing seems to have come into play. When the plan (endorsed by Putin) to merge Gazprom and Rosneft into a single, national champion spanning oil and gas foundered in 2004-05, there were strong indications that different groups in the political elite were teaming up to grab or defend particular assets against one another.
It looks more as though the present Kremlin leaders prize control above all, with personal wealth as a joint product of that control. If so, they will be happy to proceed for some time with a system in which private enterprise still dominates, but in which big business, at least, is run by trusted entrepreneurs, not “cosmopolitans” or “offshore aristocrats” who cannot be relied upon to do the Kremlin’s bidding16.
If this conjecture is near the mark, the implications for competition are bad. Personal contacts with people in power will be expected to trump free market entry and open competition – at any rate in those lines of economic activity the Kremlin judges to be
“strategic”.
What does this imply for foreign firms? For some foreign firms, probably not much; if a foreign firm is keen to invest in developing shopping malls or breweries or banking in Russia it will probably have to contend with bureaucratic entanglements and local corruption but will not find its property rights attacked by the powers that be. On the
16 The origins and meanings of these phrases are discussed in Hanson 2007b. “Offshore aristocrats” was a term used by deputy head of the Presidential Administration Vladislav Surkov in a 2005 speech that was supposed to be off the record. Offshore aristocrats whose allegiance could not be relied upon – these were the sort of people that he did not want to see running Russian business.