BSPE98661-10046-3
남해안 빈산소해역의 관리를 위한 생태계 반응 연구
Ecological Responses in the Hypoxic Condition in Southern Coast of Korea for Ecosystem Management
2012. 03
한국해양연구원
B S P E 9 8 6 6
- 1
1 0 0 4 6 - 3 )
남 해 안 빈 산 소 해 역 의 관 리 를 위 한 생 태 계 반 응 연 구
한
국
해
양
연
구
원
주 의
1. 이 보고서는 한국해양연구원에서 수행한 기본연구사업의 연구결과보 고서입니다.
2. 이 보고서 내용을 발표할 때에는 반드시 한국해양연구원에서 수행한 기본연구사업의 연구결과임을 밝혀야 합니다.
3. 국가과학기술 기밀유지에 필요한 내용은 대외적으로 발표 또는 공개하여서는 안됩니다.
제 출 문
한국해양연구원장 귀하
본 보고서를 “ 남해안 빈산소해역의 관리를 위한 생태계 반응 연구”과제의 최종보 고서로 제출합니다.
2012. 3.
총괄연구책임자 : 염 승 식 참 여 연 구 원 : 구본화 김소라 김영옥 김윤칠 김하나 김한나 박소현 서진영 소재귀 신현호 우선옥 원효경 이건섭 이애경 이우진 이은선 이태희 이택견 장민철 장풍국 정승원 정지현 채영선 최동림 최진우 현봉길 황옥명 황진익
요 약 문
I. 제 목
남해안 빈산소해역의 관리를 위한 생태계 반응 연구
II. 연구개발의 필요성 및 목적
1. 가막만의 퇴적환경과 지화학적 특성
- 퇴적물 발달특성 분석은 퇴적물에 기록된 빈산소 발달 특성과 변화과정을 이해할 수 있으며, 저서생물의 생태환경에 미치는 영향 해석에 필요함
- 빈산소가 형성되는 근본 원인 파악을 위해 퇴적물 산소소모량을 측정할 필요가 있음
- 빈산소가 지속되면서 퇴적물로부터 용출되는 환경저해물질을 파악하여 생태계에 미칠 영향 예측이 필요함
2. 가막만의 물리해양학적 특성
- 가막만 빈산소 해역의 해양물리 환경 특성을 조사하여 빈산소 발생과의 연관성을 파악하며 생태계 조사 자료를 토대로 물리-생태계 모델 개발의 기반을 마련 3. 빈산소해역의 퇴적물에서 석회질 와편모조류 시스트
- 빈산소해역의 환경특성이 석회질 와편모조류 시스트에 미치는 영향 분석 4. 요각류의 난 부화에 대한 빈산소의 영향
- 요각류의 난 부화에 대한 빈산소 수괴의 영향 분석 5. 대형저서동물
- 빈산소 수괴 형성에 따른 대형저서동물의 반응을 보기위해 실시함
- 빈산소 수괴 형성 전후의 대형저서동물 군집 및 회복기의 군집구조를 파악하고자 하였음
6. 담치 기원의 빈산소환경 대응 유전자 지표 발굴
- 빈산소 환경 노출에 대한 해양생물의 분자생물학적 반응에 대해서는 알려진 것이 거의 없음
- 국내의 대표적 양식 이매패류인 지중해담치를 대상으로 빈산소환경 대응 유전자 지표를 발굴하고, 그 기능을 고찰함
7. 빈산소 조건에 노출된 성게의 생물학적 반응
- 빈산소 환경에서 성게의 스트레스 확인과 현장 샘플을 통한 빈산소 바이오 마커 의 확립
8. 빈산소 환경으로 인한 어류의 생리/화학적 영향연구
- 가막만 해역에서 채집된 현장 서식어의 생식내분비계와 생화학적 반응에 대한 빈 산소 영향 평가
III. 연구개발의 내용 및 범위
1. 가막만의 퇴적환경과 지화학적 특성 - 해저지형 및 지층구조 발달 특성 분석 - 퇴적상 및 퇴적물 내 유기물 분포특성 분석 - 퇴적물 산소소모량과 저층용출 독성물질 분석 2. 가막만의 물리해양학적 특성
- 가막만의 조석 및 해류 특성 분석 - 가막만 해수의 계절 변동 특성 파악 - 물리-생태계 결합 모델 수립
3. 빈산소해역의 퇴적물에서 석회질 와편모조류 시스트
- 빈산소 해역에서 나타나는 석회질 와편모조류 시스트의 형태적 변화 원인 규명 - 석회질 와편모조류 시스트의 형태적 변화에 영향을 주는 pH
- 빈산소수역과 정상수역에서 석회질 와편모조류 시스트의 발아율 측정 - 형태적 변화가 발생한 시스트(naked type)의 발아능
4. 요각류의 난 부화에 대한 빈산소의 영향
- 빈산소 및 정상해역에서 seabed의 환경 모니터링
- 빈산소 및 정상해역에서 요각류 난의 현장(in situ) 부화율 측정 - 요각류의 난 부화율에 대한 산소와 pH의 영향 평가
5. 대형저서동물
- Hypoxic 해역과 normoxic 해역의 저서동물군집의 구조를 파악하기 위해 2009년 5월부터 2010년 7월까지 20개 정점에 대한 계절조사를 실시하였음
- Hypoxia 발생 전후의 대형저서동물 군집구조 및 회복기의 군집구조를 파악하기 위해 2009년 2월부터 2011년 9월까지 5개 정점에 대한 월별 조사를 실시하였음
6. 담치 기원의 빈산소환경 대응 유전자 지표 발굴 - 지중해담치의 빈산소환경 노출에 의한 치사율 결정
- 지중해담치의 빈산소환경 대응 유전자 지표 발굴 및 지표들의 기능 고찰 7. 빈산소 조건에 노출된 성게의 생물학적 반응
- 빈산소에 노출된 성게의 초기 배발생 분석
- 빈산소에 노출된 성게의 coelomocytes 구성 세포 조성의 변화 - 빈산소에 노출된 성게 gonad에서 HSP70 단백질 발현 변화 분석
- 성게 DNA microarray 제작 및 빈산소에 노출된 성게에서 유전자 변화 확인 및 발현량 분석
8. 빈산소 환경으로 인한 어류의 생리/화학적 영향연구 - 국내 연안서식어종에서 빈산소 반응 생화학지표의 구축
- 용존산소농도에 따른 가막만 서식 어류에서 빈산소 영향 모니터링
IV.
연구개발 결과
1. 가막만의 퇴적환경과 지화학적 특성
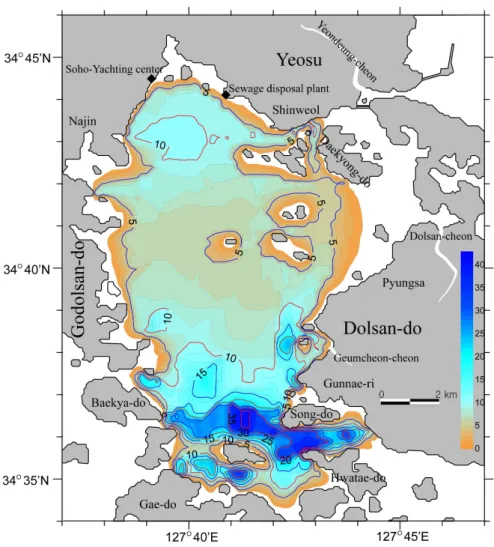
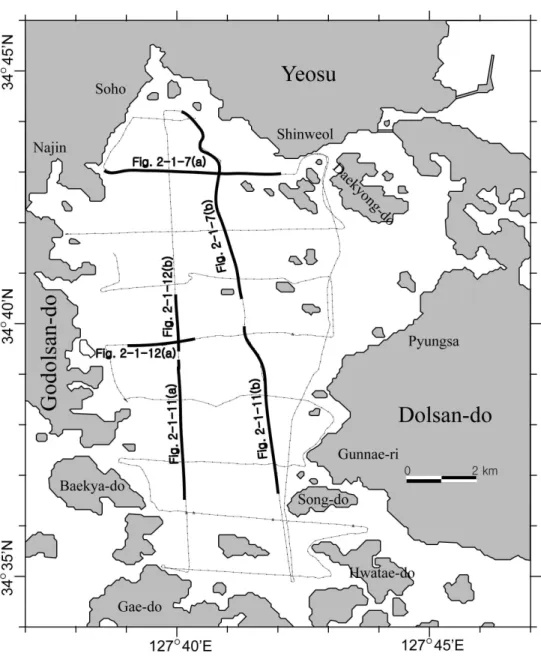
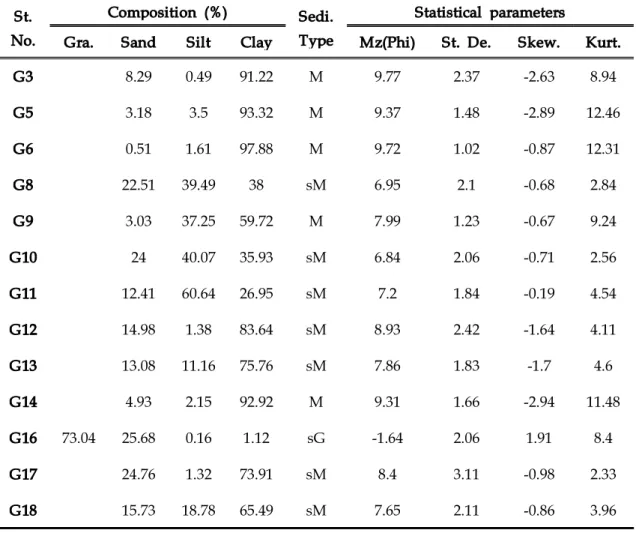
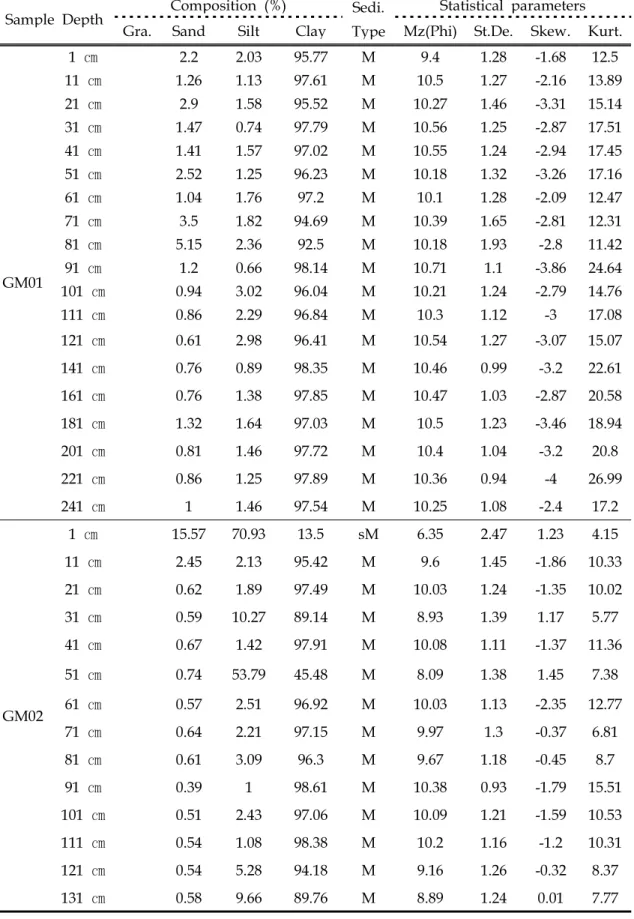
가막만 표층퇴적물의 입도는 주로 6.3∼9.7Φ의 분포를 보이고, 퇴적물은 니질과 실트로 구성되어 있으며, 내만으로 갈수록 입도가 감소한다. 고해상도 탄성파 자료 에서 나타나는 가막만의 층서는 하부 경계면인 음향기반암 위로 2개의 퇴적층서, Unit Ⅰ과 Ⅱ로 구성되며 이들 층서는 중간 반사경계면에 의해 구분된다. 음향기반 암은 평균 해수면 아래 약 20 m에서부터 최대 40 m 깊이에서 나타나며 남쪽으로 갈수록 깊어진다. 하위 퇴적층서인 Unit Ⅰ의 발달양상은 수로를 피복하는 형태로 발달하고 있으며, 해침동안 퇴적된 조간대환경으로 해석된다. 중간 반사경계면은 평 균 해수면 아래 약 15 m에서부터 28 m 깊이에서 나타난다. 상위 퇴적층서인 Unit
Ⅱ는 남쪽으로 전진구축하는 퇴적양상을 보인다. Unit Ⅱ는 해수면이 현재의 위치 에 도달했던 지난 6,000년 이후에 퇴적되었다. Unit Ⅱ 퇴적물의 기원은 섬진강에서 공급된 부유퇴적물의 퇴적결과로 사료된다. 천부가스층이 Unit Ⅱ 퇴적층 내에 분 포하고 있다. 가스층은 주로 퇴적물이 두껍게 쌓인 퇴적중심지에 밀집되어 분포한 다. 가스층 발달은 퇴적물내의 유기물 분해에 의한 메탄가스이며 이는 해양생태환 경에 영향을 미칠 것으로 예상된다.
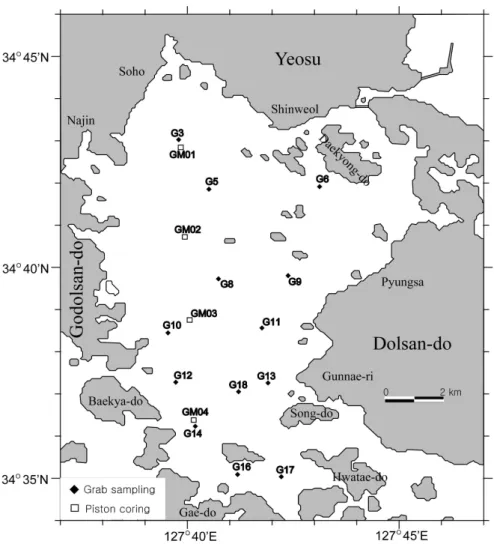
가막만 표층퇴적물의 유기탄소 함량은 만의 안쪽이 높고 외해 쪽으로 갈수록 낮 아지는 경향을 보이며, 만의 안쪽 퇴적물에는 육성기인 유기물이 포함되어 있다. 빈 산소가 빈번하게 발생하는 정점 3의 시추퇴적물에 기록된 탄산칼슘 함량의 분포는 이 지역에서 과거 수 백 년 전부터 빈산소가 발생하였을 것이라 추측할 수 있다.
정점 3과 17에서 챔버로 퇴적물 배양실험을 한 결과, 퇴적물 산소소모율은 3.3~12.4 mmol m-2 d-1 범위였고, 산소소모율은 수온에 가장 큰 영향을 받는 것으로 보인다.
산소가 모두 고갈되어 저층이 무산소로 바뀌면 유독성의 황화수소가 약 1.3 mmol m-2 d-1로 용출되어 나왔다.
2. 가막만의 물리해양학적 특성
조석, 조류, 부표추적 등 해수유동 관측을 통하여 가막만 조석, 조류의 특성을 파 악하였으며 2년 동안의 계절별 CTD 조사를 통하여 가막만의 수온, 염분, 용존산소, pH 등 해수특성의 계절 변동 특성을 파악 하였다. 또한 해수유동 수치모델링을 통 하여 만 내 해수순환의 특성을 파악하였으며 X-Z 2차원 이상 수조에서 물리-생태 계 결합 모델을 수립하여 빈산소 발생 기작을 실험하였다.
약 한달 반 동안의 3개 정점 조석 관측에서 조위 변화는 모두 ±2 m 이내의 변 화를 보였으며, 만 중앙부에서 2010년 5월 27∼28일 약 2일 동안 실시된 유속관측 에서는 최대유속 58 cm/s로 남북 방향 왕복성 조류의 특징을 나타냈다. 2010년 5월 27일 낙조시 4시간 동안 만 입구와 가까운 중앙부에서 실시된 부표추적에서 나타난 평균 유속은 약 60 cm/s로 조류 관측 결과와 비슷하였다. CTD 조사에서는 5월과 8월 만 북단 부근의 저층에서 빈산소가 발생하는 것으로 나타났다.
ESCORT 모형을 사용하여 만 내 주요 지점의 최강 유속을 산출하였다. 가막만 남측 입구부근에서 1 m/s 이상의 최강유속을 보였으며, 개도-월호도 수로에서 2.1 m/s 이상으로 가장 크게 나타났다. 가막만 북쪽에 위치한 여수해협에서도 약 1.0 m/s로 크게 나타났다. 만내에서는 대체로 0.6 m/s 이하의 유속을 보이며, 가막만 내의 북부지역 최대 조류속은 약 6.4 cm/s로 매우 약하였다.
물리(ESCORT)-생태계(ERGOM) 결합모델을 사용한 X-Z 2차원 이상 수조 실험 에서는 조석, 바람에 따른 빈산소 발생 양상을 재현하였다. 연구사업이 종료되어 실 해역에 적용할 수 없었으나 개발된 물리-생태계 결합모델은 향후 연안해역 생태계 모델링 연구에 유용하게 활용될 것이다.
3. 빈산소해역의 퇴적물에서 석회질 와편모조류 시스트
일반적으로, 해산 식물 플랑크톤은 해양산성화에 내성을 가진 것으로 알려져 있 다. 하지만, 본 연구결과는 연안역의 빈산소해역에서 유발된 산성화 환경에서 그들 의 생존이 위협을 받고 있다는 것을 나타낸다. 본 연구팀은 빈산소환경이 자주 발 생하는 가막만의 퇴적물에서 석회질 와편모조류 시스트 Scrippsiealla trochoidea의 형태 변화를 관찰하였고, 이러한 형태적 변화는 저층의 용존산소 감소와 함께 나타 나는 pH의 감소, 즉 빈산소 해역에서 나타나는 산성화 환경이 원인이라는 것을 실 내 실험을 통해 확인 할 수 있었다. 실내실험 결과에 따르면, Scrippsiealla trochoidea의 석회질 돌기물은 pH 7.39의 낮은 값에서도 용해되지 않았는데, 이 결 과는 빈산소 해역에서는 특정시기에 pH 7.39 이하에 도달하여 Scrippsiealla
trochoidea의 석회질 돌기물을 용해 시킨다는 것을 의미한다. 하지만, 산성화 환경
에서 형태적 변화가 나타난다 할지라도 발아능과 같은 생리적 특성에는 영향을 미
치지 않는 것으로 나타났다. 와편모조류 시스트에게 돌기물의 형성은 생태학적으로 큰 의의를 가지는데, 돌기물의 용해로 인한 개체군의 변동과 생태계 영향은 향후 진행되어야 할 연구과제로 판단된다.
4. 요각류의 난 부화에 대한 빈산소의 영향
우리나라의 부영양화된 내만 해역에서 빈산소 수괴는 여름철에 빈번하게 발생한 다. 이 연구는 seabed에 존재하는 요각류 난의 부화율에 대한 빈산소 수괴의 영향 을 평가하기위해 진행되었다. 요각류 난의 현장(in situ) 부화율 실험은 고안된 PET Chamber (Plankton Emergence Trap/Chamber)를 남해 가막만의 빈산소해역 (hypoxic zone)과 정상해역(normoxic zone)에 설치하여 매일 부화율을 체크하는 방 법으로 12일동안 수행하였다. 실험기간 동안, 용존산소는 정상해역에서 3.7 ~ 6.6 mg L-1 의 범위였고, 빈산소해역에서는 1.5 mg L-1 이하의 빈산소 상태를 지속적으 로 유지하였다. Sea bed 퇴적물의 pH (Sediment-water interface)는 빈산소해역과 정상해역에서 각각 7.4와 7.8로 측정되었다. 요각류 난의 밀도는 빈산소해역에서 약 300,000 eggs m-2 이상인 반면에 정상해역에서는 50,000 eggs m-2 이하를 보였다.
요각류 난의 부화 성공률은 빈산소해역과 정상해역에서 각각 평균 3.9%와 61%로 빈산소해역에서 현저히 낮았다. 또한, 비정상적인 난이 정상해역에 비해 빈산소해역 에서 상대적으로 풍부하였다. 이 연구의 결과는 빈산소 수괴 형성이 요각류 난의 부화율을 저하시키며 결국, 요각류 개체군 변동에 큰 영향을 미칠 수 있음을 시사 한다.
5. 대형저서동물
Hypoxic 해역에서는 봄철 기회종의 대량 출현으로 높은 서식밀도를 보였고, 여 름철 무생물 상태를 보인 후, 가을철 다시 종이 가입되는 패턴을 보였다. Hypoxic 해역에서는 오염지시종인 다모류의 Capitella capitata, 연체동물의 Theora fragilis, Musculus senhousia등이 우점하였다. Normoxic 해역의 대형저서동물은 계절 간 큰 변동을 보이지 않았고, 모든 계절에 단각류인 Eriopisella sechellensis가 우점하였 다. 2009년에는 7월에 hypoxia가 발생되어, 8월에 무생물 상태를 보였다. 2010년에 는 6월부터 8월까지 3개월간 hypoxia가 지속되었고, 7월부터 9월까지 무생물 상태 를 보였다. 2011년에는 초여름에 조사를 하지 않아 hypoxia가 시작된 정확한 시기 를 알 수 없으나, 8월에 무생물 상태를 보인 것으로 보아 늦어도 7월에는 hypoxia 가 시작된 것으로 판단된다. Hypoxia가 발생 된 후 1개월 이내 모든 대형저서동물 이 사멸하며, 저층 용존산소가 회복되어도 재 가입되는데 한 달 이상의 기간이 소 요된다. Hypoxia의 지속기간은 대형저서동물의 재가입 및 정착에도 영향을 미쳐, 이듬해 봄의 군집에 까지 영향을 주는 것으로 나타났다.
6. 담치 기원의 빈산소환경 대응 유전자 지표 발굴
수생 환경에 영향을 미치는 빈산소의 발생은 세계적으로 보고되어 있으며 빈산 소가 발생하는 주요 원인으로는 연안 생태계에 심각한 영향을 끼치고 있는 부영양 화를 들 수 있다. 산소가 고갈된 환경에 노출된 해양 생물에서 분자 수준의 변화를 알아보기 위해 담치종인 Mytilus galloprovincialis를 산소 결핍이 일어난 상태와 자 연 상태의 산소 농도에 노출한 후 핵산을 추출하였다. 두 조건의 핵산을 differential display polymerase chain reaction(DD-PCR)을 수행하여 빈산소 환경에서 발현량이 증가하거나 감소하는 유전자를 조사하였다. 비교군에 비해 빈산소 환경일 때 발현 량이 변화하는 유전자는 총 107 개였으며 빈산소의 영향을 알아보기 위해 유전자를 기능적으로 분류하였다. Information storage and processing, cellular processes and signaling, metabolism, predicted general function only 그리고 function unknown이라는 다섯 개의 범위로 나누었다. 발현량이 변한 대부분의 유전자는 cellular processes and signaling에 속하였으며 이것들의 일부는 signal transduction mechanism, posttranslational modification 그리고 chaperone function 과 관련되어 있었다. DD-PCR에서 변화를 보인 10개의 유전자(encoding elongation factor 1 alpha, heat shock protein 90, calcium/calmodulin-dependent protein kinase II, GTPase-activating protein, 18S ribosomal RNA, cytochrome oxidase subunit 1, ATP synthase, chitinase, phosphoglycerate/bisphosphoglycerate mutase family protein, and the nicotinic acetylcholine receptor)를 골라 quantitative RT-PCR을 수행하였고 24~72 시간 동안 빈산소에 노출된 담치에서 전사된 유전자 의 변화를 확인하였다. 본 연구의 결과로 빈산소 환경에 적용할 수 있는 지표 유전 자를 찾았으며 또한 바다에 사는 이매패류가 산소가 고갈이 되었을 때 분자수준에 서 어떤 영향을 받는지에 대한 정보를 알 수 있었다.
7. 빈산소 조건에 노출된 성게의 생물학적 반응
수정란을 빈산소상태에 노출시켰을 경우 blastula 이후 정상적인 원장함입 등이 일어나지 않는 등 더 이상 발생이 진행되지 않았다. 빈산소 처리 후 24시간부터는 산소의 고갈에 따른 coelomocytes의 red spherule 세포의 급격한 증가를 확인하였 다. 빈산소에 의해 스트레스 증가시 HSP70 과 glutathione reductase 의 발현이 증가하는 현상을 확인하였다. 마이크로어레이 결과에 의해 빈 산소에 노출된 성게 의 경우 RNA processing, Transcription, cell cycle, defence mechanism 관련 유 전자들이 저해 되는 것을 확인하였다.
8. 빈산소 환경으로 인한 어류의 생리/화학적 영향연구
본 연구에서는 국내 해산어(조피볼락과 문치가자미)에 대한 빈산소 반응지표를 구축하고 노출시간에 따른 반응확인, 빈산소 환경 민감도(조피볼락>문치가자미)를 확인하였다. 2010년에 일부 가두리에서 9월까지 저층의 용존산소 농도가 낮았고(4.6
mg/L), 이때 생체내 HIFa mRNA 발현이 일시적으로 높았으나 혈중 glucose 농도 와 성 스테로이드 호르몬 농도는 통계적으로 유의한 차이가 없었다. 2011년 8월 가 두리의 F2정점과 10월에는 F3정점에서 HIFa mRNA 와 혈중 glucose 농도가 높게 발현된 결과를 보였다. 성 스테로이드 호르몬의 농도는 조사기간 동안 지역간 유의 한 차가 없었다. 본 연구결과를 통해 가막의 현장이나 가두리 서식어의 빈산소 노 출로 인한 생화학적 반응은 매우 낮았을 뿐 아니라, 생식내분비계에 미치는 영향도 매우 미미한 것으로 생각되어진다.
V.
연구개발 결과의 활용계획
1. 가막만의 퇴적환경과 지화학적 특성
- 육성기인 또는 인간의 활동에 의해 가막만으로 유입되는 유기물 관리 방안 제시 - 산소가 완전히 고갈된 후 발생할 수 있는 현상 예측
2. 가막만의 물리해양학적 특성
- 물리-생태계 결합모델은 향후 연안해역 생태계모델링 연구에 유용하게 활용될 것 임
3. 빈산소해역의 퇴적물에서 석회질 와편모조류 시스트
- 빈산소 해역 형성에 따른 일차생산자 개체군 구조의 변화 예측에 활용 4. 요각류의 난 부화에 대한 빈산소의 영향
- 빈산소 해역 형성에 따른 일차소비자 개체군 구조의 변화 예측에 활용 5. 대형저서동물
- 연안역에서 여름철 빈산소 수괴형성에 따른 저서생태계 피해 정도를 예측 - 빈산소 수괴 형성 시기 및 지속기간에 따른 대형저서동물의 군집 조성을 예측 - 연안의 저서생물 서식지 회복과 복원 연구의 기초 자료로 활용가능
6. 담치 기원의 빈산소환경 대응 유전자 지표 발굴
- 빈산소 노출에 대한 해양생물의 분자생물학적 반응 이해의 기초자료로 활용 7. 빈산소 조건에 노출된 성게의 생물학적 반응
- 빈 산소에 의한 반응기작을 이해함으로써 해양 오염 관리에 활용가능 - 빈 산소에 의한 노출을 확인할 수 있는 바이오마커를 확립
8. 빈산소 환경으로 인한 어류의 생리/화학적 영향연구
- 구축된 생화학적 지표를 활용한 해양오염과 빈산소 환경 복합노출 연구등을 통 해 해양 환경관리분야에 유용한 자료로 기여
SUMMARY
I. Title
Ecological responses in the hypoxic condition in southern coast of Korea for ecosystem management
II. Objectives of the study
1. Sedimentary environment and geochemical characterization in Gamak Bay - Analysis of sedimentary environment characterization can understand the
hypoxic area characterization and change process, and being necessary for the determine of effects to the ecological environment of the benthic organism - Measuring the sediment oxygen consumption rate for the understand of
fundamental reason in which hypoxia developed
- The understand of environmental pollutants eruption from sediment during hypoxia being necessary for prediction to the effects of ecosystem
2. Physical Oceanography in Gamak Bay
- Aims to catch which physical environmental factors of Gamak Bay are responsible for the summer season hypoxia in the bay through the oceanographic survey and start a first step to set up a coupled hydrodynamic-ecosystem model using the observed data
3. Biological response of calcareous dinoflagellate cysts in sediments of hypoxic zone
- To investigate the effects of acidic environments of the hypoxic zone on calcareous dinoflagellate cysts, Scrippsiealla trochoidea
4. Impacts of hypoxia on hatching success of copepod eggs
- To analyze impacts of hypoxia on hatching success of copepod eggs 5. Macrobenthic fauna
- To check the responses of macrobenthic fauna due to hypoxia
- To see the changes in the community structure of macrofauna before and after hypoxia
6. Mining of hypoxia responsive gene biomarkers in Mytilus galloprovincialis - Very few information is available on molecular biological responses in marine
organisms
- Thus, the mining of hypoxia responsive gene biomarkers in M. galloprovincialis, a representative bivalves fishery industry in Korea and functional consideration of hypoxia responsive gene biomarkers in M. galloprovincialis are necessary
7. Biological responses in hypoxic condition exposed sea urchin
- Response research of sea urchin and development of biomarker in hypoxic condition
8. Biochemical response of fish to hypoxia
- To assess exposure of resident fish from Gamak-bay to hypoxia
- To determine the biochemical impacts on fish reproductive system and biochemical response
III. Contents and scopes of the study
1. Sedimentary environment and geochemical characterization in Gamak Bay - Analyses of sea bottom morphology and development of stratigraphic
sequences
- Analyses of sediment facies and distribution of organic matter in sediments - Observation of sediment oxygen consumption rate and benthic eruption of
pollutants
2. Physical Oceanography in Gamak Bay
- Characterization of the tide and current in Gamak Bay
- Characterization of seasonal variation of the hydrography in Gamak Bay - Development of hydrodynamic(ESCORT)-ecosystem(ERGOM) model
3. Biological response of calcareous dinoflagellate cysts in sediments of hypoxic zone
- Morphological changes of calcareous dinoflagellate cysts in surface sediments of hypoxic zone
- pH levels and morphological changes of calcareous dinoflagellate cysts
- Germination ratios of calcareous dinoflagellate cysts collected in hypoxic and normoxic zone
- Germination capibility of naked type cysts
4. Impacts of hypoxia on hatching success of copepod eggs
- Environmental monitoring of seabed in hypoxic and normoxic zone
- Analysis of in situ hatching rate of copepod eggs in hypoxic and normoxic zone
- Effects assessment of oxygen and pH on hatching rate of copepod eggs 5. Macrobenthic fauna
- Macrobenthic organisms were collected seasonally at 20 sites in Gamak Bay for the estimation of benthic community structure in hypoxic and normoxic zone
- Macrobenthic organisms were collected monthly at 5 sites in Gamak Bay for the estimation of benthic community structure before and after hypoxia
6. Mining of hypoxia responsive gene biomarkers in Mytilus galloprovincialis - Determination of mortality after exposed to hypoxic condition in M.
galloprovincialis
- Mining and functional consideration of hypoxia responsive gene biomarkers in M. galloprovincialis
7. Biological responses in hypoxic condition exposed sea urchin
- Analysis of early embryogenesis in sea urchins exposed to hypoxia - Changes of coelomocytes composition in sea urchins exposed to hypoxia - Comparison of HSP70 expression rate in sea urchin gonad exposed to
hypoxia
- Sea urchin DNA microarray production and identification of gene expression pattern in sea urchins exposed to hypoxia
8. Biochemical response of fish to hypoxia
- Hypoxia biochemical makers were constructed from Korean coastal habitant (Rockfish and Marbled flounder
- Monitored the hypoxic effects of the resident fish from the Gamak Bay depends on dissolved oxygen(DO) concentration
IV.
Results
1. Sedimentary environment and geochemical characterization in Gamak Bay
The mean grain size and sediment type of surficial sediment are 6∼9Φ and silt through clay, respectively. The seismic sedimentary sequence overlying acoustic basement can be divided into two depositional units (Unit Ⅰ and Ⅱ) bounded by a prominent mid-reflector. The acoustic basement occurs at the depth between 20 m and 40 m below the mean sea level and deepens gradually to southward. The Unit Ⅰ mostly occupying the channel-fill facies can be interpreted as tidal environment deposits during transgression. Mid-reflector appears within the sedimentary sequence at the depth of about 15∼28 m below the sea level. The upper layer Unit Ⅱ shows the progradational pattern towards southward. Unit Ⅱ was deposited during the last 6,000 yrs when sea level was close to the present level. Origin of the Unit Ⅱ sediment is speculated as a result of accumulating suspended sediments derived from the Seomjin River.
The Unit Ⅱ is characterized by the shallow gas in the sediment coinciding with thick sedimentation area. The shallow gas mostly consisting of methane gases will be influence the marine ecosystem.
The organic carbon content of Gamak Bay surface sediment displays the tendency that inner bay is high organic carbon content and it is decreased with off-shore. A terrestrial originated organic matter deposited in inner bay. The vertical profiles of calcium carbonate (CaCO3) content at piston core sediment assumed that frequently occurrence of hypoxia have been during past several century in inner Gamak Bay. In the sediment incubation experiment with chamber, the sediment oxygen consumption rate ranged from 3.3 mmol m-2 d-1 to 12.4 mmol m-2 d-1 in sites 3 and 17. When the completely depletion of oxygen, the toxic hydrogen sulfide was erupted with its flux was about 1.3 mmol m-2 d-1.
2. Physical Oceanography in Gamak Bay
A series of hydrographic survey such as long-term mooring of instruments for tide and currents observation and several buoy tracking experiments, and seasonal CTD observations (February, May, August, November) for about 30 points gave us rough information on the characteristics of tide and tidal currents and seasonal variations of temperature, salinity, dissolved oxygen and pH, respectively, in Gamak Bay. A sketchy tidal circulation pattern in the bay was revealed by two-dimensional and three dimensional hydrodynamic numerical modeling for the observed tidal input, and hypoxia mechanism was also simulated through coupled hydrodynamic-ecosystem modeling in the idealized X-Z two-dimensional basin.
All of the observed tide data for about one and half months at three points gave the tide level variation limited to ±2 m. The observed tidal currents at the central part of the bay for two days (May 27∼28, 2010) was the reversing type with the maximum speed of 58 cm/s. Tracking three buoys with different wing depth at the same point between the bay center and the southern bay mouth for about four hours in the ebb tide (May 27, 2010) showed similar velocity with the average speed of about 60 cm/s. In the observed CTD data of spring(May) and summer(August), hypoxia (low dissolved oxygen) occurred at the bottom of the northernmost part of the bay.
The maximum speeds at the major points in the bay were computed through hydrodynamic modeling for the tide using ESCORT model. The maximum speeds at the points around the southern bay mouth were over about 1 m/s and it reached 2.1 m/s at the point between the Gaedo and Wolhodo islands. The maximum speed at the point of the Yeosu Channel was calculated as about 1 m/s. And the maximum speed in the northern part of the bay was very small, below 6.4 cm/s and it was below 0.6 m/s in the rest part.
The coupled hydrodynamic (ESCORT) - ecosystem (ERGOM) model was developed in this study and used to simulate the independent and combined effects of tide and wind on hypoxia occurrence in the idealized X-Z two-dimensional basin. The ESCORT-ERGOM modeling system could not be applied to the real domain due to unexpected close of this project, however, it will be useful to other coastal ecosystem projects in the future.
3. Biological response of calcareous dinoflagellate cysts in sediments of hypoxic zone
Phytoplanktons in coastal regions are generally known to have a tolerance to ocean acidification. However, we identified that their survival is being threatened by acidic environments in the hypoxic zone, and present the evidence here. In natural sediments of hypoxic zone, morphological changes of Scrippsiella trochoidea cysts were observed, which were caused by acidic conditions in sediments and have been proven by hypoxia-induced acidification experiments.
The calcareous spines of cysts could endure quite low pH levels (pH7.39), suggesting that the seed populations in the hypoxic zone are already experiencing extremely acidic environments. After experinencing the intense acidic environments, the cysts without calcareous spines had the capability to
germinate however can be linked to mortality, due to aerobic and anerobic decay. Consequently, we suggest that the changes in planktonic community structure and the reduction in biodiversity in the hypoxic zone will result..
4. Impacts of hypoxia on hatching success of copepod eggs
In summer, the hypoxic zone is often found in the eutrophic coastal area.
This study was carried out to assess the impact of hypoxia on copepod egg hatching. In situ egg hatching experiments were carried out using a revised PET Chamber (Plankton Emergence Trap/Chamber) in Gamak Bay in southern Korea, where a hypoxic zone frequently formed in summer. The PET Chamber was installed in the hypoxic and normoxic zones, and experiments were performed over 12 days. Dissolved oxygen concentrations were below 1.5 mg L-1 in the hypoxic zone and 4.0 ~ 6.8 mg/L in the normoxic zone during the experimental period. The pH in the seabed of the hypoxic and normoxic zones was 7.4 and 7.8, respectively. The density of eggs in the seabed of the hypoxic and normoxic zones was about 300,000 and below of 50,000 eggs/m2, respectively. The hatching rate ranged from 3.7 to 4.0% in the hypoxic zone and from 55 to 67% in the normoxic zone. Also, eggs of abnormal form were abundant in the hypoxic zone compared with the normoxic zone. The results suggest that expansion of the hypoxic zone may have important repercussions on population and community dynamics in coastal systems.
5. Macrobenthic fauna
The mean species richness and density were the highest in spring for the appeared mass opportunistic species, the azoic condition in summer, recruitment in autumn at hypoxic zone. The dominant species were Capitella capitata (polychaeta), Theora fragilis, Musculus senhousia (bivalve) in hypoxic zone.
Macrobenthic community did not show significant variation between seasons in normoxic zone. The dominant species were Eriopisella sechellensis (amphipoda), T. fragilis (bivalve) in normoxic zone. Hypoxia occurred in July, 2009 then a month later (August) became azoic. From June to August in 2010 by hypoxia lasted for three months, from July to September was azoic. Azoic condition in August, 2011, so hypoxia would be formed in July, 2011. Hypoxia is formed within one month all organisms are killed, bottom dissolved oxygen concentration, which recovered more than a month will take a recruitment.
Duration of hypoxia have affected the recruitment and settlement of
macrobenthos until spring of following year.
6. Mining of hypoxia responsive gene biomarkers in Mytilus galloprovincialis Hypoxic events affecting aquatic environments have been reported worldwide and the hypoxia caused by eutrophication is considered one of the serious threats to coastal marine ecosystems. To investigate the molecular-level responses of marine organisms exposed to oxygen depletion stress and to explore the differentially expressed genes induced or repressed by hypoxia, differential display polymerase chain reaction(DD-PCR) was used with mRNAs from the marinemussel, Mytilus galloprovincialis, under oxygen depletion and normal oxygen conditions. In total, 107 cDNA clones were differentially expressed under hypoxic conditions relative to the control mussel group. The differentially expressed geneswere analyzed to determine the effects of hypoxia.
They were classified into five functional categories: information storage and processing, cellular processes and signaling, metabolism, predicted general function only, and function unknown. The differentially expressed genes were predominantly associated with cellular processing and signaling, and they were particularly related to the signal transduction mechanism, posttranslational modification, and chaperone functions. The observed differences in the DD-PCR of 10 genes (encoding elongation factor 1 alpha, heat shock protein 90, calcium/calmodulin-dependent protein kinase II, GTPase-activating protein, 18S ribosomal RNA, cytochrome oxidase subunit 1, ATP synthase, chitinase, phosphoglycerate/bisphosphoglycerate mutase family protein, and the nicotinic acetylcholine receptor) were confirmed by quantitative RT-PCR and their transcriptional changes in the mussels exposed to hypoxic conditions for 24–72 h were investigated. These results identify biomarker genes for hypoxic stress and providemolecular-level information about the effects of oxygen depletion on marine bivalves.
7. Biological responses in hypoxic condition exposed sea urchin
- Analysis of early embryogenesis in sea urchins exposed to hypoxia
Confirmation of embryogenesis inhibition in hypoxia exposed urchin embryo - Changes of coelomocytes composition in sea urchins exposed to hypoxia
Increasing of red spherule cell in urchin coelomocytes by hypoxia stress
- Comparison of HSP70 and glutathione reductase expression rate in sea urchin gonad exposed to hypoxia
Verification of HSP70 and glutathione reductase gene expression in urchin by
hypoxia stress
- Identification of gene expression rate in hypoxia exposed urchin by microarray analysis and development of hypoxia related biomarker
Confirmation of RNA processing, Transcription, cell cycle, and defence mechanism related genes reduction in hypoxia exposed urchin coelomocytes by microarray analysis and qReal-time PCR
8. Biochemical response of fish to hypoxia
In the study, hypoxia inducible biochemical markers were constructed for Korean coastal habitant (Rockfish and Marbled flounder) and compared the specificity and sensitivity in both species depends on exposure time and dissolved oxygen(DO) concentration. Hypoxia inducible factor a(HIFa) mRNA significantly was induced in fish from aquafarm F2 in Gamak-bay but there was no variation of plasma glucose concentration and sex steroid hormone concentration in 2010. HIFa mRNA expression and plasma glucose concentration were increased in fish from aquafarm F2 (in August 2011) and F3 (in October 2011). In resident fish, HIFa mRNA expression was higher on fish from inner site of Gamak-bay than fish from outer sites of Gamak-bay. However, there was no significant difference of plasma glucose concentration and sex steroid hormone concentration in 2011. The result suggests that significant biochemical responses of hypoxia were showed in a lot of laboratory studies but it seems that resident fish from Gamak-bay has low effects on biochemical responses and reproductive system from hypoxia.
V.
Application plans of the results of the study
1. Sedimentary environment and geochemical characterization in Gamak Bay - To support for management plan of anthropogenic organic matter
- To provide a prediction of phenomenon after oxygen depletion 2. Physical Oceanography in Gamak Bay
- The ESCORT-ERGOM will be useful to other coastal ecosystem projects in the future
3. Biological response of calcareous dinoflagellate cysts in sediments of hypoxic zone
- Estimation of population size changes in primary producers during the hypoxic zone formation
4. Hypoxic effects on egg hatching in copepod
- Estimation of population size changes in primary consumers during the hypoxic zone formation
5. Macrobenthic fauna
- For the assessment of the benthic faunal damages due to the summer hypoxia - For the basic information on the benthic habitat recovery and restoration - For the prediction of the macrobenthic faunal community structures from the
timing and duration of the hypoxia
6. Mining of hypoxia responsive gene biomarkers in Mytilus galloprovincialis - For the basic information for the understanding molecular biological responses
to hypoxic condition in marine organisms
7. Biological responses in hypoxic condition exposed sea urchin
- Utilization of marine pollution control through hypoxia response mechanism - Development of hypoxia related biomarker
8. Biochemical response of fish to hypoxia
- Combined effects between marine pollution and hypoxia using the biochemical markers should be emphasized to focus on the marine environmental management
CONTENTS
Chapter 1. Introduction ···1
Chapter 2. States of technical trends and outlook ···2
Chapter 3. Results of the study ···3
Section 1. Sedimentary environment and geochemical characterization in Gamak Bay ···3
1. Sedimentary environment in Gamak Bay ···3
A. Introduction ···3
B. Materials and methods ···4
(1) Surface sediment sampling and analyses ···4
(2) Core sediment ···6
(3) Seismic investigation ···7
C. Results ···8
(1) Characterization of surface sediment distribution ···8
(2) Characterization of core sediment ···10
(3) Characterization of sedimentary sequence ···17
D. Conclusion ···23
2. Sediment oxygen consumption rate and hydrogen sulfide eruption in Gamak Bay ···24
A. Introduction ···24
B. Materials and methods ···25
(1) Sediment sampling ···25
(2) Sediment anlyses ···26
(3) Sediment incubation ···26
C. Results and discussion ···26
(1) Sediment analyses ···26
(2) Sediment oxygen consumption rate ···29
(3) Hydrogen sulfide eruption ···36
D. Conclusion ···37
Section 2. Physical oceanography in Gamal Bay ···38
1. Background of the study ···38
A. Basic information of the survey area ···38
B. Tide and current of the survey area ···39
C. Water quality of the survey area ···40
2. Method of the study ···43
A. Field observation ···43
B. Hydrodynamic modeling ···48 C. Ecosystem modeling ···54 3. Results and discussion of the study ···61 A. Results of the observation ···61 B. Results of hydrodynamic modeling ···84 C. Results of ecosystem modeling ···90 4. Discussion ···90
Section 3. Biological response of calcareous
dinoflagellate cysts in sediments of hypoxic zone ···93
1. Introduction ···93 2. Materials and methods ···94 3. Results and discussion ···97
Section 4. Impacts of hypoxia on hatching success of copepod eggs ···107
1. Introduction ···107 2. Environmental monitoring of seabed ···108 A. Materials and methods ···108 B. Results and discussion ···111 3. I n situ hatching rate of copepod eggs ···115 A. Materials and methods ···115 B. Results and discussion ···117 4. Effects of oxygen and pH on hatching rate of copepod eggs ···120 A. Materials and methods ···120 B. Results and discussion ···122
Section 5. Macrobenthic fauna ···127
1. Introduction ···127 2. Materials and methods ···127 A. Benthic environments ···127 B. Macrobenthos sampling and data analysis ···128 3. Results and discussion ···129
A. Macrobenthic faunal community structures of hypoxic and normoxic zone (seasonal variation) ···129 B. Macrobenthic faunal community structures before and after hypoxia
(monthly variation) ···143 4. Conclusions ···156
Section 6. Mining of hypoxia responsive gene
biomarkers in M ytilus galloprovincialis ····
···157
1. Introduction ···157 2. Materials and methods ···158 A. Mussels and hypoxic stress exposure ···158 B. Total RNA extraction ···158 C. First-strand cDNA Synthesis ···159 D. ACP-based GeneFishing™™ PCR ···159 F. Gene ontology clustering ···160 G. Quantification of mRNA level by real-time quantitative RT-PCR (qRTPCR)
··· 160 H. Statistical analysis ···160 3. Results ···161
A. Differentially expressed genes in M. galloprovincialis exposed to hyoixa
···161 B. Quantification of gene expression by real-time quantitative RT-PCR
(qRT-PCR) ···167 4. Discussion ···171
A. Cellular process related genes expression in M. galloprovincialis exposed to hypoxia ···171 B. Metabolisms related genes expression in M. galloprovincialis exposed to
hypoxia ···173
Section 7. Biological responses in hypoxic condition exposed sea urchin ···175
1. Introduction ···175 2. Materials and methods ···177 A. Culture of Strongylocentrotus nudus···177 B. Early embryogenesis experiment ···178 C. Western blot ···178 D. Identification of color in colelomocytes ···179 E. Live and Dead assay ···179 F. Microarray ···180 G. Quantitative real-time PCR ···180 3. Results ···181 A. Analysis of early embryogenesis in sea urchins exposed to hypoxia ····181 B. Comparison of HSP70 and glutathione reductase expression rate in sea
urchin gonad exposed to hypoxia ···181 C. Changes of coelomocytes composition in sea urchins exposed to hypoxia
···182 D. Identification of gene expression rate in hypoxia exposed urchin by
microarray analysis ···184 E. Identification of hypoxia related gene expression in field sample by
qReal-time PCR ···187 4. Conclusion ···187
Section 8. Biochemical response of fish to hypoxia ···
···189
1. Background ···189 2. Materials and Methods ···189 A. Hypoxia biomarker ···190 B. Study of resident fish in Gamak-bay ···190 3. Results ···193 A. Biochmical change of fish exposed to Hypoxa in Laboratory ···193 B. Biochemical response in fish from Gamak-bay at 2010 ···194 C. Biochemical response in fish from Gamak-bay at 2011 ···198 4. Summary and Discussion ···201
Chapter 4. Achievements of objectives and contributions
to the related area ···202
Chapter 5. Application plans of the study results ···203
Chapter 6. References ···204
목 차
제 1 장 서 론 ···1 제 2 장 국내외 기술개발 현황 ···2
제 3 장 연구개발수행 내용 및 결과 ···3 제 1 절 가막만의 퇴적환경과 지화학적 특성 ···3
1. 가막만의 퇴적환경 ···3 가. 서론 ···3 나. 재료 및 방법 ···4 (1) 표층퇴적물 채취 및 분석 ···4 (2) 시추퇴적물 ···6 (3) 탄성파 탐사 ···7 다. 연구결과 ···8 (1) 표층퇴적물 분포 특성 ···8 (2) 시추퇴적물 특성 ···10 (3) 퇴적충서 발달 특성 ···17 라. 결론 ···23 2. 가막만에서의 퇴적물 산소소모율과 황화수소 용출 ···24 가. 서론 ···24 나. 재료 및 방법 ···25 (1) 퇴적물 시료 채취 ···25 (2) 퇴적물 분석 ···26 (3) 퇴적물 배양실험 ···26 다. 결과 및 토의 ···26 (1) 퇴적물 분석 ···26 (2) 퇴적물 산소소모율 ···29 (3) 황화수소 용출 ···36 라. 결론 ···37
제 2 절 가막만의 물리해양학적 특성 ···38
1. 서론 ···38 가. 대상해역의 일반현황 ···38 나. 대상해역의 조석 및 해류 ···39 다. 대상해역의 수질특성 ···40
2. 연구방법 ···43 가. 현장관측 ···43 나. 해수유동 수치실험 ···48 다. 물리-생태계 수치실험 ···54 3. 결과 및 토의 ···61 가. 현장관측 결과 분석 ···61 나. 해수유동 수치실험 결과 ···84 다. 물리-생태계 수치실험 결과 ···90 4. 토의 ···90
제 3 절 빈산소해역의 퇴적물에서 석회질 와편모조류 시스트 93
1. 서론 ···93 2. 재료 및 방법 ···94 가. 연구해역 ···94 나. 환경 요인 측정 ···95 다. 와편모조류 시스트 채집 및 분석 ···96 라. 시스트 발아율 측정실험 ···96 마. 시스트의 산성화 환경 노출 실험 ···97 3. 결과 및 토의 ···97 가. 가막만의 해양환경 특성 ···97 나. 가막만의 빈산소 환경에서 석회질 와편모조류 시스트의 출현 ··· 98 다. 석회질 와편모조류 시스트 Scrippsiella trochoidea의 발아율 ···102
라. 석회질 와편모조류 시스트 Scrippsiella trochoidea의 형태적 변화에 영향을 주는
pH와 생태학적 의의 ···102 마. 가막만의 빈산소수역에서 출현하는 다양한 석회질 와편모조류 시스트 ···106
제 4 절 요각류의 난 부화에 대한 빈산소의 영향 ···107
1. 서론 ···107 2. Seabed의 환경 모니터링 ···108 가. 재료 및 방법 ···108 나. 결과 및 토의 ···111 3. 요각류 난의 현장 부화율 ···115 가. 재료 및 방법 ···115 나. 결과 및 토의 ···117 4. 요각류 난 부화율에 대한 산소 및 pH의 영향 ···120 가. 재료 및 방법 ···120 나. 결과 및 토의 ···122
제 5 절 대형저서동물 ···127
1. 서론 ···127
2. 재료 및 방법 ···127 가. 저서환경 ···127 나. 저서생물채집 및 자료분석 ···128 3. 결과 및 토의 ···129 가. Hypoxic 해역과 normoxic 해역의 군집구조 (계절적 변이) ···129 나. 빈산소 수괴 형성 전 후의 군집구조 (월별 변이) ···143 4. 결론 ···156
제 6 절 담치 기원의 빈산소환경 대응 유전자 지표 발굴 · 157
1. 서 론 ···157 2. 재료 및 방법 ···158 가. 담치 및 빈산소 환경 노출 ···158 나. Total RNA 추출 ···158 다. First-strand cDNA synthesis ···159 라. ACP-based GeneFishingTMPCR ···159 마. Gene ontology clustering ···160 바. Real-time quantitative RT-PCR(qRT-PCR)을 통한 mRNA의 정량화 ···160 사. Statistical analysis ···161 3. 결 과 ···161 가. 빈산소에 노출된 담치에서 발현량이 변한 유전자들 ···161 나. Real-time quantitative RT-PCR을 통한 유전자 발현의 정량화 ···167 4. 토 의 ···171 가. 빈산소 환경에 노출된 담치에서 Cellular process에 관련된 유전자의 발현 ···· 172 나. 빈산소 환경에 노출된 담치에서 Metabolisms에 관련된 유전자의 발현 ···173
제 7 절 빈산소 조건에 노출된 성게의 생물학적 반응 ··· 175
1. 서 론 ···175 2. 재료 및 방법 ···177 가. 성게 배양 ···177 나. 초기 배 발생 실험 ···178 다. Western blot ···178 라. 성게 체강세포의 색 변화 ···179 마. Live and Dead assay ···179 바. Microarray 실험 ···180 사. Quantitative real-time PCR 반응 ···180 3. 결 과 ···181 가. 빈산소상태가 성게 초기 배 발생에 미치는 영향 ···181 나. 빈산소에 노출된 성게 gonad에서 HSP70 단백질 발현과 glutathione reductase양의
변화 분석 ···181 다. 빈산소에 노출된 성게의 coelomocytes 구성 세포 조성의 변화 ···182
라. 빈산소에 노출된 성게 성체를 이용한 microarray 실험 및 유전자 발현차이의 확인
···184 마. 빈 산소 상태로 장기간 노출되어져 있는 현장샘플을 이용하여 유전자의 발현차이
를 확인 ···187 4. 결 론 ···187
제 8 절 빈산소 환경으로 인한 어류의 생리/화학적 영향연구
···189
1. 서 론 ···189 2. 재료 및 방법 ···190 가. 어류의 빈산소 노출 반응 생체지표 ···190 나. 가막만 유용 수산 어류의 빈산소 영향 조사 ···191 3. 결 과 ···193 가. 실험실 빈산소 환경에 노출된 어류의 생리화학적 반응 ···193 나. 2010년 가막만 유용 수산 어류의 빈산소 영향 ···194 다. 2011년 가막만 유용 수산 어류의 빈산소 영향 ···198 4. 토 의 ···201
제 4 장 연구개발목표 달성도 및 대외기여도 ···202
제 5 장 연구개발결과의 활용계획 ···203
제 6 장 참고문헌 ···204
표 목 차
표 3-1-1. 가막만 표층퇴적물의 조직과 평균입도 ···10 표 3-1-2. 가막만 시추코어 퇴적물의 조직과 평균입도 ···12 표 3-2-1. 여수의 조화 및 비조화상수 ···40 표 3-2-2. 여수해역의 수질 특성 ···43 표 3-2-3. 해수 및 해수유동 특성 조사 내용 ···45 표 3-2-4. 개방경계의 수온조건 ···58 표 3-2-5. Phytoplankton rates ···59 표 3-2-6. Zooplankton rates ···59 표 3-2-7. Biogeochemical Process rates ···60 표 3-2-8. Further Parameters ···60 표 3-2-9. Stoichiometric ratios ···60 표 3-2-10. CTD 관측자료 정보 ···61 표 3-2-11. 표․저층의 수온 최대 및 최소값 ···63 표 3-2-12. 표․저층의 염분 최대 및 최소값 ···68 표 3-2-13. 표·저층의 용존산소 최대 및 최소값 ···75 표 3-2-14. T1 정점 조석 조화상수 ···78 표 3-2-15. T3 정점 조석 조화상수 ···79 표 3-2-16. 경계조건 보정값 ···86 표 3-2-17. 정점별 최강유속 ···89 표 3-4-1. 다양한 해역에서 관찰된 요각류의 난 밀도 현황 ···115 표 3-4-2. pH와 산소의 target 농도를 조절하기 위한 혼합가스의 실험 조건 ···121 표 3-5-1. Hypoxic 지역과 normoxic 지역에서 출현한 대형저서동물의 주요 우점 종 ···136 표 3-5-2. 정점 1에서 빈산소현상 발생기간 동안, 발생 전, 후 출현한 대형저서동물 우점종 및 서식밀도 (개체/m2) ···155 표 3-5-3. 정점 3에서 빈산소현상 발생기간 동안, 발생 전, 후 출현한 대형저서동 물 우점종 및
서식밀도 (개체/m2) ···155 표 3-6-1. 빈산소 노출에 의해 발현량이 변화된 지중해담치 유전자 목록 ···162 표 3-6-2. 빈산소 노출 담치의 정량 PCR을 위한 프라이머 염기서열 ···169 표 3-7-1. 마이크로어레이 분석을 통하여 확인된 유전자 및 발현차이를 확인하기 위한
primer의 제작 ···186
표 3-8-1. 2010년 조사정점의 수환경 측정결과 ···196 표 3-8-2. 2010년 조사지역 채집어류의 biomass 측정결과 ···196 표 3-8-3. 2011년 조사정점의 수환경 측정결과 ···197 표 3-8-4. 2011년 조사지역 채집어류의 biomass 측정결과 ···197
그 림 목 차
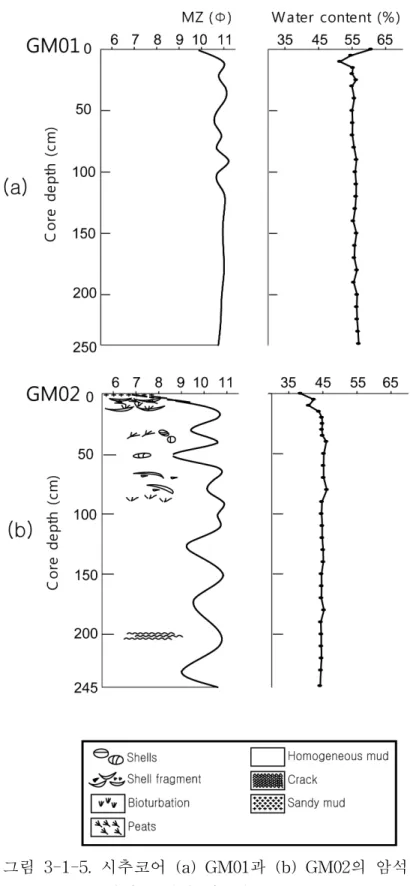
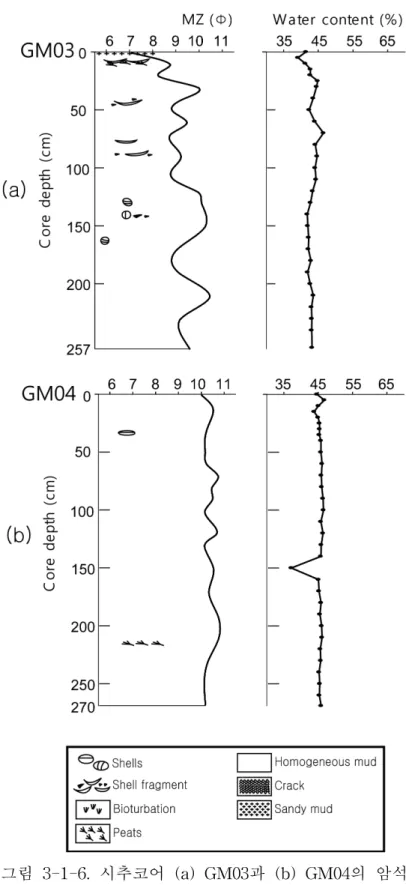
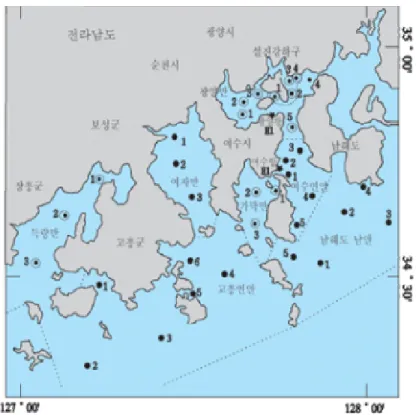
그림 3-1-1. 연구지역의 수심도. 등고선은 1 m 간격임 ···5 그림 3-1-2. 가막만의 시료채취 위치 ···6 그림 3-1-3. 연구지역의 고해상 탄성파 탐사 트랙 라인 ···8 그림 3-1-4. 표층퇴적물 퇴적상 분포도. M; 뻘, sM; 모래질 뻘, sG; 모래질 자갈 ···9 그림 3-1-5. 시추코어 (a) GM01과 (b) GM02의 암석학적 특성과 함수율 ··· 15 그림 3-1-6. 시추코어 (a) GM03과 (b) GM04의 암석학적 특성과 함수율 ··· 16 그림 3-1-7. 고해상 탄성파 단면도는 중간경계면을 따라 두 개의 층서단위 (단위과 II)를
나타낸다 ···17 그림 3-1-8. 평균해면으로부터 음향학적 기반암 깊이. 등고선의 간격은 1 m이다 ··· 18
그림 3-1-9. 가막만의 음향학적 기반암 위쪽의 퇴적물 두께. 퇴적물 내 음파의 도는 약
1500 m/s로 가정하였다 ···19
그림 3-1-10. 가막만의 음향학적 기반암 위쪽의 층서단위 II의 두께. 퇴적물 내 파의
속도는 약 1500 m/s로 가정하였다 ···20 그림 3-1-11. 두 개의 층서단위(I과 II)를 보여주는 고해상 탄성파 단면 ··· 21 그림 3-1-12. 음향학적 이상을 보여주는 고해상 탄성파 단면 ···22 그림 3-1-13. 퇴적물 내 가스가 함유된 구역의 분포도. 등고선은 해저에서 가스함유
구역까지의 깊이 ···22 그림 3-1-14. 가막만에서 시료채취 정점의 위치. P는 시추코어 정점, G는 그랩 시료채취
정점, 그리고 정점 3과 17은 퇴적물 배양 정점 ···25 그림 3-1-15. (a) 퇴적물 형태, (b) 퇴적물 입도 크기, (c) 총유기탄소 함량, 그리고 (d) C/N
비의 분포 ···27 그림 3-1-16. 4개의 시추코어 퇴적물에서 유기탄소와 탄산칼슘의 수직 분포 ···28 그림 3-1-17. 2010년과 2011년 5월에 정점 3과 17에서 실시한 챔버 실험에서 상층수의
용존산소 농도 변화. 직선은 산소 감소구간에서의 선형회귀분석 결과를 나타냄
···30 그림 3-1-18. 2010년과 2011년 8월에 정점 3과 17에서 실시한 챔버 실험에서 상층수의
용존산소 농도 변화 ···31 그림 3-1-19. 2010년과 2011년 11월에 정점 3과 17에서 실시한 챔버 실험에서 상층수의
용존산소 농도 변화 ···32 그림 3-1-20. 2011년 2월에 정점 3과 17에서 실시한 챔버 실험에서 상층수의 용존산소 농도
변화 ···33 그림 3-1-21. 2011년 2월, 5월, 8월 및 11월에 정점 3과 17에서 실시한 챔버 실험에서
상층수의 pH 변화 ···34 그림 3-1-22. 산소소모율과 저층수의 (a) 용존산소 농도와 (b) 온도와의 상관관계 ··· 35 그림 3-1-23. 2011년 8월에 정점 3과 17에서 실시한 챔버 실험에서 상층수의 황화수소 농도
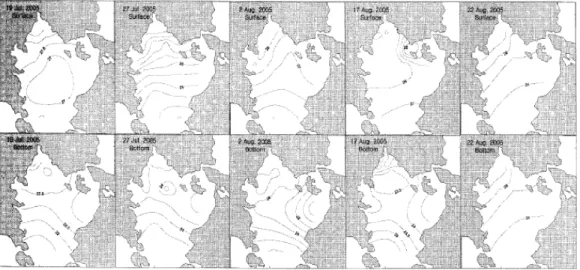
변화 ···36 그림 3-2-1. 대상해역 위성사진 ···39 그림 3-2-2. 가막만의 표층 및 저층의 용존산소 수평분포(김 등, 2006) ···41 그림 3-2-3. 가막만의 표층 및 저층의 수온 수평분포(김 등, 2006) ···42 그림 3-2-4. 수온, 염분 및 용존산소의 연직 프로파일(김 등, 2010) ···42 그림 3-2-5. 국립수산과학원 여수해역 관측정점도 ···43 그림 3-2-6. 조사대상 해역 관측정점 ···44 그림 3-2-7. CTD 형태 및 관측 장면 ···45 그림 3-2-8. 조위관측기(WLR7) 설치개요 및 기기형태 ···46 그림 3-2-9. 조류관측기(RCM9) 설치개요 및 기기형태 ···47 그림 3-2-10. 부표추적 안테나 설치 모습 및 부표 형태 ···48 그림 3-2-11. ESCORT 모델의 수평(a) 및 연직(b) 방향 격자쳬계 ···51 그림 3-2-12. 광역 수치모델 격자망 ···52 그림 3-2-13. 광역 수치모델 수심도 ···53 그림 3-2-14. 협역 수치모델 격자망 및 수심도 ···53 그림 3-2-15. X-Z 2차원 물리-생태계 모델 모식도 ···54 그림 3-2-16. ERGOM 수치모델 모식도 ···55 그림 3-2-17. 생태계 시험모델 격자망 ···58 그림 3-2-18. 2010년 5월 저층 및 표층의 수온 분포 ···63 그림 3-2-19. 2010년 8월 저층 및 표층의 수온 분포 ···64 그림 3-2-20. 2010년 11월 저층 및 표층의 수온 분포 ···64 그림 3-2-21. 2011년 2월 저층 및 표층의 수온 분포 ···65 그림 3-2-22. 2011년 5월 저층 및 표층의 수온 분포 ···65 그림 3-2-23. 2011년 8월 저층 및 표층의 수온 분포 ···66 그림 3-2-24. 2011년 11월 저층 및 표층의 수온 분포 ···66 그림 3-2-25. 2010년 5월 저층 및 표층의 염분 분포 ···68 그림 3-2-26. 2010년 8월 저층 및 표층의 염분 분포 ···69 그림 3-2-27. 2010년 11월 저층 및 표층의 염분 분포 ···69
그림 3-2-28. 2011년 2월 저층 및 표층의 염분 분포 ···70 그림 3-2-29. 2011년 5월 저층 및 표층의 염분 분포 ···70 그림 3-2-30. 2011년 8월 저층 및 표층의 염분 분포 ···71 그림 3-2-31. 2011년 11월 저층 및 표층의 염분 분포 ···71 그림 3-2-32. 2010년 11월 저층 및 표층의 용존산소 분포 ···72 그림 3-2-33. 2011년 2월 저층 및 표층의 용존산소 분포 ···73 그림 3-2-34. 2011년 5월 저층 및 표층의 용존산소 분포 ···73 그림 3-2-35. 2011년 8월 저층 및 표층의 용존산소 분포 ···74 그림 3-2-36. 2011년 11월 저층 및 표층의 용존산소 분포 ···74 그림 3-2-37. 정점 T1의 조위변화 시계열 분포 ···76 그림 3-2-38. 정점 T3의 조위변화 시계열 분포 ···76 그림 3-2-39. 정점 T1의 관측수위, 예측조위 및 잔차수위 분포 ···76 그림 3-2-40. 정점 T3의 관측수위, 예측조위 및 잔차수위 분포 ···77 그림 3-2-41. T1, T3 정점의 조위 조화상수 진폭 히스토그램 ···80 그림 3-2-42. T1 정점 창․낙조 조차 분포 ···80 그림 3-2-43. T3 정점 창․낙조 조차 분포 ···81 그림 3-2-44. C1 정점의 유속·유향 시계열 곡선 ···82 그림 3-2-45. C1 정점의 유속·유향 분포도 및 벡터도 ···83 그림 3-2-46. C1 정점의 조류 누적 벡터도 및 조류 타원도 ···83 그림 3-2-47. 부표추적 결과 ···84 그림 3-2-48. 광역모델의 유속재현 결과 ···85 그림 3-2-49. 광역모델 창·낙조시의 수심평균유속 분포도 ···85 그림 3-2-50. 협역모델 조류 검증 ···87 그림 3-2-51. 협역모델 조위 검증 ···87 그림 3-2-52. 협역모델 대조기 최강 창·낙조시의 수심평균유속 분포도 ···88 그림 3-2-53. 최강유속 점검 정점도 ···89 그림 3-2-54. 조석이 없는 경우 하계 용존산소 분포도 ···91 그림 3-2-55. 조석이 있는 경우 하계 용존산소 분포도 ···91 그림 3-2-56. 조석 및 바람이 있는 경우 하계 용존산소 분포도 ···92 그림 3-3-1. 가막만의 위치(A). 가막만의 샘플링 정점, 2009년 8월 저층의 용존산 소농도(B)와
pH(C) ···95 그림 3-3-2. 퇴적물내 pH를 측정 할 수 있는 마이크로프포파일러 시스템 ···96 그림 3-3-3. 빈산소 수역과 정상수역의 저층에서 월별 수온(A), 염분 (B), DO (C) 와 pH (D)의
변동 ···99 그림 3-3-4 빈산소 수역(G1)에서 퇴적물내 pH의 변동 ···99 그림 3-3-5 퇴적물에서 관찰되는 Scrippsiella trochoidea 시스트의 두가지 형태(왼쪽: spiny
type, 오른쪽: naked type) ···100 그림 3-3-6 퇴적물에서 Scrippsiella trochoidea의 spiny type 시스트, naked type 시스트, 그리고
유영세포의 개체수 월 변동 ···101 그림 3-3-7 퇴적물 시료의 냉장 보관 8개월 후 관찰된 Spiny type 시스트와 naked type
시스트의 비율의 변화 ···101
그림 3-3-8. G빈산소수역과 정상수역(G1과 G2)에서 채집된Scrippsiella trochoidea의 발아율
···102 그림 3-3-9. Scrippsiella trochoidea 시스트의 돌기물 분해 과정. (A) Spiny type, (B) and (C) Intermediate type, (D) Naked type. 스케일: 10 µm ···104 그림 3-3-10. 다양한 pH변화 아래 spiny type 시스트, intermediate type 시스트, 그리고 naked
type 시스트의 비율 변동 ···105 그림 3-3-11. Scrippsiella trochoidea의 spiny type 시스트와 naked type 시스트의 발아율
···105 그림 3-3-12. 가막만에서 세디먼트 트램과 다양한 석회질 와편모조류 시스트 ···106 그림 3-4-1. Seabed의 환경 모니터링을 실시한 가막만의 연구 해역 ···109 그림 3-4-2. YSI 6600 용존산소 측정 센서와 Winkler 방법에 의해 측정된 산소농도 사이의
상관관계 ···109 그림 3-4-3. Seabed의 pH, H2S 농도, 요각류의 난 밀도 측정에 사용된 퇴적물 채집기 ··· 110 그림 3-4-4. 빈산소 및 정상해역의 seabed에서 측정된 수온, 염분, 용존산소 농도의 월 변동
···111 그림 3-4-5. 빈산소 및 정상해역의 seabed에서 측정된 연직 pH의 월 변동 ···112 그림 3-4-6. 빈산소 및 정상해역의 seabed에서 측정된 연직 H2S 농도의 월 변동 ··· 113 그림 3-4-7. 빈산소 및 정상해역의 seabed에서 출현한 요각류 난 밀도의 월 변동 ···114 그림 3-4-8. 요각류 난의 현장(in situ) 부화율 측정에 사용된 Plankton emergence
trap/chamber (PET chamber) ···116 그림 3-4-9. PET chamber의 취급 순서 ···117 그림 3-4-10. 빈산소 및 정상해역의 seabed에서 측정된 수온, 염분, 용존산소 농도, 퇴적물 pH의
일일 변동 ···118 그림 3-4-11. 빈산소 및 정상 환경에 노출된 요각류 난에서 부화한 유생의 일일 개체수 변동
···118
그림 3-4-12. 빈산소 및 정상 환경에 노출된 요각류 난에서 부화한 유생의 누적 개체수 · 119 그림 3-4-13. 빈산소 및 정상해역에 설치된 PET chamber에 존재한 요각류의 난 밀도 ··· 119 그림 3-4-14. 빈산소 및 정상해역에 설치된 PET chamber로부터 측정된 요각류 난의 현장(in
situ) 부화율 ···120 그림 3-4-15. 요각류의 난 부화율에 대한 산소와 pH의 영향 실험을 위해 사용된 장비 및 재료
···122 그림 3-4-16. pH 8.1과 7.2에서 요각류 Acartia omorii의 난 부화율에 대한 무산소 및 정상산소
조건의 영향 ···123 그림 3-4-17. 요각류 Acartia omorii의 난 부화율에 대한 pH의 영향과 pH 6.0 & pH 6.5의
조건하에서 부화되지 않은 난의 회복율 ···124
그림 3-4-18. pH 6.0과 6.5의 실험 환경에서 발생한 Acartia omorii의 비정상적인 난과 유생
···125 그림 3-4-19. 요각류 Paracalanus parvus s.l.의 난 부화율에 대한 pH의 영향 ··· 126 그림 3-4-20. pH 6.0과 6.3의 실험 환경에서 발생한 Paracalanus parvus s.l.의 비정상적인 난과
유생 ···126 그림 3-5-1. 계절 조사 정점도 (좌) 및 월별 조사 정점도(우) ···129 그림 3-5-2. 조사기간 동안 측정된 총유기탄소 (%) 공간적 분포양상 ···130 그림 3-5-3. 조사기간 동안 측정된 저층 용존산소 농도의 시, 공간적 분포양상 ···130 그림 3-5-4. 조사기간 동안 출현한 대형저서동물의 정점별 출현종수(종수/0.3m2) ··· 132 그림 3-5-5. 조사기간 동안 출현한 대형저서동물의 정점별 서식밀도 (개체/m2) ···133 그림 3-5-6. 조사기간 동안 출현한 대형저서동물의 정점별 생물량 (gww/m2) ···134 그림 3-5-7. Hypoxic 지역과 normoxic 지역에서 출현한 대형저서동물의 출현종 수 및
서식밀도 비교 ···135 그림 3-5-8. 저서동물의 기능군별 비율 (GI: carnivores and some deposit-feeder, GII:
suspension feeder, less selective carnivores and scavengers, GIII: surface deposit feeder, GIV: second-order opportunistic species, subsurface deposit-feeder, GV:
First-order opportunistic feeder, deposit feeder) ···138 그림 3-5-9. Hypoxic 해역과 normoxic 해역의 계절별 종다양성지수 ···139 그림 3-5-10. 2009년 5월부터 2010년 7월까지 출현한 대형저서동물의 개체수 자 료를 바탕으로
산출된 dendrogram 및 MDS plot ···141 그림 3-5-11. Hypoxic 해역과 normoxic 해역의 MDS plots ···142 그림 3-5-12. 2009년 2월부터 2011년 9월까지 저층 용존산소 농도 변화 ···143 그림 3-5-13. 2009년 2월부터 2010년 2월까지 계절별로 측정된 총유기탄소(%)의 평균값 ···
···144 그림 3-5-14. 조사기간 동안 가막만에서 출현한 대형저서동물군집의 출현종수 (종수/1.5m2),
서식밀도 (개체/m2)및 생물량 (gww/m2) ···147 그림 3-5-15. 가막만에서 출현한 대형저서동물 우점종의 서식밀도 변동 ···148 그림 3-5-16. 조사기간 동안 가막만에서 출현한 대형저서동물의 종다양성지수, 종균등도지수,
종풍부도지수의 변동양상 ···149 그림 3-5-17. 2009년 2월부터 2011년 9월까지 출현한 대형저서동물 군집의 개체 수 자료를
바탕으로 산출된 dendrogram 및 MDS plots ···150 그림 3-5-18. Hypoxic 해역에 위치한 정점 1과 정점 3에서 hypoxia 발생 전후 출현한
대형저서동물의 출현종수 (종수/0.3m2) ···153 그림 3-5-19. Hypoxic 해역에 위치한 정점 3에서 2009년 2월부터 2011년 9월까지 출현한
대형저서동물의 출현종수 (종수/0.3m2) 및 서식밀도 (개체/m2) ···154 그림 3-6-1. 지중해담치 빈산소 노출 실험 시스템. A, 질소가스 탱크; B, 공기공급 기; C,
수중펌프; D, AquaController; E, 물탱크; F, 대조군 수조; G, 실험군 수조; H, 온도조절기; I, DO probe; J, 온도 probe, J, pH probe ···159 그림 3-6-2. 산소농도 저하에 의한 차등발현 유전자 클론. 특정 프라이머 조합에 의한 PCR 산물
을 아가로즈젤에 전기영동하여 분리하였다. 유전자 발현이 감소된 두 개의 유전자(빨간 화살표) 및 발현이 증가된 두 개의 유전자(초록색 화살표)를 나타내었다. M, DNA marker; C, 대조군; A, 24 h 빈산소 노출군; B, 48 시간 빈산소 노출군 ···161 그림 3-6-3. 빈산소 노출기간에 따른 지중해담치의 치사율. Y-축에 치사율을 표시하였고, X-축
에 노출기간을 표시하였다. 치사율은 세 번의 반복실험에 의해 결정하였다(n=20). ▲, DO 1; ■, DO 2; X, DO 3; ●, control group ···161 그림 3-6-4. COG(Clusters of Orthologous Groups of Proteins)에 의한 차등 발현유전자들의
그룹핑. DO 2에서 두 배 이상 발현량이 변화된 유전자들을 대상으로 하였다 ··· 166 그림 3-6-5. 빈산소 조건에 노출된 담치 차등발현유전자들의 기능적 그룹핑. 두배 이상 유전자
발현량이 변화된 유전자들을 대상으로 하여, COG 분석에 의해 그룹핑하였다. Y-축은 차등발현유전자의 개수를 표시하였고, X-축은 COG code를 표시하였다. COG code: J, translation, ribosomal structure and biogenesis; L, replication, recombination and repair; K, transcription; O, posttranslational modification, protein turnover, chaperones; T, signal transduction mechanisms; V, defense mechanism; W, extracellular structure; Z, cytoskeleton; G, carbohydrate transport and metabolism; P, inorganic ion transport and metabolism; I, lipid transport andmetabolism; E, amino acid transport andmetabolism; C, energy production and conversion; Q, secondary
metabolites biosynthesis, transport and catabolism; F, nucleotide transport andmetabolism; R, general function prediction only; S, function unknown ··· 168 그림 3-6-6. 빈산소 누출에 의해 유전자 발현량이 변화된 유전자들에 대한 venn diagram 분석.
DO 2 mg/L에 24 및 48시간 노출하였고, 두 배 이상 발현량이 변화된 유전자들을 대상 으로 하였다 ···170 그림 3-6-7. 빈산소에 노출된 지중해담치에서 선별된 유전자들의 mRNA 수준 정 량 분석결과.
발현량 변화는 대조유전자인 β-actin 발현량에 대한 비교 비율±표준편차로 표시하였다
(n=3). * 통계적으로 유의한 차이를 보임(P<0.05). EF1α, elongation factor 1 alpha;
hsp90, heat shock protein 90; CaMKII, calcium/calmodulin-dependent protein kinase II alpha; GYP7, TPase-activating protein; 18S, 18S ribosomal RNA gene; cox1, cytochrome oxidase subunit 1; ATP, ATP synthase subunit 6; chi, chitinase; PGM, phosphoglycerate/bisphosphoglycerate mutase family protein; nAChR, alpha 10 subunit of nicotinic acetylcholine receptor gene ···171 그림 3-7-1. Hyopoxia zone의 분포 (Dot blot: hypoxia zone) ···175 그림 3-7-2. 연도별 Hypoxia zone의 증가 ···175 그림 3-7-3. Hypoxia 상태에 의한 주요 해양생물 lethal time ···176 그림 3-7-4. 성게 체강 세포의 분류 ···177 그림 3-7-5. 빈 산소 스트레스 실험의 개요 ···179 그림 3-7-6. DNA microarray 실험 모식도 ···180 그림 3-7-7. 빈산소 상태에서의 성게 초기 배발생 ···181 그림 3-7-8. HSP70유전자 발현의 비교 분석 ···182 그림 3-7-9. 성게 수정란에서 Glutathione reductase의 발현량 비교 ···182 그림 3-7-10. 빈산소 처리에 따른 red spherule 세포의 증가 확인 ···183 그림 3-7-11. 빈산소 환경에서의 red spherule 세포의 증가 확인 ···183 그림 3-7-12. Live and Dead kit를 이용한 세포 형광염색사진 ···184 그림 3-7-13. 빈산소 처리 성게를 이용한 microarray 실험 및 COG분석을 통한 유전자 발현
···185 그림 3-7-14. qReal-time PCR을 이용한 빈산소 처리후 유전자의 변화 확인 ···186 그림 3-7-15. 장기간 빈 산소에 노출된 현장샘플을 이용한 qreal-time PCR 실험 ···187 그림 3-8-1. 2010년과 2011년의 가막만 현장( E1, E', E2, E2') 및 가두리(F1, F2, F3) 어류의
조사정점 ···192 그림 3-8-2. 현장에서 어류 채집 후 해부장면 ···193 그림 3-8-3. 빈산소 환경에 노출된 문치가자미(좌)와 조피볼락(우)의 HIFa mRNA 발현변화 ·
···194 그림 3-8-4. 빈산소 환경에 노출된 어류의 혈중 glucose 농도변화 ···195 그림 3-8-5. 2010월 채집한 가두리 조피볼락의 (a) 성스테로이드 호르몬, (b) HIF a mRNA (c)
혈중 glucose 농도 ···199 그림 3-8-6. 가막만 현장에서 채집한 문치가자미의 (a,d) HIFa mRNA (b,e) 혈중glucose 농도
···199 그림 3-8-7. 2011월 채집한 가두리 조피볼락의 (a,d,g) 성스테로이드 호르몬, (b,e,h) HIFa
mRNA (c,f,i) 혈중 glucose 농도 ···200
그림 3-8-8. 가막만 현장에서 채집한 문치가자미의 (a,d) HIFa mRNA (b,e) 혈중 glucose
농도 ···200