저작자표시-비영리-변경금지 2.0 대한민국 이용자는 아래의 조건을 따르는 경우에 한하여 자유롭게
l 이 저작물을 복제, 배포, 전송, 전시, 공연 및 방송할 수 있습니다. 다음과 같은 조건을 따라야 합니다:
l 귀하는, 이 저작물의 재이용이나 배포의 경우, 이 저작물에 적용된 이용허락조건 을 명확하게 나타내어야 합니다.
l 저작권자로부터 별도의 허가를 받으면 이러한 조건들은 적용되지 않습니다.
저작권법에 따른 이용자의 권리는 위의 내용에 의하여 영향을 받지 않습니다. 이것은 이용허락규약(Legal Code)을 이해하기 쉽게 요약한 것입니다.
Disclaimer
저작자표시. 귀하는 원저작자를 표시하여야 합니다.
비영리. 귀하는 이 저작물을 영리 목적으로 이용할 수 없습니다.
변경금지. 귀하는 이 저작물을 개작, 변형 또는 가공할 수 없습니다.
i
의학 박사 학위논문
동적 18 F-fluoride PET/CT 를 이용한 사구체여과율의 직접적 측정 : 단일 조직 구획 동역학 모형 접근법
Direct measurement of glomerular filtration rate using
18F-fluoride dynamic PET/CT: A single-tissue-
compartmental tracer kinetic modeling approach
2019 년 2 월
서울대학교 대학원 의과대학 의학과 핵의학 전공
이 효 상
ii Direct measurement of glomerular filtration rate using 18F-fluoride dynamic PET/CT: A single-tissue-compartmental tracer kinetic modeling approach 2019년 이효상
iii
의학 박사 학위논문
동적 18 F-fluoride PET/CT 를 이용한 사구체여과율의 직접적 측정 : 단일 조직 구획 동역학 모형 접근법
Direct measurement of glomerular filtration rate using
18F-fluoride dynamic PET/CT: A single-tissue-
compartmental tracer kinetic modeling approach
2019 년 2 월
서울대학교 대학원 의과대학 의학과 핵의학 전공
이 효 상
iv
Direct measurement of glomerular filtration rate using 18 F-fluoride dynamic
PET/CT: A single-tissue-compartmental tracer kinetic modeling approach
지도교수 이 원 우
이 논문을 의학 박사 학위논문으로 제출함 2018 년 10 월
서울대학교 대학원 의학과 핵의학 전공
이 효 상
이효상의 박사 학위논문을 인준함 2018 년 12 월
위 원 장 ( 인 )
부위원장 (인)
위 원 ( 인 )
위 원 (인)
위 원 ( 인 )
1
Abstract
Direct measurement of glomerular filtration rate using
18 F-fluoride dynamic PET/CT:
A single-tissue-compartmental tracer kinetic modeling approach
Hyo Sang Lee College of Medicine, Department of Nuclear Medicine The Graduate School Seoul National University
Purpose: We aimed to show that GFR can be accurately measured using tracer kinetic analysis of dynamic 18F-fluoride positron emission tomography/computed tomography (PET/CT).
Methods: Twenty-three male Sprague-Dawley rats of three experimental groups (medical renal impairment by cyclosporine [n = 8], surgical renal impairment by unilateral nephrectomy [n = 8], and control [n = 7]) underwent simultaneous 18F-fluoride dynamic PET/CT and reference 51Cr-EDTA GFR (GFRCrEDTA) test at day 0 and postoperative day 3. 18F-fluoride PET GFR (GFRF-
2
PET) was calculated by multiplying the influx rate and functional kidney volume in a single-tissue-compartmental kinetic model. Within-test repeatability and between-test agreement were evaluated by intraclass correlation coefficient (ICC) and Bland-Altman analysis. Concomitant change in bone metabolism was assessed by measuring the net influx rate (Ki) of 18F-fluoride in the lumbar spine via the Patlak approach. Additionally, the merit of non-requirement of hematocrit for GFRF-PET was demonstrated by comparing it to dynamic PET/CT of 68Ga-NOTA (n=10) that does not enter red blood cells and thereby requires hematocrit for estimation of plasma fraction.
Results: In the control group, repeatability of GFRF-PET was excellent (ICC=0.9901, repeatability coefficient=12.5%). GFRF-PET significantly decreased in the renally impaired rats (P<0.05) in accordance with respective GFRCrEDTA changes. In the pooled population (46 measurements), GFRF-PET
agreed well with GFRCrEDTA (ICC=0.9369) with minimal bias (−2.4%) and narrow 95% limits of agreement (−25.0% to 20.1%). 18F-fluoride Ki decreased significantly in the renally impaired rats, whereas no significant change was noted in the control rats. Hematocrit-dependent plasma fraction was essential for the calculation of 68Ga-NOTA GFR, whereas a fixed plasma fraction of 1.23 worked for GFRF-PET.
Conclusions: The single-compartmental kinetic analysis of 18F-fluoride dynamic PET/CT, requiring neither urine handling nor plasma sampling, is a reliable and accurate method for GFR measurement, supplemented by
3
simultaneous evaluation of bone metabolism. Further studies in humans are warranted.
Keywords: glomerular filtration rate; 18F-fluoride; positron emission tomography; 51Cr-EDTA; single-tissue compartmental model
Student Number: 2011-30573
4
List of tables
Table 1. Model parameters --- 37 Table 2. GFR in experimental groups --- 37
5
List of figures
FIGURE 1. Study concept --- 23
FIGURE 2. Study design --- 24
FIGURE 3. How to analyze the 18F-fluoride dynamic PET/CT --- 25
FIGURE 4. Evaluation of bone metabolism using 18F-fluoride dynamic PET/CT --- 26
FIGURE 5. 18F-Fluoride curve fitting for a representative case --- 31
FIGURE 6. Repeatability of GFRF-PET and GFRCrEDTA --- 31
FIGURE 7. GFR change after renal function impairment procedures --- 32
FIGURE 8. GFR change in control rats --- 32
FIGURE 9. Accuracy of GFRF-PET compared to reference GFRCrEDTA in the total population --- 33
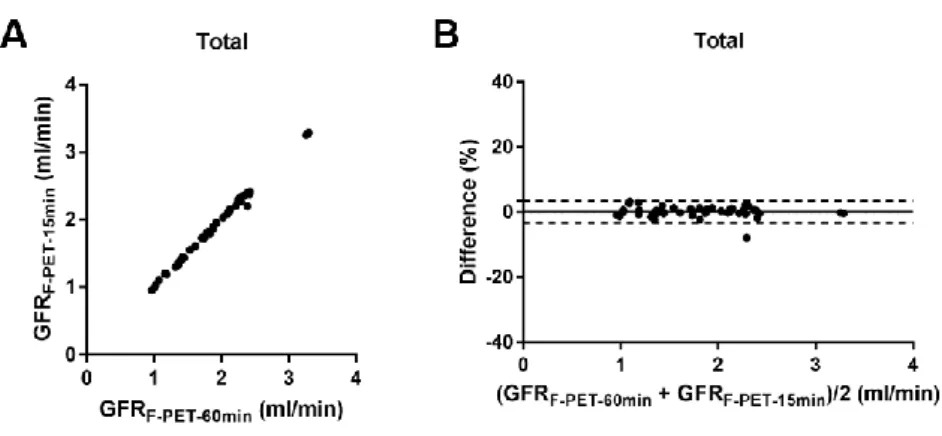
FIGURE 10. 18F-fluoride PET GFR using 60-and 15-min data --- 33
FIGURE 11. Bone metabolism change evaluated by the same dynamic 18F- fluoride PET/CT used for the GFR measurement --- 34
FIGURE 12. 68Ga-NOTA curve fitting for a representative case --- 35
6
FIGURE 13. Requirement of hematocrit measurement for 68Ga-NOTA GFR -- --- 36
7
Contents
Introduction --- 9
Materials and methods Ethical approval --- 13
Tracer kinetic modeling --- 13
Stud design --- 16
Animal care --- 17
Radiopharmaceutical preparation --- 17
Dynamic PET/CT imaging and the 51Cr-EDTA test --- 18
Image analysis --- 20
Statistical analysis --- 21
Results Repeatability of 18F-fluoride dynamic PET/CT GFR --- --- 27
Accuracy of 18F-fluoride dynamic PET/CT GFR --- --- 28
Reduction in imaging time for 18F-fluoride dynamic PET/CT --- 29
Evaluation of bone metabolism --- 29 Blood sampling requirement for hematocrit during dynamic 68Ga-NOTA
8
PET/CT --- 29
Discussion --- 38
Conclusion --- 44
References --- 45
요약(국문초록) --- 52
9
Introduction
The glomerular filtration rate (GFR) is a widely accepted measure of global renal function, and accurate measurement of GFR is essential for optimal decision making in many clinical settings of renal failure (1,2). The GFR has been typically measured as the urinary clearance of an ideal filtration marker such as inulin (3,4). Alternatively, plasma clearance of a filtration marker, such as 51Cr-ethylenediamine-tetraacetic acid (EDTA), has been widely advocated for GFR measurement because of its acceptable accuracy without the necessity for tricky urine handling (5,6). However, drawbacks include the requirement for multiple blood samplings (at least 2 or more times) and a time-consuming procedure (up to 5 hours in normal subjects or longer in renal failure patients).
Estimated GFR is a convenient alternative to the GFR measured by clearance techniques and is widely used as a first-line test of kidney function in most clinics. It is calculated from steady-state serum levels of endogenous filtration markers such as creatinine by using estimating equations that incorporate age, gender, race or weight as surrogates for non-GFR determinants of the serum creatinine level. Its advantages are simplicity, convenience for use, and improved accuracy over using serum creatinine level alone. It has limitations in that discrepancy from true GFR could become large in conditions of extreme muscle mass or diet, different ethnicities, or non-steady-state creatinine level (4).
10
Nuclear medicine imaging techniques offer various means of GFR measurement. Planar renal scintigraphy using 99mTc-diethylenetriamine- pentaacetic acid (DTPA) can provide imaging-based estimation of GFR via Gates’ method (7,8). However, the GFR calculated from the Gates’ formula was reported to be less accurate than measured or estimated GFR, probably due to the potential errors in the correction of background and kidney depth, inherent limitations of two-dimensional images (9,10). Quantitative single-photon emission computed tomography (SPECT)/CT is a promising approach for GFR estimation because attenuation, scatter, and collimator-detector response are relevantly corrected (11). However, the underlying limitation of the Gates’
approach, that renal uptake at a specific time interval (i.e. 2-3 min post injection of 99mTc-DTPA) may vary according to the input function of the tracer to the kidneys, remains unresolved. Positron emission tomography (PET) enables dynamic 3-dimensional imaging, allowing accurate measurement of input function and tissue concentration of radiotracers, therefore has the potential for truly quantitative renal imaging (12). Several proof-of-concept studies produced promising results. 68Ga-1,4,7-triaza-cyclononane-1,4,7-triacetic acid (68Ga-NOTA) or 68Ga-EDTA have been investigated for GFR measurement but the results are yet to be validated (13,14). To date, there is no accepted methodological standard of PET for GFR measurement.
18F-fluoride is an established skeletal PET radiopharmaceutical, but it could also be used for renal imaging because fluoride is not bound to plasma protein
11
and thus is freely filtered through glomeruli (15). Fluoride concentration in glomerular filtrate is identical to that in plasma (16). However, fluoride clearance is always lower than GFR due to significant reabsorption occurring in the renal tubules (17,18). A previous 18F-fluoride dynamic PET/CT study in rats reported a moderate correlation of fluoride clearance with a broad range of renal function parameters; the measurement of GFR using fluoride clearance was beyond the scope (19).
Compartmental tracer kinetic modeling enables the measurement of rate constants as parameters of important physiological processes in vivo. Dynamic PET is suited for this purpose due to its accurate and non-invasive quantification ability. We speculated that because the compartmental modeling allows the separate quantification of influx and efflux rates, we might be able to quantify GFR using 18F-fluoride influx rate despite the presence of tubular reabsorption. The primary objective of this study was to show that GFR can be accurately measured in rats via compartmental modeling of 18F-fluoride dynamic PET/CT. First, we developed a compartmental kinetic model for GFR calculation and applied it to 18F-fluoride dynamic PET/CT. We then applied the kinetic model to rat models of renal impairment because various kinds of rat models have been used to assess GFR or renal function in previous studies utilizing 51Cr-EDTA or 18F-fluoride dynamic PET/CT (20–23). We independently validated the kinetic model by applying it to a different kind of radiotracer, namely 68Ga-NOTA, that satisfies model assumption. The
12
secondary objective was to demonstrate that 18F-fluoride has specific desirable characteristics for the proposed GFR quantitation methodology, especially in comparison with 68Ga-NOTA. In addition, another advantage of the 18F-fluoride PET imaging was demonstrated by measuring changes of bone metabolism induced by renal impairment procedures.
13
Materials and Methods
Ethical approval
All experiments were approved by the Institutional Animal Care and Use Committee in Seoul National University Bundang Hospital (SNUBH-IACUC;
BA1705-223/041-01) and animals were maintained in the facility accredited AAALAC International in accordance with Guide for the Care and Use of Laboratory Animals 8th edition, National Research Council (24).
Tracer kinetic modeling
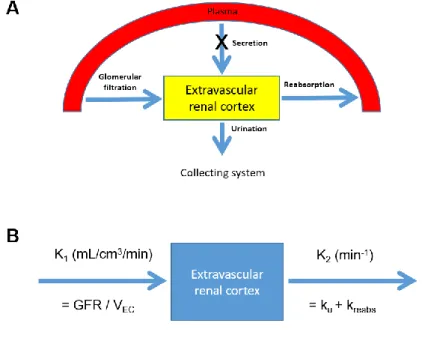
We derived a PET/CT-based compartmental tracer kinetic model for the measurement of GFR. In the model, extravascular renal cortex (EVRC), which contains Bowman’s capsule, the renal tubule, and the interstitium, serves as a functional kidney volume. A tracer enters the EVRC via glomerular filtration and tubular secretion and moves out via reabsorption and urinary outflow (Fig.
1A). The rate of change in the tracer amount within the EVRC can be described by the following equation:
𝑑𝐴𝐸𝐶(𝑡)
𝑑𝑡 = 𝐺𝐹𝑅 × 𝐶𝑃(𝑡) + 𝑘𝑠𝑒𝑐𝑟× 𝐶𝑃(𝑡) − 𝑘𝑢× 𝐴𝐸𝐶(𝑡) − 𝑘𝑟𝑒𝑎𝑏𝑠× 𝐴𝐸𝐶(𝑡)
14
= (𝐺𝐹𝑅 + 𝑘𝑠𝑒𝑐𝑟) × 𝐶𝑃(𝑡) − (𝑘𝑢+ 𝑘𝑟𝑒𝑎𝑏𝑠) × 𝐴𝐸𝐶(𝑡) (1) where AEC(t) = tracer amount within EVRC, CP(t) = tracer concentration in plasma, ksecr = rate constant of tubular secretion, ku = rate constant of tracer loss due to urinary outflow from the cortex, and kreabs = rate constant of tubular reabsorption.
Because no tubular secretion occurs for the 18F-fluoride (17,18), ksecr = 0 (Fig.
1A), the equation (1) becomes as follows:
𝑑𝐴𝐸𝐶(𝑡)
𝑑𝑡 = 𝐺𝐹𝑅 × 𝐶𝑃(𝑡) − (𝑘𝑢+ 𝑘𝑟𝑒𝑎𝑏𝑠) × 𝐴𝐸𝐶(𝑡) (2)
Dividing the equation by EVRC volume VEC = VC × (1 − vB) gives
𝑑
𝑑𝑡(𝐴𝐸𝐶(𝑡) 𝑉⁄ 𝐸𝐶) =𝐺𝐹𝑅
𝑉𝐸𝐶 × 𝐶𝑃(𝑡) − (𝑘𝑢+ 𝑘𝑟𝑒𝑎𝑏𝑠) ×𝐴𝐸𝐶(𝑡) 𝑉𝐸𝐶 𝑑𝐶𝐸𝐶(𝑡)
𝑑𝑡 = 𝐾1× 𝐶𝑃(𝑡) − 𝑘2× 𝐶𝐸𝐶(𝑡) (3) where VC = renal cortical volume, vB = vascular volume fraction, CEC(t) = tracer concentration within the EVRC, K1 = GFR/VEC and k2 = ku + kreabs (Fig.
1B).
The solution to equation (3) can be expressed as follows:
15
𝐶𝐸𝐶(𝑡) = 𝐾1× ∫ 𝐶𝑃(𝜏) 𝑒−𝑘2(𝑡−𝜏)𝑑𝜏 = 𝐾1× 𝐶𝑃(𝑡) ⊗ 𝑒−𝑘2𝑡
𝑡 0
(4) where ⊗ = convolution integral.
The model function Cmodel(t) can be expressed as a superposition of CEC(t) and CP(t) according to their respective volume fractions in the kidney:
𝐶𝑚𝑜𝑑𝑒𝑙(𝑡) = 𝐶𝐸𝐶(𝑡) × (1 − 𝑣𝐵) + 𝐶𝑃(𝑡) × 𝑣𝐵
The Cmodel(t) is fitted to the renal cortical time-activity curve (TAC) with K1, k2, and vB as fitting parameters. Single-kidney GFR is obtained by multiplying K1 and VC × (1 − vB), and total GFR is the sum of the GFR values of both kidneys.
We applied the above model to 18F-fluoride dynamic PET/CT to measure the GFR and compared the values with gold-standard GFR from the 51Cr-EDTA test. Additionally, we tested the model using another PET tracer, 68Ga-NOTA.
68Ga-NOTA was recently reported as a promising GFR tracer with no tubular reabsorption and secretion, and minimal binding to red blood cells and serum protein, thereby allowing free glomerular filtration (13). Because the model is expected to be applicable to any tracers with free glomerular filtration and absence of tubular secretion, 68Ga-NOTA could be used to validate the model independent of the results from the 18F-fluoride experiment.
16
Study design
For the 18F-fluoride PET/CT experiment, 23 male Sprague-Dawley (SD) rats (age: 8 weeks; weight: 280 ± 12 g) were divided into three experimental groups.
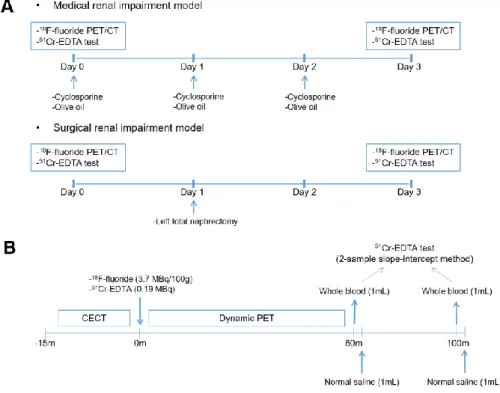
Eight rats were administered with cyclosporine (Sandimmun INJ, Novartis) 30 mg/kg orally from day 0 to 2 to induce renal impairment medically. Another eight rats underwent left total nephrectomy at day 1 to form a surgical renal impairment group. The remaining seven rats were fed 1 mL/day olive oil from day 0 to 2 and served as controls. Each rat underwent two 18F-fluoride PET/CT imaging sessions at an interval of 3 days, at baseline (day 0) and after the renal impairment or control procedures (day 3) (Fig. 2A). Each 18F-fluoride PET/CT imaging session was simultaneous accompanied by 51Cr-EDTA test that served as gold standard GFR (GFRCrEDTA). Analysis of the accuracy of 18F-fluoride PET GFR was on per measurement basis (i.e. two measurements per rat, and total n = 46 measurements). Primary measures of accuracy were percent bias and limits of agreement in reference to the gold standard 51Cr-EDTA test.
Secondary measures of accuracy were P30 and P10, defined as the percentages of the measurements that lie within the ±30% and ±10% ranges from GFRCrEDTA, respectively (25,26). Sample size was calculated according to the formula n ≥ log(1–β)/log(1–α) where n, α and β represent the sample size, discordance rate and tolerance probability, respectively (27). When α = 0.10 and β = 0.80, n = 16 measurements per experimental group, thereby requiring 8 rats in each group.
17
For the 68Ga-NOTA PET/CT experiment, 10 procedure-naïve rats (334 ± 52 g) underwent dynamic PET/CT and a 51Cr-EDTA test. The experimental protocol was the same for the 68Ga-NOTA experiment, except for the hematocrit measurement, 68Ga-NOTA injection, and single (paired) measurement of GFR per rat. For the hematocrit measurement, EDTA-anticoagulated whole blood samples were collected by tail tip cutting of the experiment rats immediately after 18F-fluoride PET/CT imaging acquisition. Hematocrit of collected samples was determined using an automatic blood corpuscle analyzer (HEMAVET 950;
Drew Scientific, FL, USA) within 60 min from blood sampling.
Animal care
Rats were housed in groups of two in conventional cages and kept in a room with stable temperature (20–24 °C) and humidity level (30–70%). The rats were provided with standard rodent diet (Purina Rat Chow, Purina) and water ad libitum.
Radiopharmaceutical preparation
18F-fluoride was produced by proton irradiation to the H218O target using an in- house cyclotron (KOTRON-13, Samyoung Unitech, Seoul, South Korea). 51Cr- EDTA was purchased from GE Healthcare. 68Ga-NOTA was produced by labelling NOTA (ChemaTech, Dijon, France) with 68Ga eluted from a 68Ge/68Ga
18
generator (IGG100; Eckert & Ziegler, Berlin, Germany), as previously described (13).
Dynamic PET/CT imaging and the
51Cr-EDTA test
Imaging was performed from the thorax to the abdomen in the prone position on a dedicated small animal PET/CT scanner (NanoPET/CT; Mediso, Hungary) under general anesthesia through isoflurane inhalation (2−3% in 2−5 L/min of oxygen). In each PET/CT imaging sessions, PET radiopharmaceutical (18F- fluoride (3.7 MBq/100 g rat weight; 11.3±0.8 MBq in 200 μL solution) or 68Ga- NOTA (3.7 MBq/100 g rat weight; 12.7±2.0 MBq in 200 μL solution)) and 51Cr- EDTA (1.85 MBq in 500 μL solution) were simultaneously injected via the intravenous catheter inserted in the tail vein after the acquisition of the enhanced CT scan (22,23,28). Enhanced CT scan was necessary to draw CT- based volumes of interest (VOIs). Immediately following the injection of the radiopharmaceuticals, dynamic 18F-fluoride PET images were obtained in the list mode for 60 min with varying frame durations (5 s × 6, 10 s × 3, 15 s × 4, 30 s × 16, 60 s × 20, and 300 s × 6) (Fig. 2A). The contrast-enhanced CT scan (55 kVp, 145 μA, and 1,100 ms exposure time) was first acquired for 15 min before injection of PET radiopharmaceutical and 51Cr-EDTA. During the CT, an iodinated contrast agent (Ultravist370, Bayer; 3-mL infusion) was continuously infused over 9 min using an auto-injector (NanoJet, Revodix). The
19
CT scan was reconstructed using Butterworth filter, 332×332×473 image matrix and 211-μm isotropic voxel size. PET was reconstructed using an axial field of view of 94.7 mm (1 bed), iterative 3-dimensional expectation maximization algorithm with intrinsic resolution (full width half maximum (FWHM)) of 0.7 mm, 110×110×234 image matrix and 0.4-mm isotropic voxel size. PET attenuation correction was performed using the CT attenuation map (29,30).
After the dynamic PET acquisition, at 60- and 100-min post 51Cr-EDTA injection, 1 mL of blood was withdrawn via tail tip cutting (Fig. 2A). Following each blood withdrawal, 1 mL of saline was flushed to replenish the blood volume. Plasma samples obtained by centrifugation (3,000 rpm for 8 min) were divided into two aliquots for duplication, and the radioactivity of the plasma aliquots was measured for 20 min using a 3-inch-thick well counter (Wizard 1480, Perkin Elmer) 24 h after the blood withdrawal to ensure full decay of the
18F-fluoride or 68Ga-NOTA radioactivity. The plasma clearance of 51Cr-EDTA was calculated from the mean values of the duplicate counts after background correction using the two-sample slope-intercept method (5). The slope- intercept plasma clearance was corrected for neglecting the fast exponential in the bi-exponential plasma curve using the method proposed by Fleming et al.
(31). Briefly, the equation for corrected GFR (GFRcorr) was based on body surface area (BSA)-normalized GFR (GFRBSA).
20
GFRBSA (mL/min/1.73 m2) = GFRSI × 17300/(BSA in cm2), where GFRSI = GFR calculated from the slope-intercept method.
Corrected GFR (GFRcorr) = GFRBSA/(1 + 0.0017 × GFRBSA)
The equation for BSA in rats was derived using an updated Meeh’s constant of 9.83 (32):
Rat BSA (in cm2) = 9.83 × (weight in g)2/3
The final gold standard GFRCrEDTA was calculated by inverting the BSA normalization as following:
GFRCrEDTA (mL/min) = GFRcorr (mL/min/1.73m2) × (BSA in cm2)/17300
Image analysis
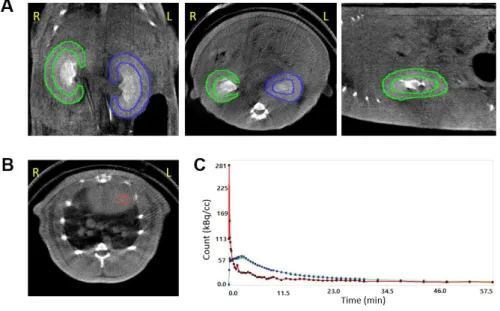
We performed PET/CT data analysis and tracer kinetic modeling using PMOD software (version 3.8; PMOD Technologies). For the GFR analysis, regions of interest (ROIs) were manually drawn over the renal cortices on the coronal CT images (Fig. 3A), and the ROIs over the same kidney were integrated to form a VOI. A 3-mm-diameter spherical VOI was placed in the left ventricular cavity of the heart to obtain whole-blood input function (Fig. 3B). In order to convert whole-blood input function to plasma input function, we adopted a fixed plasma
21
fraction of 1.23 for 18F-fluoride (33) because it permeates into red blood cells with its intracellular concentration stable with about half in plasma (34,35). In contrast, we adopted a plasma fraction of 1/(1−haematocrit) for 68Ga-NOTA because it does not distribute into red blood cells (13). To test whether the measurement of hematocrit is mandatory for the calculation of 68Ga-NOTA plasma input function, we calculated another set of plasma input function by assuming a fixed hematocrit value of 0.45.
The single-tissue-compartmental model curve using the plasma input function was fitted to the renal cortical TACs to obtain 18F-fluoride PET GFR (GFRF-PET) and 68Ga-NOTA PET GFR (GFRNOTA-PET) (Fig. 3C). Additionally, we calculated PET GFR only using the first 15 min of data (GFRF-PET-15min and GFRNOTA-PET-15min) to test the feasibility of reducing imaging time.
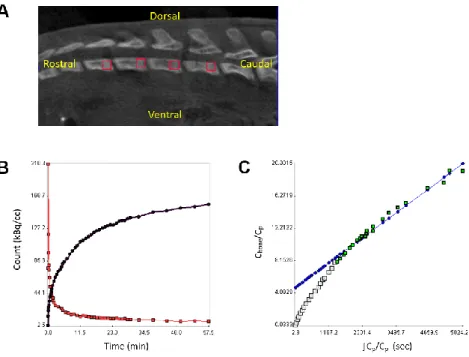
For the analysis of bone metabolism, four 1.5-mm cubic VOIs were placed at the growth plate areas of the lumbar vertebral bodies (L1-4) on 18F-fluoride PET/CT, and the mean TAC in bone and the plasma input function were used to calculate the net influx rate Ki = K1k3/(k2+k3) of 18F-fluoride according to the Patlak graphical method, as previously described (Fig. 4) (33,36). In the analysis of bone metabolism, we used PET images smoothed by a 3-mm Gaussian kernel to prevent unstable fitting due to noisy TACs.
Statistical analysis
22
The goodness-of-fit of the model was assessed using the coefficient of determination (R2). We used the control group data to test for the repeatability of GFRF-PET. Repeatability was assessed by means of the intraclass correlation coefficient (ICC) using a two-way random effects model (ICC(2,1)), the Bland- Altman analysis using percentage difference (%Difference = absolute difference divided by the mean of two measurements) (37,38) and the repeatability coefficient (half width of the LOAs). Accuracy with reference to gold standard as well as agreement between non-reference tests were assessed by means of the ICC(2,1) and Bland-Altman analysis using percentage difference. The paired-samples t-test was performed to analyze the difference between paired observations. The Kruskal-Wallis test was performed for group comparisons. Two-sided P < 0.05 was used as an indicator of statistical significance. All statistical tests were performed using MedCalc statistical software (version 18.5; MedCalc Software bvba, Ostend, Belgium).
23
FIGURE 1. Study concept. (A) A schematic diagram of the single-tissue- compartmental model used in the study. (B) Rate constants in the model. K1 = influx rate (mL/cm3/min), k2 = efflux rate (min-1), GFR = glomerular filtration rate, VEC = extravascular renal cortical volume, ku = rate of urination (min-1), kreabs = rate of tubular reabsorption (min-1)
24
FIGURE 2. Study design. (A) Animal experiment protocol. Renal function impairment was induced medically by cyclosporine administration (upper panel) or surgically by unilateral nephrectomy (lower panel). Control experiment using olive oil was also performed. (B) 18F-fluoride dynamic PET/CT imaging and 51Cr-EDTA test protocol. CECT = contrast-enhanced computed tomography.
25
FIGURE 3. How to analyze the 18F-fluoride dynamic PET/CT. (A) Renal cortical regions of interest. (B) The left ventricular volume of interest. (C) Time-activity curves of the right kidney (green), left kidney (blue), and left ventricle (red). R = right, L = left
26
FIGURE 4. Evaluation of bone metabolism using 18F-fluoride dynamic PET/CT. (A) Vertebral volume of interest. (B) Time-activity curves of the left ventricle (red) and vertebra (black). (C) Patlak plot. Cbone: 18F-fluoride concentration in bone, Cp: 18F-fluoride concentration in plasma.
27
Results
Forty two rats underwent 18F-fluoride PET/CT experiment. We excluded 19 and analyzed remaining 23 rats; among the excluded rats, 6 died during the experiment, 5 showed prolonged blood sampling time (> 10 min) for the 51Cr- EDTA test, 4 showed truncated input functions (first time frame count > 1/2 of the maximum time frame count, which meant that significant portion of input functions was already missed before the commencement of image acquisition), and 4 experienced technical errors including failures of CT acquisition or anesthesia. Fifteen rats underwent 68Ga-NOTA PET/CT experiment. We excluded 5 and analyzed 10 rats; among the excluded rats, one died during the experiment, 3 showed abnormally high hematocrit (> 0.6) and 1 showed marked spillover of urine activity into the renal VOIs due to hydronephrosis.
Repeatability of
18F-fluoride dynamic PET/CT GFR
The single-tissue-compartmental model provided excellent goodness-of-fit to the 18F-fluoride renal cortical TAC (median R2 = 0.9674 [interquartile range (IQR) = 0.9538−0.9763]; Fig. 5). The results of the parameter estimation are summarized in Table 1. The renal cortical volume VC between paired measurements was highly concordant (ICC = 0.9846 [95% confidence interval (CI) = 0.9802−0.9946], repeatability coefficient = 3.1%), which suggests the
28
reproducibility of the manual drawing of the VOIs.
In the control group, the repeatability of GFRF-PET was excellent (ICC = 0.9901 [95% CI = 0.9501−0.9982], bias = −1.8%, limits of agreement = −14.3 to 10.8%, repeatability coefficient = 12.5%), whereas the repeatability of GFRCrEDTA was slightly lower than that of GFRF-PET (ICC = 0.9372 [95% CI = 0.7155−0.9887], bias = 1.5%, limits of agreement = −21.3 to 23.2%, repeatability coefficient = 22.2%; Fig. 6).
Accuracy of
18F-fluoride dynamic PET/CT GFR
GFRF-PET and GFRCrEDTA (Table 2) fell near the reported range of 51Cr-EDTA plasma clearance in rats (1.50−3.0 mL/min) (39). BSAs of the rats were estimated as 413 ± 16 cm2 (range = 380−455 cm2). The BSA-normalized GFRF- PET (range = 41.2−140.2 mL/min/1.73 m2) and GFRCrEDTA (range = 44.2−127.6 mL/min/1.73 m2) were well matched with BSA-normalized human GFR.
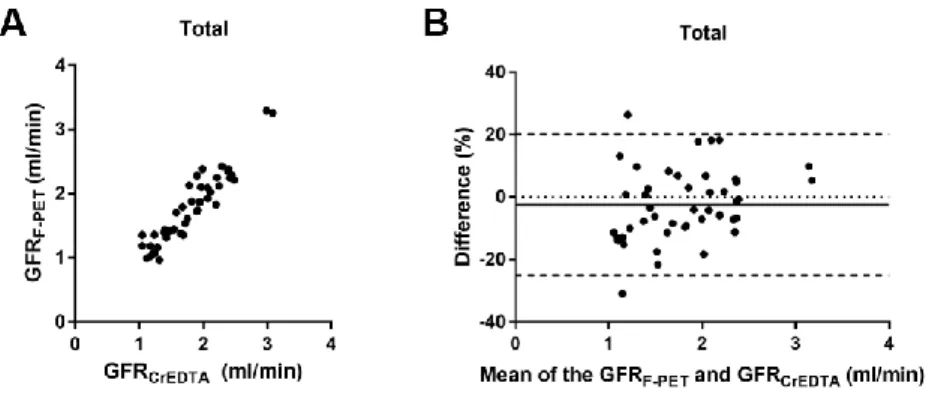
The baseline GFRF-PET and GFRCrEDTA were not significantly different among the experimental groups (P = 0.830 and 0.686, respectively; Table 2). After cyclosporine intake or nephrectomy, GFRF-PET and GFRCrEDTA were significantly decreased (Fig. 7), whereas in the control group, there was no such decrease (Fig. 8). In each of the three groups, GFRF-PET was accurate when compared to GFRCrEDTA (Table 2). In the pooled population (46 measurements), GFRF-PET showed good accuracy compared to GFRCrEDTA (ICC = 0.9369 [95%
29
CI = 0.8893−0.9645]), with minimal bias (−2.4%) and narrow 95% limits of agreement (LOA) (−25.0% to 20.1%) (Fig. 9). P30 and P10 were 97.8% (45/46) and 60.9% (28/46), respectively.
Reduction in imaging time for
18F-fluoride dynamic PET/CT
GFRF-PET-15min showed almost perfect agreement with GFRF-PET (ICC = 0.9982 [95% CI = 0.9968−9990], bias = 0.1%, and 95% LOA = −3.3% to 3.5%; Fig.
10), which suggests that the two could be used interchangeably and therefore that imaging time could be shortened to 15 min without loss of accuracy.
Evaluation of bone metabolism
Ki values in the lumbar spines were significantly decreased in the cyclosporine- administered or nephrectomized rats (from 0.231 ± 0.043 to 0.206 ± 0.035 mL/cm3/min; P = 0.0240), whereas they did not change significantly in the control rats (from 0.244 ± 0.027 to 0.239 ± 0.014 mL/cm3/min; P = 0.6622; Fig.
11).
Blood sampling requirement for hematocrit during
dynamic
68Ga-NOTA PET/CT
30
Overall, 68Ga-NOTA showed poorer goodness-of-fit (median R2 = 0.5223 [IQR
= 0.2295−0.6528] for the 20 kidneys) than did 18F-fluoride (Fig. 12A). The discrepancy between the model curve and kidney TAC was particularly large at later time points (> about 15−20 min). The goodness-of-fit was improved when only the first 15 min of data was used for fitting (median R2 = 0.8557 [IQR = 0.8238−0.9001]; Fig. 12B). Thus, we used GFRNOTA-PET-15min for the subsequent analysis.
Because 68Ga-NOTA GFR calculation using whole-blood input function produced significant bias, conversion to plasma input function was essential (Fig. 13A). After conversion using measured hematocrit, GFRNOTA-PET-15min
showed high accuracy (ICC = 0.9664 [95% CI = 0.8787−0.9914]) with minimal bias (−2.4%) and narrow 95% LOA (−25.9% to 21.1%; Fig 13B) in reference to GFRCrEDTA. GFRNOTA-PET-15min values using a fixed hematocrit of 0.45 showed far wider LOA (−46.8% to 55.5%) than those using measured hematocrit (Fig.
13C), which suggests that 68Ga-NOTA PET GFR cannot be calculated accurately without knowledge of hematocrit.
31
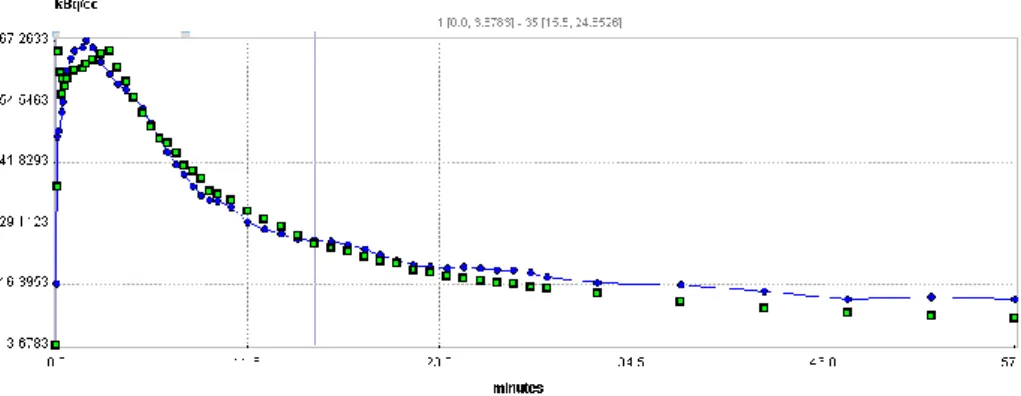
FIGURE 5. 18F-Fluoride curve fitting for a representative case. Green dot = measured renal count, blue curve = fitted curve, coefficient of determinant (R2)
= 0.952.
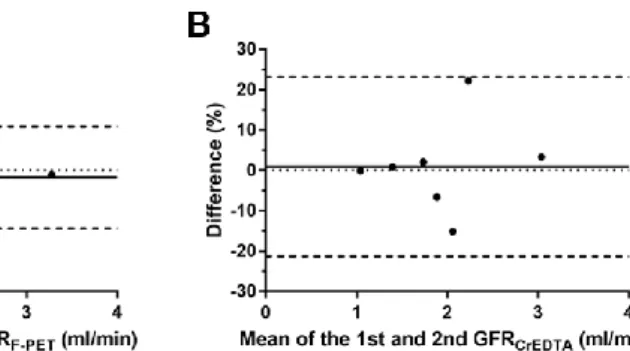
FIGURE 6. Repeatability of GFRF-PET and GFRCrEDTA. (A, B) No significant differences exist in the paired measurements. (C, D) Bland-Altman plots. The horizontal solid lines represent biases, and the horizontal dashed lines represent 95% limits of agreement. NS = non-significant, Difference (%) = 100 × (GFR1st
– GFR2nd)/(mean of GFR1st and GFR2nd)
32
FIGURE 7. GFR change after renal function impairment procedures. GFRF-PET
and GFRCrEDTA were significantly decreased (A, B) after cyclosporine intake or (C, D) unilateral nephrectomy. *: P < 0.05, **: P < 0.01.
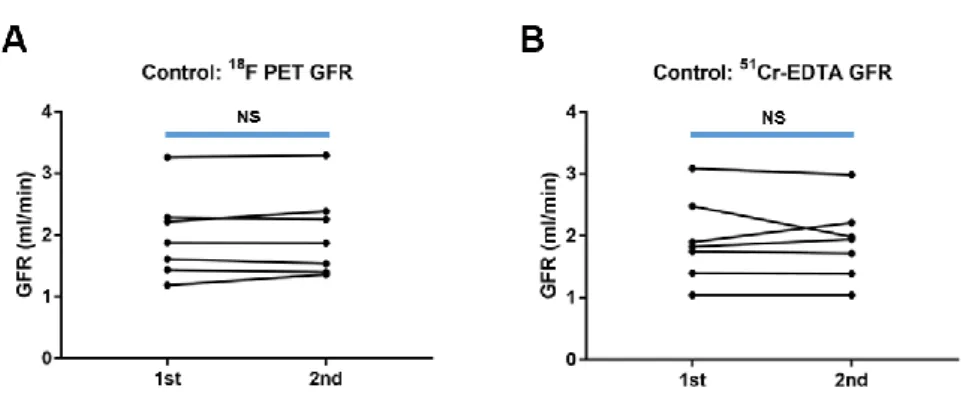
FIGURE 8. GFR change in control rats. (A) GFRF-PET and (B) GFRCrEDTA. NS:
non-significant.
33
FIGURE 9. Accuracy of GFRF-PET in reference to GFRCrEDTA in the total population (46 measurements). (A) The scatterplot. (B) The Bland-Altman plot. %Difference = 100 × (GFRF-PET – GFRCrEDTA)/(mean of GFRF-PET and GFRCrEDTA)
FIGURE 10. 18F-fluoride PET GFR using 60-and 15-min data. (A) The scatterplot. (B) The Bland-Altman Plot. %Difference = 100 × (GFRF-PET-60min – GFRF-PET-15min)/(mean of the GFRF-PET-60min and GFRF-PET-15min)
34
FIGURE 11. Bone metabolism change evaluated by the same dynamic 18F- fluoride PET/CT used for the GFR measurement. (A) Significant decrease in the net influx rate Ki of 18F-fluoride was observed after cyclosporine intake or nephrectomy, (B) whereas there was no significant change in bone metabolism in the control group. *: P < 0.05, NS: non-significant
35
FIGURE 12. 68Ga-NOTA curve fitting for a representative case. (A) Curve fit was poor for 60 min data, particularly at the later time points (> 25 min). R2 = 0.524. (B) Curve fit was enhanced when only using first 15 min of data. R2 = 0.907. Green dot = measured renal count, blue curve = fitted curve.
36
FIGURE 13. Requirement of hematocrit measurement for 68Ga-NOTA GFR.
(A) GFRNOTA-PET-15min produces a significant bias if hematocrit values are not considered in the input function. Hct: hematocrit, NS: non-significant, **: P <
0.01. Accuracy of GFRNOTA-PET-15min in reference to GFRCrEDTA (B) when measured hematocrit values were used, and (C) when a fixed hematocrit of 0.45 was used. Difference (%) = 100 × (GFRNOTA-PET-15min – GFRCrEDTA)/(mean of GFRNOTA-PET-15min and GFRCrEDTA)
37 Table 1 Model parameters
Group # of
kidneys VC
(cm3)
vB K1
(mL/cm3/min) k2
(min-1) Cys Baseline 16 1.022 ± 0.074 0.111 ± 0.034 1.109 ± 0.259 0.802 ± 0.179
Post 16 1.021 ± 0.074 0.125 ± 0.036 0.978 ± 0.244 0.764 ± 0.215 Nx Baseline 16 1.150 ± 0.072 0.106 ± 0.027 0.967 ± 0.175 0.783 ± 0.221 Post 8 1.178 ± 0.057 0.133 ± 0.039 1.043 ± 0.100 0.958 ± 0.024 Control 1st 14 1.067 ± 0.135 0.093 ± 0.026 1.009 ± 0.269 0.787 ± 0.215 2nd 14 1.065 ± 0.135 0.105 ± 0.029 1.043 ± 0.277 0.820 ± 0.215 The figures are expressed as mean ± standard deviation.
VC, renal cortical volume; vB, blood volume fraction; K1, influx constant; k2, efflux constant;
Cys, cyclosporine; Nx, nephrectomy
Table 2 GFR in experimental groups
Group
18F-fluoride PET GFR (mL/min)
51Cr-EDTA GFR
(mL/min) ICC
(95% CI) Baseline Post P Baseline Post P
Cys 2.01±0.43 1.73±0.33 0.0113 2.08±0.35 1.82±0.38 0.0300 0.8983 (0.7400−0.9629)
Nx 1.98±0.34 1.06±0.08 0.0001 1.97±0.35 1.21±0.07 0.0009 0.9390 (0.8387−0.9780)
Control 1.98±0.69 2.01±0.69 0.4415 1.93±0.68 1.90±0.62 0.7603 0.9412 (0.8329−0.9805) GFR, glomerular filtration rate; ICC, intraclass correlation coefficient between 18F-fluoride PET GFR and 51Cr-EDTA GFR; IC, confidence interval; Cys, cyclosporine; Nx, nephrectomy
38
Discussion
In this study, we developed a compartmental tracer kinetic model for PET-based GFR measurement and applied it to 18F-fluoride, which is not a GFR tracer under the conventional concept of urinary or plasma clearance measurement.
According to the model, the influx rate K1 can be considered as GFR per unit extravascular renal cortical volume for any tracer that is freely filtered through glomeruli but does not undergo tubular secretion. Previous reports suggests that
18F-fluoride has the exact property (17,18). GFRF-PET showed good accuracy with reference to gold-standard GFRCrEDTA in conditions of nephrotoxic drug use and post-nephrectomy with minimal bias and narrow LOA. P30 and P10 were 97.8% and 60.9%, respectively, which suggests that GFRF-PET possesses sufficient accuracy (P30 > 80% and P10 > 50%) compared with other well- established GFR markers, such as iohexol, iothalamate, and DTPA (25,26).
Furthermore, the accuracy of GFRF-PET was preserved with a reduction in imaging time to 15 min, which bears practical importance.
Good test repeatability is a prerequisite for assessing accuracy (38). The repeatability of GFRF-PET was excellent with repeatability coefficient of 12.6%.
GFRCrEDTA measured in this study showed slightly poorer repeatability coefficient of 22.2%, which is somewhat large compared to the reproducibility figures previously reported in humans (7.4−9.0%) (40). This might have been caused by technical difficulties of the small animal experiment. We carefully
39
speculate that the accuracy of GFRF-PET in reference to GFRCrEDTA might be even better in humans, considering the expected increase in the precision of GFRCrEDTA.
To our knowledge, approaches of measuring GFR by using a compartmental rate constant have not been attempted in the field of nuclear medicine. In contrast, various types of compartmental modeling approach have been employed in magnetic resonance imaging (MRI) or CT studies. However, a critical literature review suggested that these MRI or CT-based methodologies are not adequately accurate to be used as routine clinical or research tools (41).
Among the MRI-based methods, the cortical compartment model proposed by Annet et al. is similar to ours (42). The differences are that Annet’s method used two-dimensional ROIs and abdominal aortic input function and that the dispersion and time delay (from aorta to renal vasculature) were accounted for.
Many MRI-based methods use two-dimensional single- or multi-slice (with variable thickness) ROIs for better temporal resolution, and this acts as a limitation as a single slice or a slab cannot be representative of a whole kidney (42–44). In this respect, the inherent 3-dimensional capability of PET is a definitive advantage. The use of dispersion- and time-delay-corrected aortic input curves might be a merit of Annet’s method in their rabbit experiment.
However, we do not think that the non-correction for dispersion and time-delay caused any significant biases in our rat experiments because of smaller animal size. If this PET/CT imaging technology is implemented in humans, a proper
40
selection of site for arterial input function measurement may become an important issue.
We conducted another set of experiments using 68Ga-NOTA, a recently reported GFR tracer for PET imaging. The results also showed good accuracy in reference to GFRCrEDTA (Fig. 11B). However, the goodness-of-fit to the 68Ga- NOTA data was not as good as that for 18F-fluoride, particularly when later time points were incorporated in the fitting. The cause of the poor fit is unclear. We speculate that the urination process might not follow first-order (exponential) kinetics and therefore that the process might not be appropriately described by an exponential rate constant ku. For 68Ga-NOTA, the rate constant k2 (= ku + kreabs) becomes ku because kreabs = 0, and according to the above speculation, k2
also becomes an inappropriately modeled parameter. This could hamper the validity of the model equations. In contrast, 18F-fluoride is reabsorbed through the lipid bilayer of tubular cells via passive diffusion (16), and passive diffusion is known to follow first-order kinetics. The reabsorption of fluoride is approximately 60% of glomerular filtrate, but it could increase up to 90%
depending on the urinary flow and pH (17,18). This implies that kreabs comprises a major portion of the efflux constant k2, causing the efflux process to roughly follow first-order kinetics. Therefore, the model fit becomes better for 18F- fluoride, which would be a paradoxical advantage of nonzero reabsorption.
Measurement of hematocrit was essential for the calculation of 68Ga-NOTA plasma input function because the use of the whole-blood input function or
41
fixed hematocrit value of 0.45 produced biased or imprecise GFR (Fig. 11A, 11C). In contrast, a fixed plasma fraction of 1.23 produced accurate GFR for
18F-fluoride. The plasma fraction 1.23 might be related to the fact that the fluoride concentration within red blood cells is approximately 54% of that in plasma (34). In this case, the plasma fraction can be calculated as 1/(1−(1−0.54)
× hematocrit) = 1/(1−0.46 × hematocrit), and if hematocrit = 0.45, it becomes 1.26, which is in close agreement with the adopted value 1.23. If this explanation is true, the plasma fraction of 18F-fluoride might also be dependent in some degree on hematocrit. However, the accuracy of GFRF-PET was high despite using a fixed value of 1.23 instead of using 1/(1−0.46 × hematocrit). It might be the case that the effect of hematocrit was lessened by the coefficient 0.46. Indeed, when hematocrit varies from 0.35 to 0.55, the values of 1/(1−0.46
× hematocrit) vary from 1.19 to 1.34, which are not much different from the value 1.23, thereby justifying the usage of the fixed plasma fraction. In contrast, the values of 1/(1−haematocrit) for the 68Ga-NOTA varies from 1.53 to 2.22 under the same hematocrit range (0.35 to 0.55), which is too variable for a single fixed plasma fraction to be used. The high accuracy of GFRF-PET under a fixed plasma fraction is an advantage because hematocrit need not be measured, eliminating the need for blood sampling.
Kidney function is related to bone mineral metabolism. Radical nephrectomy was associated with alteration in bone turnover markers in short-term follow- up (45), and eventually with an increased risk of osteoporosis and fractures (46).
42
Cyclosporine also adversely affects bone metabolism with accelerated bone remodeling and bone loss (47). In this study, cyclosporine intake and nephrectomy were associated with the decrease in Ki as early as 3 days after the insult, whereas there was no significant change in Ki for the control rats. We think that a combined assessment of kidney and bone is a potential merit of 18F- fluoride. Further studies are warranted to test the possibility of such a dual role in appropriate clinical settings, such as chronic kidney disease-metabolic bone disorder.
The present study has several limitations. First, the range of the measured GFR was not sufficiently wide. The normalized GFRF-PET measured in this study fell within 41.2-140.2 mL/min/1.73 m2 BSA. Further validation is needed for low GFR values because chronic kidney disease stage grades 4 and 5 (GFR
< 30 mL/min/1.73 m2) were not included in the tested range (48). Second, reference tests for bone mineral metabolism such as turnover markers or bone histomorphometry were not performed. Third, manual drawing of ROIs is too laborious for future clinical application. Automatic segmentation of renal cortex might have to be implemented. Last, partial volume correction was not performed on PET quantitation. Nevertheless, we speculate that left ventricular input function might have changed minimally by partial volume correction because the left ventricular cavity size (about 5 mm) is larger than the left ventricular VOI (3 mm in diameter) by more than two times image FWHM (0.7 mm). Moreover, decreased renal count recovery by spill-out might also have
43
been relatively small. Convolution of renal cortical images (average thickness 3 mm) with a 0.7 mm FWHM Gaussian kernel suggests 93.2% count recovery, which implies that renal cortical count was underestimated by about 6.8% due to the partial volume effect.
44
Conclusion
Dynamic 18F-fluoride PET/CT in conjunction with a single-compartmental modeling approach holds promise as a reliable and accurate method for direct GFR measurement. The difficulties in urine handling and blood sampling in the measurement of conventional urinary and plasma clearance of ideal filtration markers may be overcome by pure imaging-based parametric analysis, which is renal clearance of 18F-fluoride from the plasma to the kidney. A quick assessment of GFR (within 15 min) and simultaneous evaluation of bone metabolism are other practical advantages of this approach. Further studies in humans are warranted.
45
References
1. Go AS, Chertow GM, Fan D, McCulloch CE, Hsu C. Chronic kidney disease and the risks of death, cardiovascular events, and
hospitalization. N Engl J Med. 2004.
2. Levey AS, Eckardt KU, Tsukamoto Y, et al. Definition and classification of chronic kidney disease: a position statement from Kidney Disease: Improving Global Outcomes (KDIGO). Kidney Int.
2005;67:2089-2100.
3. Prescot LF, Freestone S, McAuslane JAN. Reassessment of the single intravenous injection method with inulin for measurement of the glomerular filtration rate in man. Clin Sci. 1991.
4. Stevens LA, Levey AS. Measured GFR as a Confirmatory Test for Estimated GFR. J Am Soc Nephrol. 2009;20:2305-2313.
5. Blaufox MD, Aurell M, Bubeck B, et al. Report of the Radionuclides in Nephrourology Committee on Renal Clearance. J Urol. 1998:2297.
6. Fleming JS, Zivanovic MA, Blake GM, Burniston M, Cosgriff PS.
Guidelines for the measurement of glomerular filtration rate using plasma sampling. Nucl Med Commun. 2004;25:759-769.
7. Gates GF. Glomerular filtration rate: estimation from fractional renal accumulation of 99mTc-DTPA (stannous). AJR Am J Roentgenol.
1982;138:565.
46
8. Gates GF. Computation of glomerular filtration rate with Tc-99m DTPA: an in-house computer program. J NuclMed. 1984.
9. De Santo NG, Anastasio P, Cirillo M, et al. Measurement of
glomerular filtration rate by the 99mTc-DTPA renogram is less precise than measured and predicted creatinine clearance. Nephron.
1999;81:136-140.
10. Ma Y-C, Zuo L, Zhang C-L, Wang M, Wang R-F, Wang H-Y.
Comparison of 99mTc-DTPA renal dynamic imaging with modified MDRD equation for glomerular filtration rate estimation in Chinese patients in different stages of chronic kidney disease. Nephrol Dial Transplant. 2006;22:417-423.
11. Kang Y, Park S, Suh MS, Byun S-S, Chae D-W, Lee WW.
Quantitative Single-Photon Emission Computed
Tomography/Computed Tomography for Glomerular Filtration Rate Measurement. Nucl Med Mol Imaging (2010). 2017.
12. Szabo Z, Xia J, Mathews WB, Brown PR. Future direction of renal positron emission tomography. Semin Nucl Med. 2006;36:36-50.
13. Lee JY, Jeong JM, Kim YJ, et al. Preparation of Ga-68-NOTA as a renal PET agent and feasibility tests in mice. Nucl Med Biol.
2014;41:210-215.
14. Hofman M, Binns D, Johnston V, et al. 68Ga-EDTA PET/CT imaging and plasma clearance for glomerular filtration rate quantification:
47
comparison to conventional 51Cr-EDTA. J Nucl Med. 2015;56:405-9.
15. Zohoori F V., Innerd A, Azevedo LB, Whitford GM, Maguire A.
Effect of exercise on fluoride metabolism in adult humans: A pilot study. Sci Rep. 2015;5:1-9.
16. Buzalaf MAR, Whitford GM. Fluoride metabolism. In: Fluoride and the Oral Environment. ; 2011.
17. Järnberg PO, Ekstrand J, Ehrnebo M. Renal excretion of fluoride during water diuresis and induced urinary ph-changes in man. Toxicol Lett. 1983.
18. Spak CJ, Berg U, Ekstrand J. Renal clearance of fluoride in children and adolescents. Pediatrics. 1985;75:575-9.
19. Schnöckel U, Reuter S, Stegger L, et al. Dynamic 18F-fluoride small animal PET to noninvasively assess renal function in rats. Eur J Nucl Med Mol Imaging. 2008;35:2267-2274.
20. Layzell D, Miller T. Determination of glomerular filtration rate in the rat using 51Cr-EDTA and a single blood sample. Invest Urol.
1975;13:200-204.
21. Provoost AP, Molenaar JC. Changes in the glomerular filtration rate after unilateral nephrectomy in rats. Pflugers Arch. 1980;385:161-165.
22. Seefeldt T, Houghton DC. Plasma clearance of 51Cr-EDTA as an estimator of glomerular filtration rate in conscious rats. J Appl Toxicol.
1990;10:439-442.
48
23. Schnöckel U, Reuter S, Stegger L, et al. Dynamic 18F-fluoride small animal PET to noninvasively assess renal function in rats. Eur J Nucl Med Mol Imaging. 2008;35:2267-2274.
24. Institute for laboratory animal research NR council. Guide for the care and use of laboratory animals.; 2011.
25. Stevens LA, Zhang Y, Schmid CH. Evaluating the performance of equations for estimating glomerular filtration rate. J Nephrol.
2008;21:797-807.
26. Soveri I, Berg UB, Björk J, et al. Measuring GFR: A systematic review. Am J Kidney Dis. 2014;64:411-424.
27. Liao JJZ. Sample size calculation for an agreement study. Pharm Stat.
2010.
28. Dimitrakopoulou-Strauss A. Application of F-18-Sodium Fluoride (NaF) Dynamic PET-CT (dPET-CT) for Defect Healing: A Comparison of Biomaterials in an Experimental Osteoporotic Rat Model. Med Sci Monit. 2014.
29. Han JH, Lim SY, Lee MS, Lee WW. Sodium [18F]Fluoride PET/CT in Myocardial Infarction. Mol Imaging Biol. 2015;17:214-221.
30. Choi H, Han JH, Lim SY, et al. Imaging of myocardial ischemia- reperfusion injury using sodium [18F]Fluoride positron emission tomography/computed tomography in rats and humans. Mol Imaging.
2017;16:1-9.
49
31. Fleming JS. An improved equation for correcting slope-intercept measurements of glomerular filtration rate for the single exponential approximation. Nucl Med Commun. 2007;28:315-320.
32. Gouma E, Simos Y, Verginadis I, Lykoudis E, Evangelou A, Karkabounas S. A simple procedure for estimation of total body surface area and determination of a new value of Meeh’s constant in rats. Lab Anim. 2012;46:40-45.
33. Hawkins R a, Choi Y, Huang SC, et al. Evaluation of the skeletal kinetics of fluorine-18-fluoride ion with PET. J Nucl Med.
1992;33:633-42.
34. Charkes ND, Brookes M, Makler PT. Studies of skeletal tracer kinetics: II. evaluation of a five-compartment model of [18F]fluoride kinetics in rats. J Nucl Med. 1979;20:1150-7.
35. Schiepers C, Nuyts J, Bormans G, et al. Fluoride kinetics of the axial skeleton measured in vivo with fluorine-18-fluoride PET. J Nucl Med.
1997;38:1970-1976.
36. Piert M, Winter E, Becker GA, et al. Allogenic bone graft viability after hip revision arthroplasty assessed by dynamic [18F]fluoride ion positron emission tomography. Eur J Nucl Med. 1999.
37. Shrout PE, Fleiss JL. Intraclass correlations: uses in assessing rater reliability.1. Shrout PE, Fleiss JL: Intraclass correlations: uses in assessing rater reliability. Psychol Bull 1979, 86:420–8. Psychol Bull.
50 1979;86:420-8.
38. Martin Bland J, Altman D. Statistical Methods for Assessing
Agreement Between Two Methods of Clinical Measurement. Lancet.
1986.
39. Seefeldt T. Plasma Clearance of 51Cr-EDTA as an Estimator of Glomerular Filtration Rate in Conscious Rats. J Appl Toxicol.
1990;10:439-442.
40. Delanaye P, Cavalier E, Froissart M, Krzesinski JM. Reproducibility of GFR measured by chromium-51-EDTA and iohexol. Nephrol Dial Transplant. 2008;23:4077-4078.
41. Mendichovszky I, Pedersen M, Frøkiæ r J, et al. How accurate is dynamic contrast-enhanced MRI in the assessment of renal glomerular filtration rate? A critical appraisal. J Magn Reson Imaging.
2008;27:925-931.
42. Annet L, Hermoye L, Peeters F, Jamar F, Dehoux JP, Van Beers BE.
Glomerular filtration rate: Assessment with dynamic contrast-
enhanced MRI and a cortical-compartment model in the rabbit kidney.
J Magn Reson Imaging. 2004;20:843-849.
43. Niendorf ER, Grist TM, Lee FT, Brazy PC, Santyr GE. Rapid in vivo measurement of single-kidney extraction fraction and glomerular filtration rate with MR imaging. Radiology. 1998;206:791-798.
44. Hackstein N, Heckrodt J, Rau WS. Measurement of Single-Kidney
51
Glomerular Filtration Rate Using a Contrast-Enhanced Dynamic Gradient-Echo Sequence and the Rutland-Patlak Plot Technique. J Magn Reson Imaging. 2003;18:714-725.
45. Kakareko K, Rydzewska-Rosolowska A, Brzosko S, et al. The effect of nephrectomy on Klotho, FGF-23 and bone metabolism. Int Urol Nephrol. 2017;49:681-688.
46. Bagrodia A, Mehrazin R, Bazzi WM, et al. Comparison of rates and risk factors for development of osteoporosis and fractures after radical or partial nephrectomy. Urology. 2011.
47. Movsowitz C, Epstein S, Fallon M, Ismail F, Epstein S. Cyclosporin-A in vivo produces severe osteopenia in the rat: Effect of dose and duration of administration. Endocrinology. 1988.
48. KDIGO 2017 Clinical Practice Guideline Update for the Diagnosis, Evaluation, Prevention, and Treatment of Chronic Kidney Disease–
Mineral and Bone Disorder (CKD-MBD). Kidney Int Suppl. 2017;7:1- 59.
52
요약(국문초록)
목 적: 본 논문에서는 동적18F-fluoride 양전자방출단층촬영/전산화 단층촬영(PET/CT)의 추적자 동역학 분석을 통해 사구체여과율을 정확하게 측정할 수 있음을 보이려 한다.
방 법: 수컷 Sprague-Dawley 백서 23 마리를 3 개의 군 (cyclosporine 에 의한 내과적 신장 손상군[8 마리], 일측 신절제에 의한 외과적 신장 손상군[8 마리], 대조군[7 마리])으로 나누어 처치 전후 3 일 간격으로 18F-fluoride 동적 PET/CT 와 참조검사 (reference test)인 51Cr-EDTA 사구체여과율 검사(GFRCrEDTA)를 동시에 시행하였다. 18F-fluoride PET 사구체여과율(GFRF-PET)은 단일조직구획 동역학 모형으로부터 구한 입력유율(influx rate)과 기능적 신장용적의 곱으로 계산하였다. 검사 내 반복성과 검사 간 일치도는 급내상관계수(ICC)와 Bland-Altman 분석을 통해 평가하 였다. 병행하여, Patlak 접근법을 통해 요추에서 18F-fluoride 의 순 유입 속도(net influx rate; Ki)를 측정함으로써 골대사의 변화를 평 가하였다. 또한 적혈구 내에 분포하지 않는 여과추적자인 68Ga- NOTA 의 동적 PET/CT 를 통한 사구체여과율 계산에는 혈장분율의 계산을 위해 헤마토크릿 측정이 필요하지만 GFRF-PET 의 계산에는 그렇지 않음을 보였다.
결 과: GFRF-PET 의 반복성은 우수하였다(ICC = 0.9901, 반복성 계 수 = 12.5%). GFRF-PET 는 GFRCrEDTA 의 변화와 일치하여 신장
53
손상군에서 유의하게 감소하였다. 전체 집단 (46 개 측정)에서 GFRF-PET 은 작은 비뚤림(-2.4 %)과 좁은 95 % 일치도 한계 (- 25.0 % ~ 20.1 %)로 GFRCrEDTA와 잘 일치했다(ICC = 0.9369).
18F-fluoride Ki는 신장 손상된 백서에서 유의하게 감소한 반면 대 조군에서는 유의한 변화가 관찰되지 않았다. 68Ga-NOTA 사구체여 과율의 계산에는 헤마토크릿에 의존적인 혈장분획이 필수적이었지 만 GFRF-PET 은 1.23 의 고정된 혈장분획 값을 이용하여 정확하게 계산할 수 있었다.
결 론: 18F-fluoride 동적 PET/CT 를 이용한 단일조직구획 동역학 분석은 신뢰성있고 정확한 사구체여과율 측정방법으로, 채뇨나 채혈 을 필요로 하지 않고 골대사를 동시에 평가할 수 있는 장점을 가진 다. 인간 대상으로 한 후속 연구가 필요하다.