*Lincoln L. Davies
. Introduction
. Traditional Solar Support Mechanisms A. Net Metering
B. Feed-in Tariffs
C. Tradable Certificate Regimes / Renewable Portfolio Standards D. Tax and Financial Incentives
. The Rapidly Evolving Legal Landscape of Solar Support Mechanisms
A. NEM . . . to NEB?
B. FIT . . . to FIP?
C. RPS Bands, Carve-outs, and Multipliers D. The Rise of Tendering Regimes
. Mapping the Future of Solar Support A. Solar Support in Context
1. Germany 2. Japan 3. Nevada
B. Insights, Trends, and Tensions 1. Legal Change, Rapidly
2. Policy Convergence, Policy Consolidation 3. Inevitable Tensions, Enduring Change
. Conclusion
* Associate Dean for Academic Affairs, James I. Farr Professor of Law, and Presidential Scholar, S.J. Quinney College of Law, University of Utah. I am grateful to Sanya Carley for helpful comments on a prior draft, and to Shelby Shaw and Emily Aplin for research support.
become far more prevalent globally; prices have fallen precipitously; and the rise of solar is causing shock waves throughout the electricity sector, with advocates pushing for “grid parity” and incumbents fearing a utility
“death spiral.” Much attention has been paid to these shifts. Much less focus has been put on the dramatic changes now taking place in the legal instruments used to promote solar power. These changes are just as critical
— and are intrinsically intertwined with — the evolution of the solar energy industry itself. As one set of commentators has observed, we may now be observing the “emergence of the next generation of renewable electricity policies.”
This Article aims to make sense of the myriad changes in solar energy support policies worldwide. It identifies the four primary mechanisms used to promote solar to date and traces the key changes that these laws are rapidly undergoing. In so doing, the Article offers a critical roadmap for understanding the recent past of solar support laws, and their potential future. Specifically, the Article observes that the rapid changes to solar support mechanisms derive directly from a fundamental tension at the center of how these laws interface with the electricity system, and that because of this tension, the recent changes to these laws are likely only to continue.
Three case studies — of Germany, Japan, and Nevada—are used to highlight the broader lessons the Article offers.
Keywords: Solar energy, photovoltaics (PV), distributed generation (DG), grid parity, death spiral, net metering, net billing, feed-in tariff, feed-in premium, RPS, tender, tiering, banding, credit multipliers, Germany, Japan, Nevada
Legal measures to promote solar power are no longer new. Since the 1970s, nations across the world have adopted a wide variety of laws and policies to encourage solar energy use, primarily for electricity production.1 Many jurisdictions adopted these laws for reasons tied directly to longstanding energy policy objectives, made all the more pressing by the challenges of the time, including: enhancing domestic energy security, promoting electricity access, and reducing environmental impacts.2 In the heat of this rush to capture the power of the sun, however, some observers saw even greater potential, including the chance to entirely transform the electricity system and thus forge a new and different energy future. As Amory Lovins famously wrote in 1976, “Recent research suggests that a largely or wholly solar economy can be constructed in the United States with straightforward soft technologies that are now demonstrated and now economic or nearly economic.”3
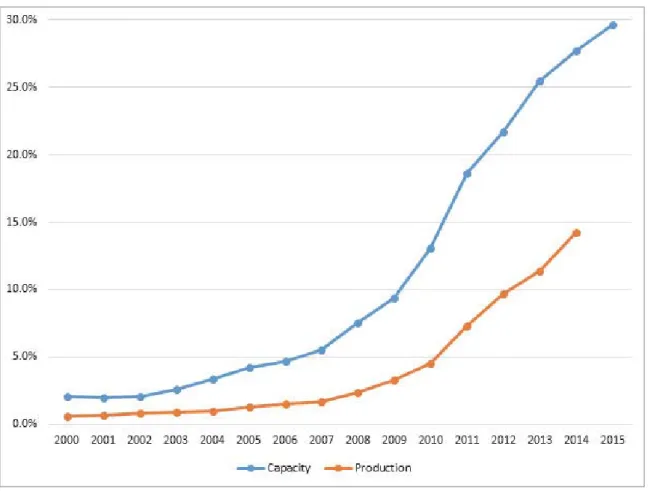
For decades, Lovins’ observation continued to ring more as aspiration than prophecy, both in the United States and for other nations. Yet in recent years, the prospect of an electricity system transformed by solar power increasingly has come to be seen less as distant dream and more as realistic possibility. While renewable energy use continues to comprise only a small portion of overall energy production,4 it has begun to make significant inroads, and solar is no small part of this. Several countries, including Denmark, Germany, and Scotland, recently have registered days where they have produced enough electricity from renewables to cover virtually their entire demand.5 Solar production itself has grown rapidly over the last decade,
1) See, e.g., S.M. Moosavian, Energy Policy to Promote Photovoltaic Generation, 25 Renewable
& Sustainable Energy Revs. 44 (2013); Felix Mormann, Enhancing the Investor Appeal of Renewable Energy, 42 Envtl. L. 681 (2012); Felix Mormann, Requirements for a Renewables Revolution, 38 Ecology L.Q. 903 (2011); K.H. Solangi, A Review on Global Solar Energy Policy, 15 Renewable & Sustainable Energy Revs. 2149 (2011).
2) See generally Sanya Carley, Distributed Generation: An Empirical Analysis of Primary Motivators, 37 Energy Pol’y 1648 (2009); cf., e.g., Uma Outka, Environmental Law and Fossil Fuels: Barriers to Renewable Energy, 65 Vand. L. Rev. 1679 (2012).
3) Amory B. Lovins, Energy Strategy: The Road Not Taken, 55 Foreign Aff. 65, 83 (1976).
4) See Lincoln Davies et al., Energy Law and Policy 100 (2014). BP Statistical Review of World Energy, at 5 (June 2016), http://www.bp.com/content/dam/bp/pdf/energy-economics/
statistical-review-2016/bp-statistical-review-of-world-energy-2016-full-report.pdf [hereinafter, BP Statistical Review].
5) Ian Johnston, Scotland Just Produced Enough Wind Energy to Power It for an Entire Day,
tallying 1.1 percent of global electricity production in 2015—a remarkable jump from 0.3 terawatt hours (TWh) of production in 1989 to 185.9 TWh in 2014.6 And, the prices of solar photovoltaic (PV) modules have fallen so precipitously—by more than seventy percent over the last decade—that solar power appears poised to change the electricity system even more.7
All this has led many observers to project that solar power now holds the potential to disrupt the entire electricity industry, with some suggesting that the world is on the cusp of a solar energy “revolution.”8 As one commentator has prognosticated,
“In the next 20 years, between 50 percent to 100 percent of the world’s energy production could come from solar.”9 Solar, then, in more ways than one, is the emerging star of the global electricity scene.
Independent (Aug. 10, 2016), http://www.independent.co.uk/environment/scotland-wind -energy-renewable-power-electricity-wwf-scotland-a7183006.html.
6) BP Statistical Review, supra note 4.
7) Solar Industry Data: Solar Industry Growing at a Record Pace, Solar Energy Industries Ass’n, http://www.seia.org/research-resources/solar-industry-data (last visited Sept. 21, 2016).
8) Peter Diamandis, Solar Energy Revolution: A Massive Opportunity, Forbes, Sept. 9, 2016, http://www.forbes.com/sites/peterdiamandis/2014/09/02/solar-energy-revolution-a-m assive-opportunity/#176ff26b2066; see also, e.g., Giles Parkinson, Why Energy Experts Are Still Shocked by the Rise of Solar & the Fall in Costs, Clean Technica (Apr. 15, 2016), https://cleantechnica.com/2016/04/15/why-energy-experts-are-still-shocked-by-the-ris e-of-solar-the-fall-in-costs/; Nathan Richter, Is Rooftop Solar Finally Good Enough to Disrupt the Grid?, Harv. Bus. Rev. (May 21, 2015), https://hbr.org/2015/05/is-rooftop–solar -finally-good-enough-to-disrupt-the-grid; Rebecca Smith, Pumped Up: Renewables Growth Revives Old Energy-Storage Method, Wall St. J., July 22, 2016, http://www.wsj.com/ articles/
pumped-up-renewables-growth-revives-old-energy-storage-method-1469179801;
Angela Macdonald-Smith, ‘It’s the End of Energy and Transportation as We Know It’: Tony Seba, Sydney Morning Herald, May 24, 2016, http://www.smh.com.au/business/energy/ its- the-end-of-energy-and-transportation-as-we-know-it-tony-seba-20160519-goz5bm.html.
9) Peter Diamandis, Disrupting Solar, Huffington Post (May 8, 2016), http://www.huffingtonpost.
com/peter-diamandis/disrupting-solar_b_9865216.html; see also, e.g., David Frankel et al., The Disruptive Potential of Solar Power, McKinsey Q. (Apr. 2014), http://www.mckinsey.com/
business-functions/sustainability-and-resource-productivity/our-insights/the-disruptiv e-potential-of-solar-power (“[N]ew solar installations could now account for up to half of new consumption . . . .”); Andrew Freedman, The Renewable Energy Revolution Is Already Upon Us, Mashable (Feb. 4, 2016), http://mashable.com/2016/02/04/renewable -energy-revolution/#HGYtPIS0wSq1.
Figure 1: Share of Non-Hydro Renewable Energy Capacity and Production from Solar10
While solar energy increasingly has gained the spotlight as a potentially disruptive technology, much less attention has been paid to the changing nature of legal and policy tools used to promote this resource. This gap in the literature is critical, because there is a dynamic relationship between legal instruments adopted to promote solar energy and the shape, substance, and stability of those tools. Solar power’s growth has come as production costs for PV panels have plummeted, new and innovative financing mechanisms have taken hold, and other soft costs have fallen, particularly as learning by doing has expanded along with the solar market.11
10) Data derived from International Renewable Energy Agency.
11) Mark Bolinger & Joachim Sel, Lawrence Berkeley Nat’l Lab., Utility-Scale Solar 2015: An Empirical Analysis of Project Cost, Performance, and Pricing Trends in the United States, at ii (Aug. 2016), https://emp.lbl.gov/sites/all/files/lbnl-1006037_report.pdf; David Feldman et al., Ernest Orlando Lawrence Berkeley Nat’l Lab., Photovoltaic (PV) Pricing Trends:
Historical Recent and Near-Term Projections 2-3 (Nov. 2012), http://escholarship.org/uc/
item/06b4h95q; Naim R. Darghouth et al., Net Metering and Market Feedback Loops:
At the same time, the legal and policy instruments adopted to promote solar have begun to evolve along with, and in direct response to, these and other shifts in the electricity sector.12 As the affordability of solar has increased over the last decade, so too has the speed of this legal adaptation.
Indeed, dramatic changes in the legal instruments used to promote solar power have begun to crop up—and take hold—across the globe. As one set of commentators has observed, the changes in renewable energy law are so extensive today that the world may already be “witnessing the emergence of the next generation of renewable electricity policies,” with the corresponding effect that “policy labels themselves are breaking down and evolving.”13 The rapid evolution of the legal and policy instruments designed to support solar energy are an important, telling microcosm of this broader trend. Accordingly, the time is ripe to help make sense of what is happening in the crucially important legal landscape of solar energy support mechanisms.
This Article aims to aid in this understanding, by mapping traditional solar energy support regimes, the changes they are undergoing, and what their future paths may be. It introduces the primary legal tools that historically have been used to promote solar power use, surveys the types of changes these laws have already faced, and uses cases studies of Germany, Japan, and Nevada to illustrate the implications of these changes as they unfold in practice.
Specifically, this Article observes that the recent, rapid changes to solar support mechanisms derive directly from a fundamental tension at the center of how these laws interface with the electricity system: policymakers’ desire to alter the system, and incumbent utilities’ natural incentive to resist that change. Because of this tension, the types of changes these laws have undergone should not be surprising.
They are becoming both more market-oriented and more amalgamated in how they
Exploring the Impact of Retail Rate Design on Distributed PV Deployment, 162 Applied Energy 713 (2016); Giles Parkinson, Solar Costs Will Fall Another 40% In 2 Years. Here’s Why., Clean Technica (Jan. 29, 2015), https://cleantechnica.com/2015/01/29/solar-costs- will-fall-40-next-2-years-heres/; Robert Wand & Florian Leuthold, Feed-in Tariffs for Photovoltaics: Learning by Doing in Germany?, 88 Applied Energy 4387 (2011).
12) See Ranjit Deshmukh et al., Changing Sunshine: Analyzing the Dynamics of Solar Electricity Policies in the Global Context, 16 Renewable & Sustainable Energy Revs. 5188, 5193-97 (2012); Govinda R. Timilsina et al., Solar Energy: Markets, Economics and Policies, 16 Renewable & Sustainable Energy Revs. 449, 462 (2012); Kiran Torani et al., Innovation Subsidies Versus Consumer Subsidies: A Real Options Analysis of Solar Energy, 92 Energy Pol’y 255, 255-69 (2016).
13) See Toby D. Couture et al., Nat’l Renewable Energy Lab., The Next Generation of Renewable Electricity Policy: How Rapid Change Is Breaking Down Conventional Policy Categories, at v (Feb. 2015), http://www.nrel.gov/docs/fy15osti/63149.pdf.
are constructed. Moreover, it is almost certain that these laws will continue to rapidly change, in part because of the fundamental tension in how they operate, and in part because the underlying industry is bound to continually evolve. Consequently, a key imperative for lawmakers going forward will be managing how they alter these support mechanisms over time. At the same time, the solar industry should not expect these laws to remain static, but instead, should find ways to work cooperatively with lawmakers—and to be prepared to adapt to rapidly evolving legal frameworks.
Four parts comprise the balance of the Article. Part II details the significant legal instruments used to promote solar energy use since the 1970s. Part III identifies and describes the key changes occurring in these policies, including the recent evolution of some longstanding legal tools into quite different policy mechanisms. Part IV explores the experience of jurisdictions that have made these changes, focusing particularly on the cases of Germany, Japan, and Nevada. That Part then analyzes these experiences, identifying emerging tensions, trends, and lessons that other jurisdictions across the globe may take from them. Part V concludes.
ɇ . TRADITIONAL SOLAR SUPPORT MECHANISMS
Nations adopt legal support regimes for solar power resources for a variety of reasons. While this Article focuses on support instruments for solar power electricity production, which primarily consists of PV panels but increasingly also includes concentrating solar power (CSP),14 it bears mention that some jurisdictions also have chosen to support use of solar resources for heating services as well.15
At a broad scale, states promote solar power for many of the same reasons that they choose to encourage use of renewable energy resources more generally. One of the most prominent of these is that renewables, including solar, tend to be more environmentally friendly than traditional energy resources, especially fossil fuels.16
14) I. Perez, A. Lopez, S. Bricenɫo & J. Relancio, National Incentive Programs for CSP – Lessons Learned, 49 Energy Procedia 1869, 1870-78 (2014).
15) R. Guédez et al., Optimization of Thermal Energy Storage Integration Strategies for Peak Power Production by Concentrating Solar Power Plants, 49 Energy Procedia 1642, 1647-50 (2014).
16) See generally Joseph P. Tomain, Ending Dirty Energy Policy: Prelude to Climate Change (2011); A.K. Akella et al., Social, Economical and Environmental Impacts of Renewable Energy Systems, 34 Renewable Energy 390, 391(2009); Gary C. Bryner, The National Energy Policy: Assessing Energy Policy Choices, 73 U. Colo. L. Rev. 341, 342 (2002);
Lincoln L. Davies, Beyond Fukushima: Disasters, Nuclear Energy, and Energy Law, 2011 BYU L. Rev. 1937, 1975-78 (2011); Ned Farquhar, Energy, Security, Climate: Converging
Producing electricity from coal, for instance, yields in excess of 2,500 pounds per billion BTU of particulates and SO2, and nearly 500 pounds of NOx.17 By contrast, using solar resources to generate the same amount of electricity produces none of this same criteria air pollution.18 Likewise, as climate change has become a growing concern, solar power has gained a brighter luster in the eyes of governments seeking to quell this global dilemma.19 This is because producing electricity with coal creates more than 200,000 pounds of CO2 pollution per billion BTU, with electricity production from oil yields nearly 175,000 pounds and natural gas produces almost 125,000 pounds.20 But solar is an effectively zero greenhouse gas (GHG) emission fuel.21
What has stopped solar from competing with other electricity generation fuels, then, is not its environmental performance, but rather, other factors. These include, most significantly, its comparatively high cost, but also engineering quandaries, including the fact that solar is a non-dispatchable, intermittent resource, and that electricity systems have been designed generally to deliver power from large, dispatachable, centralized resources rather than from small-scale, distributed generation such as residential rooftop PV.22
Nonetheless, nations have chosen to promote solar both for its favorable environmental attributes as well as other energy policy reasons. Notably, the first real push to promote solar energy came in the wake of the oil crises of the 1970s, underscoring that at least some jurisdictions have long seen solar power as a possible
Solutions, 29 J. Land Resources. & Envtl. L. 1 (2009); Hannah Wiseman et al., Formulating a Law of Sustainable Energy: The Renewables Component, 28 Pace Envtl. L. Rev. 827 (2011); Union of Concerned Scientists, Benefits of Renewable Energy Use, http://www.ucsusa.org/
clean-energy/renewable-energy/public-benefits-of-renewable-power#.WEUFXIWcGM8 (last visited Dec. 4, 2016).
17) See Davies et al., supra note 4, at 127.
18) See id.
19) See, e.g., The Solar Revolution, in Lester R. Brown et al., The Great Transition: Shifting from Fossil Fuels to Solar and Wind Energy 67 (2015).
20) See Davies et al., supra note 4, at 127.
21) See id.
22) See, e.g., Andrew Satchwell et al., Quantifying the Financial Impacts of New-Metered PV on Utilities and Ratepayers, 80 Energy Pol’y 133, 142-43 (2015); David Berry & Amanda Ormond, An Unstable State: Conflict and Institutional Change in the Electric Industry, 28 Elec. J. 63, 63-73 (Mar. 2015); Matt Croucher, Optimal Deployment of Solar Index, 23 Elec.
J. 75, 75-81 (Nov. 2010); Andrea Sarzynski et al., The Impact of State Financial Incentives on Market Deployment of Solar Technology, 46 Energy Pol’y 550, 551-57 (2012).
solution to energy security concerns.23 More recently, some states have begun to see solar power as a possible economic boon. Characterized in different terms—including the most common moniker, “green growth”24—these jurisdictions believe that solar power provides a key avenue to job creation and broader economic growth in a more sustainable way,25 particularly as the electricity sector is decarbonized.26
Another justification for promoting solar relates to this resource’s ability to be used at a small, distributed scale. Unlike other renewables, such as large wind turbines, solar can be deployed far more modularly, including on homes and businesses, as shade in parking lots, and in a myriad other micro applications. This largely sets solar power apart from other renewable energy resources and is part of the reason it gets so much political, governmental, and popular attention.27
Indeed, many benefits get attributed to solar power specifically because it is a distributed generation resource. First, the fact that solar can be used directly by electricity consumers creates a perception that solar power promotes energy democracy.28
23) See Jonatan Pinkse & Daniel van den Buuse, The Development and Commercialization of Solar PV Technology in the Oil Industry, 40 Energy Pol’y 11, 12 (2012). Notably, some observers trace the birth of energy law as a field to this same time period. See, e.g., Kenneth A. Manaster, An Introductory Analysis of Energy Law and Policy, 22 Santa Clara L. Rev.
1151, 1151, 1158 (1982).
24) See generally, e.g., Korea Legislation Research Institute, Research on Local Governments’
Green Growth Legislation (2013); Statistics Korea, Korea’s Green Growth based on OECD Green Growth Indicators 3-7 (March 2012).
25) Martin Jänicke, “Green Growth”: From a Growing Eco-industry to Economic Sustainability, 48 Energy Pol’y 13, 13-16 (2012); Luis Mundaca et al., Towards a Green Energy Economy?
Assessing Policy Choices, Strategies and Transitional Pathways, 179 Applied Energy 1283, 1283-92 (2016).
26) See generally, e.g., Tomain, supra note 16; Sanya Carley, Decarbonization of the U.S. Electricity Sector: Are State Energy Policy Portfolios the Solution?, 33 Energy Econ.1004 (2011).
27) For more on solar power as a distributed resource, see, e.g., Lori Bird et al., Nat’l Renewable Energy Lab. & Regulatory Assistance Project, Regulatory Considerations Associated with the Expanded Adoption of Distributed Solar 8-18, 49 (2013); Richard L. Revesz & Burcin Urcel, Managing the Future of the Electricity Grid: Distributed Generation and Net Metering, NYU School of Law, Public Law & Legal Theory Research Series, Working Paper No. 16-09 (Feb. 19, 2016), http://papers.ssrn.com/sol3/papers.cfm?abstract_id=2734911;
Jeff Winmill, Electric Utilities and Distributed Energy Resources—Opportunities and Challenges, 6 San Diego J. of Climate & Energy L. 199, 204-09 (2015).
28) Cf. Benjamin K. Sovacool & Pascale L. Blyth, Energy and Environmental Attitudes in the Green State of Denmark: Implications for Energy democracy, Low Carbon Transitions, and Energy Literacy, 54 Envtl. Sci. & Policy 304, 304-15 (2015).
This appeals to those who value ideas of populism as well as disruptive innovation.
Second, many argue that solar power can make the electricity grid itself both more efficient and more secure—more efficient because using electricity at the source can cut down on distribution costs and infrastructure investments, and more secure because when electricity is used locally there is less room for breakdowns in a sprawling system.29 Finally, many jurisdictions also have begun to view solar as a way to solve the problem of energy poverty.30 Because solar panels can be easily installed and do not necessarily rely on the presence of a distribution grid, encouraging use of solar in remote and rural areas is one way that electricity can be more cheaply brought to the seventeen percent of the global population that now lacks access to this basic modern lifeblood.31
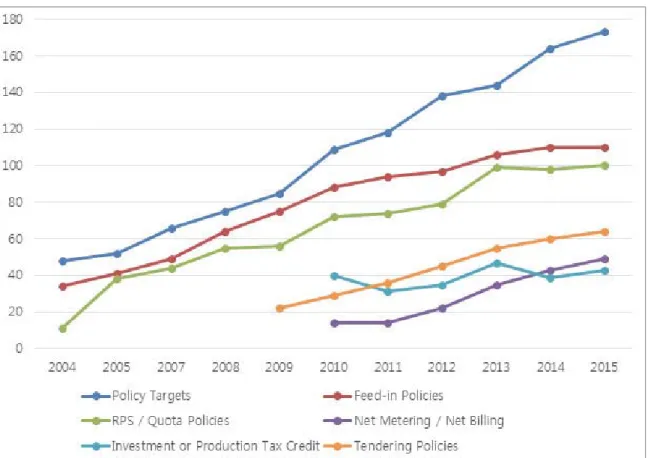
Given the promise of these benefits from solar power, many nations have adopted legal tools aimed at promoting the technology. While the context, contour, and specific content of these laws vary, often quite substantially, from one jurisdiction to the next, they can be placed into four core categories: (1) net metering laws; (2) feed-in tariffs; (3) tradable certificate regimes, also known as renewable portfolio standards or renewable obligations; and (4) tax and other financial incentives. Figure 2 details the overall growth of renewable energy support regimes over the past decade.
29) Lovins, supra note 3, at 79, 84.
30) See, e.g., Johannes Urpelainen, Energy Poverty and Perceptions of Solar Power in Marginalized Communities: Survey Evidence from Uttar Pradesh, India, 85 Renewable Energy 534 (2016).
31) International Energy Agency, Energy Access Database, http://www.worldenergyoutlook.org/
resources/energydevelopment/energyaccessdatabase/ (last visited Sept. 9, 2016); F.S. Javadi et al., Global Policy of Rural Electrification, 19 Renewable & Sustainable Energy Revs. 402, 413 (2013); T.R. Ayodele & A.S.O. Ogunjuyigbe, Increasing Household Solar Energy Penetration Through Load Partitioning Based on Quality of Life: The Case Study of Nigeria, 18 Sustainable Cities & Soc’y 21, 26-31 (2015).
Figure 2: Jurisdictions with Renewable Energy Support Policies32
A. Net Metering
Net metering first took hold in the early 1980s in the United States.33 Adopted in 1978, the Public Utility Regulatory Policies Act (PURPA) sought to encourage
32) Data is derived from the annual Renewables Global Status Reports of the Renewable Energy Policy Network for the 21st Century. Because nation-specific data is not available for some years for these categories, Figure 2 shows data for “states/provinces/countries” for both the
“RPS / Quota Policies” and “Feed-in Policies” categories. Thus, as each subnational policy is counted as a data point for these categories, these two policies are overrepresented in Figure 2; this over-representation is much greater for RPSs/quotas than it is for feed-in policies. Nonetheless, Figure 2 provides a sense of how quickly different policy mechanisms have grown over time.
33) Sanya Carley & Lincoln L. Davies, Nevada’s Net Energy Metering Experience: The Making of a Policy Eclipse?, Report for Brookings Inst., Brookings Mountain West (November 2016).
greater use of renewables for electricity production in a variety of ways, including by compelling incumbent utilities to purchase electricity from so-called renewable energy “qualifying facilities.”34 Inspired by PURPA, “some states decided to take [this idea] one step further by including net metering as an option for smaller generators.”35 Soon, a number of states had net metering (NEM) laws in place.
The idea of net metering is straightforward. “Net metering is a billing mechanism that credits solar energy system owners for the electricity they add to the grid.”36 Specifically, when an electricity consumer also produces electricity, she receives credit for that power production—up to a limit. The limit is that the customer cannot receive this credit for more than the amount of electricity she consumes in a given time period. Thus, the term “net” in “net metering” implies how these laws function.
It reminds that customers are credited only for their net energy production— nothing more.37
While the basic idea of net metering is relatively simple, its application can be more complicated. One set of commentators has identified no fewer than four primary types of net metering laws.38 First, there is “simple net metering,” which functions in the way described above: “[T]he customer-generator uses a single, bi-directional meter to record the amount of electricity banked[, and] the banking period . . . is confined to one billing period.”39 Second, a jurisdiction might adopt “net
34) Public Utility Regulatory Policies Act of 1978, Pub. L. No. 95-617, § 2, 92 Stat. 3117, 3119 (codified at 16 U.S.C. § 2601ದ2645 (2006)).
35) Yih-huei Wan & H. James Green, Current Experience with Net Metering Programs, Green Power Network, at 2, http://apps3.eere.energy.gov/greenpower/resources/pdfs/current_nm.pdf (last updated Mar. 2004).
36) Solar Energy Industries Ass’n, Issues & Policies: Net Metering, http://www.seia.org/policy/
distributed-solar/net-metering (last visited Sept. 9, 2016).
37) For instance, a NEM customer might consume 200 kWh of electricity in a month. She might also produce 75 kWh from a PV system on her home’s rooftop. Of that 75 kWh, she may directly consume 25 kWh but not need the other 50 kWh at the time the electricity is produced. That 50 kWh of power, then, will flow back to the grid. Accordingly, if this customer is participating in a net metering program, she will receive credit for 50 kWh of production and be billed for 125 kWh of consumption from the utility: that is, 200 kWh of total consumption less 25 kWh of direct consumption from the PV system less 50 kWh of electricity supplied to the grid.
38) Larry Hughes & Jeff Bell, Compensating Customer-Generators: A Taxonomy Describing Methods of Compensating Customer-Generators for Electricity Supplied to The Grid, 34 Energy Pol’y 1532, 1533 (2006).
39) Id. at 1535.
metering with buy-back.”40 In this model, the utility pays (rather than credits) the NEM customer for all “excess electricity generated during the billing period.”41 Third, “net metering with rolling credit” operates as does simple net metering, except that the credit for excess electricity production is allowed to be banked over a period of time longer than a single billing cycle.42 Finally, under “net metering with rolling credit and buy-back,” the extra production is credited and rolled over from one billing cycle to the next. However, at the end of this banking period, the utility buys any remaining credited electricity from the NEM customer and “settles up” the account.43
Irrespective of the specific version of net metering, an important feature of traditional NEM programs is that the level of compensation or credit is made at the same price that the customer otherwise would have paid to purchase electricity from the utility. That is, NEM compensation traditionally has been made at the full retail price of electricity.44 Many commentators suggest that this design feature is essential to NEM laws, because it incentivizes customer participation.45 Without this level of support, customers would have no monetary reason to produce their own power, because buying electricity from the incumbent utility would remain a less expensive option.46
The use of retail prices to compensate NEM customers highlights a key difference with other solar support mechanisms. Net metering specifically aims to encourage distributed generation. Whereas other legal tools seek to foster renewables use more generally, or even to encourage specific resources but at any size of project, NEM sets its sights directly on customer-generated power, which by default is often small-scale PV.47
Once introduced into the United States, these programs quickly grew. The
40) Id.
41) Id.
42) Id.
43) Id.
44) E.g., Carley, supra note 2; Carley & Davies, supra note 33.
45) See Carley & Davies, supra note 33.
46) A further justification is that compensating NEM customers at the retail price is equitable:
It means, or at least some observers suggest, that distributed power can compete on the same playing field as electricity provided by utilities. Locally produced distributed power is consumed locally (on-site or immediately nearby), so from a policy perspective, utility- generated and customer-generated electricity should be treated as economic equivalents. See id.
47) Giovanni S. Saarman González, Evolving Jurisdiction Under the Federal Power Act:
Promoting Clean Energy Policy, 63 UCLA L. Rev. 1422, 1426 (2016).
Arizona Public Utilities Commission started net metering there in 1981, and Minnesota adopted a NEM statute in 1983.48 By 1998, a total of twenty U.S. states had “enacted net metering laws or regulations,” and two other states had utilities that adopted NEM programs on their own.49 Today, forty-one states plus the District of Columbia have mandatory net metering policies in place; two states (Idaho and Texas) have no statewide mandate but utility-specific NEM programs; and four states have distributed generation rules other than net metering.50
Net metering has also spread worldwide. While some established solar markets, including Belgium and Denmark, “are moving away from net-metering . . . , emerging PV markets are expected to set up net-metering schemes,” with recent announcements of new NEM programs in Chile, Dubai, Lebanon, Ontario (Canada), and some Indian states.51 Thus, sixteen percent of the global PV market was driven by net metering or other consumer self-consumption laws in 2014,52 and over fifty nations now have some kind of net metering law on the books.53
B. Feed-in Tariffs
Structurally, feed-in tariffs, or “FITs,” are quite similar to net metering programs.
They differ, however, both in the amount of support they provide to solar resources and the way they give that support. That is, rather than simply crediting a customer who produces electricity from solar or other renewables, feed-in tariffs compensate the producer for that production—traditionally, at a set, premium level of payment.54 These laws thus seek to encourage new entry into the electricity generation market by entities other than those who have historically supplied power.55
48) Wan & Green, supra note 35, at 7-8.
49) Id. at 7-9.
50) Database of State Incentives for Renewable Energy & Efficiency, Net Metering (July 2016), http://ncsolarcen-prod.s3.amazonaws.com/wp-content/uploads/2016/07/Net_Metering1.pdf.
51) Int’l Energy Agency Photovoltaic Power Sys. Programme, Trends 2015 in Photovoltaic Applications 10 (20th ed. 2015), http://www.iea-pvps.org/fileadmin/dam/public/report/
national/IEA-PVPS_-_Trends_2015_-_MedRes.pdf.
52) Id. at 33.
53) Renewable Energy Policy Network for the 21st Century, Renewables 2016 Global Status Report 20 (2016), http://www.ren21.net/wp-content/uploads/2016/06/GSR_2016_Full_Report _REN21.pdf [hereinafter, REN21 2016].
54) See Lincoln L. Davies, Incentivizing Renewable Energy Deployment: Renewable Portfolio Standards and Feed-In Tariffs, 1 Kor. Legis. Res. Inst. J. of L. & Legis. 39 (2011).
Feed-in tariffs have four key design components. First, they offer a premium payment for the production of renewables. The payment level generally varies depending on the type of renewable resource in question. A FIT will use one price for solar PV, for instance, and a different price for onshore wind.56 Second, FITs mandate that incumbent utilities allow eligible producers to connect to the grid.57 This aspect of feed-in tariffs aims directly at breaking down a traditional barrier to entry in the industry.58 Third, FITs require that the full amount of energy produced from eligible sources be purchased.59 Deemed a critical innovation of feed-in tariffs, this feature serves a dual purpose, both breaking down a barrier to entry and providing FIT producers certainty by eliminating the risk of needing to find a buyer for their power.60 Fourth, feed-in tariffs guarantee compensation for a given period of time.61 This time period varies, but it is often ten, fifteen, twenty, or even twenty-five years.62 The idea is to assure producers that the electricity market is worth getting into. A guaranteed period of remuneration provides predictability and
55) See, e.g., Fed. Ministry for the Env’t, Nature Conservation, and Nuclear Safety, EEGಧThe Renewable Energy Sources Act: The Success Story of Sustainable Policies for Germany 4, 13 -14 (2007) [hereinafter, BMU, EEG].
56) See, e.g., Jonathan A. Lesser & Xuejuan Su, Design of an Economically Efficient Feed-In Tariff Structure for Renewable Energy Development, 36 Energy Pol’y 981 (2008).
57) See, e.g., Lincoln L. Davies, Reconciling Renewable Portfolio Standards and Feed-In Tariffs, 32 Utah Envtl. L. Rev. 311 (2012).
58) See, e.g., BMU, EEG, supra note 55, at 13-14; Joel B. Eisen, Residential Renewable Energy:
By Whom?, 31 Utah Envtl. L. Rev. 339 (2011).
59) See, e.g., Brian Jansen, Community Wind Power: Making More Americans Energy Producers Through Feed-In Tariffs, 20 Kan. J.L. & Pub. Pol’y 329, 330 (2011).
60) See, e.g., C. Mitchell et al., Risk, Innovation and Market Rules: A Comparison of the Renewable Obligation in England and Wales and the Feed-In System in Germany, at 20, http://www.worldfuturecouncil.org/fileadmin/user_upload/Miguel/Bauknecht_Mitchell_
Connor__2002__Risk__Innovation_and_Market_Rules_-_A_Comparison_of_the_RO_a nd_the_EEG.pdf.
61) See, e.g., Carlos Battle et al., Regulatory Design for RES-E Support Mechanisms: Learning Curves, Market Structure, and Burden-Sharing, MIT Ctr. for Energy and Envtl. Policy Research Working Paper 2011-011, at 2 (May 2011), http://web.mit.edu/ceepr/www/
publications/workingpapers/2011-011.pdf; Toby Couture & Yves Gagnon, An Analysis of Feed-In Tariff Remuneration Models: Implications for Renewable Energy Investment, 38 Energy Pol’y 955 (2010).
62) Paul Gipe, Snapshot of Feed-in Tariffs around the World in 2011, Renewable Energy World (Oct. 6, 2011), http://www.renewableenergyworld.com/articles/2011/10/snapshot-of-feed- in-tariffs-around-the-world-in-2011.html.
reduces risk.63 In this way, FITs effectively function like government-backed investments.64
These and other design features differentiate feed-in tariffs from net metering programs. Perhaps the most essential difference between these laws is that FITs pay generators for the full amount of the power they produce, rather than only crediting them up to the amount they consume. This highlights FITs’ objective of transforming the electricity market by bringing new and different competitors into the fray. At the same time, there is a strong dividing line between FITs and NEM programs because FITs typically encompass all kinds of renewable energy production, whereas NEM regimes are focused on small-scale, distributed power at the retail customer level.
Finally, FIT and NEM programs differ in how they compensate energy production.
Whereas NEM compensation is based on the bundled retail rate of electricity, the modern FIT aims to pay producers for the going cost of technology, plus a reasonable return on their investment.65 This design feature seeks to make FITs efficient, by assuring that customer-producers are not overcompensated.66
There is some dispute about where the first feed-in tariff was instituted. PURPA, adopted in 1978 in the United States,67 is a clear ancestor of modern feed-in tariffs.68 But it only required incumbent utilities to purchase renewables output at the so-called
“avoided cost” they otherwise would have had to pay for acquiring the same amount of generation.
Only two years later, in 1980, Spain adopted a law that even more closely resembled the modern feed-in tariff. That nation’s Law 82/198069 also sought specifically to support renewable energy production, but it took PURPA’s design one step further, by imposing not only a price premium and a purchase mandate but
63) Toby Couture et al., Nat’l Renewable Energy Lab., Policymakers’ Guide to Feed-in Tariff Policy Design (July 2010), http://www.nrel.gov/docs/fy10osti/44849.pdf.
64) Lincoln L. Davies & Kirsten Allen, Feed-in Tariffs in Turmoil, 116 W. Va. L. Rev. 937, 1003 (2014).
65) David Jacobs, Fabulous Feed-in Tariffs, 11 Renewable Energy Focus 28 (2010).
66) See Couture & Gagnon, supra note 61, at 962.
67) Public Utility Regulatory Policies Act § 2, 92 Stat. 3117, 3119.
68) See, e.g., Lesser & Su, supra note 56, at 982; Jim Rossi, The Limits of a National Renewable Portfolio Standard, 42 Conn. L. Rev. 1425, 1436 (2010); Michael E. Streich, Comment, Green Energy and Green Economy Act, 2009: A “FIT”-ing Policy for North America?, 33 Hous. J. Int’l L. 419, 429 (2011).
69) Ley 82/1980, de 30 de desembre, sobre conservació d’energia [Law on the Conservation of Energy] (B.O.E. 1980, 1898), available at http://www.boe.es/boe_catalan/dias/1981/
12/31/pdfs/A00005-00009.pdf.
addressing network connection as well.70
While the pioneering efforts of Spain and the United States were critical in the development of feed-in tariffs, the law often recognized as the direct progenitor of modern FITs is the 1990 German statute, Stromeinspeisegesetz (StrEG).71 This law, which translates roughly as “electricity feed-in law,” lent modern FITs their name.72 Like the 1980 Spanish law, the StrEG addressed network connections and guaranteed a premium price for renewable energy production.73 It also offered historically generous levels of compensation, based—akin to NEM programs—on a percentage of “the average revenues earned by the network operators from sales to all final electricity consumers” during the prior year.74
Importantly, over time, the StrEG regime began to evolve. In 1993, the western German city of Aachen began offering a solar feed-in tariff based on technology costs plus a return-on-investment adder, rather than retail costs as the StrEG had.75 This development, which soon became known as the “Aachen model,”76 was deemed “revolutionary” for tying solar remuneration to technology costs rather than external forces.77 It quickly took off in other German cities,78 and in 2000 was
70) Davies & Allen, supra note 64, at 968 (“Specifically, under the 1980 law, renewable generators received a price for their electricity, set by the Ministry of Energy and Industry and paid by the utilities, for any power produced beyond the facility’s needs”); see also Pablo del Río González, Ten Years of Renewable Electricity Policies in Spain: An Analysis of Successive Feed-In Tariff Reforms, 36 Energy Pol’y 2917, 2918 (2008).
71) See Rainer Hinrichs-Rahlwes, Sustainable Energy Policies for Europe: Towards 100%
Renewable Energy 30 n.12 (2013). The StrEG was adopted in 1990 but took effect in 1991.
72) Id.
73) See Paul-Georg Gutermuth, Regulatory and Institutional Measures by the State to Enhance the Deployment of Renewable Energies: German Experiences, 69 Solar Energy 205, 207 (2000); Volkmar Lauber & Lutz Mez, Three Decades of Renewable Electricity Policies in Germany, 15 Energy & Env’t 3 (2004), available at http://www.windworks.org/cms/uploads/
media/Three_decades_of_renewable_electricity_policy_in_Germany.pdf.
74) David Jacobs, Renewable Energy Policy Convergence in the EU: The Evolution of Feed-in Tariffs in Germany, Spain and France 176 (2012). Unlike NEM programs, however, these rates varied depending on the type of renewable resource used to produce electricity. See id.
at 176-77; Lauber & Mez, supra note 73, at 1.
75) Pembina Institute, Cities Leading Global Renewable Energy Boom, in Renewable Energy Fit for Cities: Making Renewable Energy a Priority, at 2 (2010), available at http://www.
pembina.org/pub/2133.
76) Paul Gipe, All About Solar Energy: The Aachen Solar Tariff Model, Wind-Works (Apr. 7, 2007), http://www.wind-works.org/cms/index.php?id=38&tx_ttnews%5Btt_news%5D=
227&cHash=e088827563342ea235137c8e2e5f7cf6.
imported into the new national renewable energy support law, the Erneuerbare- Energien-Gesetz (EEG).79 That law then brought to full fruition what we now know as a modern feed-in tariff. It offered a price premium tied to technology costs, mandated purchase and interconnection, and guaranteed remuneration to renewables producers for twenty years.80 The importance of this new structure was quickly recognized and broadly acclaimed. As one set of commentators noted as early as 2004, “The most important German [renewable energy] promotion measure in the area of electricity is without any doubt the . . . EEG . . . .”81
In the wake of Germany’s adoption of the EEG in 2000, feed-in tariffs swept the globe. By 2010, at least forty-eight countries had national feed-in tariffs in place, with three more using subnational or regional FITs.82 Today, 110 jurisdictions use FITs,83 and feed-in tariffs are responsible for almost 59 percent of solar energy production—and historically have accounted for nearly 65 percent of all solar production.84 The role of the feed-in tariff in promoting solar, then, cannot be understated. In terms of legal support mechanisms for this resource, FITs long have been the giant in the field.
C. Tradable Certificate Regimes / Renewable Portfolio Standards
For many years, jurisdictions seeking to promote renewables chose either FITs or the mirror-image counterpart to FITs, the renewable portfolio standard (RPS).85 The RPS goes by many names. Depending on the jurisdiction, it is also known as a
77) Id.
78) Lauber & Mez, supra note 73, at 6; Stefanie Hallberg, On the Way to a CO2NeutralCity—
TheExampleofAachen, Goethe Institut, http://www.goethe.de/ges/umw/prj/kuk/the/arc/
en9664671.htm (last visited Mar. 4, 2014).
79) Erneuerbare-Energien-Gesetz [EEG] [Renewable Energy Sources Act], March 29, 2000, Bundesgesetzblatt, Teil I [BGBL. I] at 305, § 8 (Ger.) [hereinafter, EEG 2000], available at http://www.gesetze-iminternet.de/bundesrecht/eeg/gesamt.pdf (German) and http://www.
erneuerbare-energien.de/fileadmin/ee-import/files/pdfs/allgemein/application/pdf/resact.
pdf (English).
80) EEG 2000, supra note 79, at 305, §§ 3, 5, 8, 9; see Volkmar Lauber & Lutz Mez, Renewable Electricity Policy in Germany, 1974 to 2005, 26 Bull. of Sci., Tech. & Soc’y 105, 110 (2006).
81) Mischa Bechberger & Danyel Reiche, Renewable Energy Policy in Germany: Pioneering and Exemplary Regulations, 8 Energy for Sustainable Dev. 47, 52 (2004).
82) David Jacobs, supra note 65, at 28, 29.
83) Renewable Energy Policy Network for the 21st Century, supra note 53, at 19.
84) Int’l Energy Agency Photovoltaic Power Sys. Programme, supra note 51, at 33.
“tradable certificate” regime, a “tradable green certificate” regime, a “renewables obligation,” a “renewable purchase obligation,” a “renewable energy standard” or
“renewable electricity standard,” or, sometimes, a “clean energy standard” or renewable energy “quota.”86
Despite the wealth of monikers employed to refer to these laws, they share several common features. The first is that they mandate that utilities within the jurisdiction achieve a specified target of electricity production by a date certain.87 Typically, RPSs do this by requiring utilities to produce a percentage of their power from renewables, but sometimes they instead simply mandate that a specified level of renewables be installed by a statutory deadline.88 Second, these laws generally create some kind of tradable permit regime to demonstrate compliance with the law.
These are usually called renewable energy credits or renewable energy certificates (RECs), although they are also referred to as green certificates (GCs) or tradable green certificates (TGCs).89 Finally, these laws include a variety of different enforcement mechanisms.90 These can range from penalties for failure to comply to alternative compliance payments (ACPs) that can be made in lieu of renewable energy production, to pre-planning requirements for utilities to coordinate with regulators, to post facto reporting mandates to show compliance.91
RPSs stand apart from both net metering and feed-in tariffs in an important way.
RPSs, at least as initially adopted, generally did not target solar power specifically.
Rather, the very concept of an RPS is that an overarching renewable energy production target will be met, and any resource defined as renewable under the statute will qualify toward meeting that target. The idea is that by creating a separate market for renewables, the competitive playing field will be leveled.92 Thus, unless modified
85) See Pablo del Río & Pere Mir-Artigues, Combinations of Support Instruments for Renewable Electricity, 40 Renewable & Sustainable Energy Revs. 287 (2014).
86) Lincoln L. Davies, Evaluating RPS Policy Design: Metrics, Gaps, Best Practices, and Paths to Innovation, 4 Kor. Legis. Res. Inst. J. of L. & Legis. 3, 9 (2014).
87) See id. at 9-11; see also, e.g., Joshua P. Fershee, Changing Resources, Changing Market: The Impact of a National Renewable Portfolio Standard on the U.S. Energy Industry, 29 Energy L.J. 49 (2008).
88) Lincoln L. Davies, Power Forward: The Argument for a National RPS, 42 Conn. L. Rev.
1339 (2010).
89) See Davies, supra note 86, at 9-11.
90) See id.
91) See Davies, supra note 88; see also, e.g., Greg Buckman, The Effectiveness of Renewable Portfolio Standard Banding and Carve-Outs in Supporting High-Cost Types of Renewable Electricity, 39 Energy Pol’y 4105, 4111 tbl. 11 (2011).
in their design, RPSs effectively tend to support a single type of renewable resource
—the lowest cost one. In many jurisdictions, this meant that RPSs generally supported wind development, because historically this was often the most cost efficient renewable resource.
Even though traditionally RPSs did not single out solar power for special compensatory treatment as NEM and FIT regimes do, these mandates still have played an important role in encouraging solar energy use. In fact, according to the International Energy Agency, over four percent of solar production has occurred in response to the trading of green certificates or similar RPS-based regimes.93 Moreover, as RPSs have continued to evolve in recent years, they increasingly have included solar-specific measures.94
Globally, RPSs have not been quite as popular as feed-in tariffs, and some jurisdictions in fact have abandoned RPSs in order to adopt FITs.95 Still, renewable obligations are one of the most common policies used worldwide for promoting renewables, with one hundred jurisdictions currently employing them.96
92) See Buckman, supra note 91.
93) Int’l Energy Agency Photovoltaic Power Sys. Programme, supra note 51, at 33.
94) See infra Part III.C.
95) Peng Sun & Pu-yan Nie, A Comparative Study of Feed-in Tariff and Renewable Portfolio Standard Policy in Renewable Energy Industry, 74 Renewable Energy 255, 261 (2015);
Anton Ming-Zhi Gao et al., Sustainable Photovoltaic Technology Development: Step-by-Step Guidance for Countries Facing PV Proliferation Turmoil Under the Feed-in Tariff Scheme, 43 Renewable & Sustainable Energy Revs. 156, 157 (2015).
96) Renewable Energy Policy Network for the 21st Century, supra note 53, at 19. This figure refers to both national and subnational RPSs. Only about thirty nations have national or subnational RPSs, although many more, especially in the European Union, use TGCs. See id. at 118-20. Reliance on RPSs is particularly important in the United States. Thirty-seven states plus Washington, D.C. have RPSs in place, in part because the national Congress has failed to adopt climate change legislation. Given that the future of the Obama administration’s Clean Power Plan remains in doubt, these state laws are particularly important for the future of renewable energy in the United States. Database of State Incentives for Renewable Energy & Efficiency, Renewable Portfolio Standard Policies (Aug.
2016), http://ncsolarcen-prod.s3.amazonaws.com/wp-content/uploads/2014/11/Renewable -Portfolio-Standards.pptx; see Adam Liptak & Coral Davenport, Justices Deal Blow to Obama Effort on Emissions, N.Y. Times, Feb. 10, 2016, at A1. See generally, e.g., Barry G.
Rabe, Pew Center Global Climate Change, Race to the Top: The Expanding Role of U.S.
State Renewable Portfolio Standards (2006), http://www.pewclimate.org/docUploads/
RPSReportFinal.pdf; Kevin L. Doran, Can the U.S. Achieve a Sustainable Energy Economy from the Bottom-Up?: An Assessment of State Sustainable Energy Initiatives, 7 Vt. J. Envtl.
D. Tax and Financial Incentives
The final category of legal tools used to promote solar energy is also the largest and most diverse. Across the globe, jurisdictions employ a wide variety of tax and other financial incentives to reduce the cost barrier to solar.97 These include
“capital-based (i.e. per watt of installed capacity) incentives or rebates, tax incentives (investment tax credits and production tax credits), grants, interest subsidies or low-cost financing, and loan guarantees.”98 Within these broad categories, the variations and gradations of detail are almost limitless. Indeed, one study estimates that over 200 such policies are currently in effect throughout the world.99
Because the objective of these measures is to reduce the cost of using solar, two key dilemmas arise. The first is how significant the financial incentive will be. The second is related: How much will the incentive cost ratepayers or the public? This matters because “most of these and other forms of subsidies are financed from either electric ratepayer charges and/or taxpayer monies.”100
Tax credits are among the most popular of these mechanisms, and they may function in several ways. The investment tax credit affords a person or entity that installs PV panels a break on their tax bill.101 For instance, beginning in 1978, the United States offered a thirty percent tax credit for expenditures on solar electricity production equipment, a significant driver for renewable energy installations over
L. 95, 107 (2006); Kirsten H. Engel, Harnessing the Benefits of Dynamic Federalism in Environmental Law, 56 Emory L.J. 159 (2006); Daniel A. Farber, Climate Change, Federalism, and the Constitution, 50 Ariz. L. Rev. 879 (2008); Hari M. Osofsky, Diagonal Federalism and Climate Change Implications for the Obama Administration, 62 Ala. L.
Rev. 237 (2011).
97) See, e.g., hereinafter, REN21 2016, supra note 53, at 18; Moosavian, supra note 1.
98) Ranjit Deshmukh et al., Changing Sunshine: Analyzing the Dynamics of Solar Electricity Policies in the Global Context, 16 Renewable & Sustainable Energy Revs. 5188, 5190 (2012).
99) Int’l Energy Agency, IEA/IRENA Joint Policies and Measures Database, https://www.iea.org/
policiesandmeasures/renewableenergy/ (last visited Sept. 9, 2016).
100) Deshmukh et al., supra note 98, at 5190; see also, e.g., U.S. Energy Info. Admin., Direct Federal Financial Interventions and Subsidies in Energy in Fiscal Year 2013 (2013), https://www.eia.gov/analysis/requests/subsidy/pdf/subsidy.pdf.
101) Felix Mormann, Beyond Tax Credits: Smarter Tax Policy for A Cleaner, More Democratic Energy Future, 31 Yale J. on Reg. 303, 314-315 (2014); Tracey M. Roberts, Picking Winners and Losers: A Structural Examination of Tax Subsidies to the Energy Industry, 41 Colum. J. Envtl. L. 63, 98-100 (2016).
time.102 By contrast, a production tax credit reduces the tax bill of the system owner based not on how much they invest in the system, but rather, on how much qualifying electricity they produce from it.103 This tax mechanism, too, has been seen as critical in the United States, with boom-and-bust cycles arising whenever the credit expires or that possibility of the credit lapsing crops up.104 Globally, both types of tax credits are popular in part because they do not require a direct outlay of funds from the government. According to the Renewable Energy Policy Network, fifty-two countries currently have some type of renewable energy tax credit in place.105
Grants and other types of subsidies operate similarly to investment and production tax credits but are financed differently. Rather than reducing government tax income, they are paid directly using government funds. They are extremely popular.
“Subsidies are the primary instrument to support solar energy development in almost every country in the world.”106 India offers a good example of how such incentives function. There, the government has offered a production-based subsidy that combines with a feed-in tariff to offer roughly Rs. 15/kWh, with higher levels of compensation for rural electrification programs and families below the poverty line.107 Globally, fifty-nine countries use grants, subsidies, or similar tools to encourage installation of renewables.108
Governments may also seek to break down barriers to solar use by facilitating the financing of projects, particularly in rural areas or for lower income citizens.
“Micro-credit . . . has been used as a model for initiating community energy projects (particularly in Latin America, Africa and South Asia), while at the same time addressing poverty by increasing energy access.”109 In 2003, for instance, Spain initiated a program to give low-interest loans for solar thermal applications.110
102) Govinda R. Timilsina et al., Solar Energy: Markets, Economics and Policies, 16 Renewable
& Sustainable Energy Revs. 449, 458 (2012).
103) Mormann, supra note 101, at 313-15; Roberts, supra note 101, at 95-98.
104) See 26 U.S.C. § 45 (2015); Am. Wind Energy Ass’n, Wind Energy for a New Era: An Agenda for the New President and Congress 8 (2009), available at https://web.archive.org/
web/20120321190236/http://www.newwindagenda.org/documents/Wind_Agenda_Rep ort.pdf; Ryan Wiser et al., Using Federal Production Tax Credit to Build a Durable Market for Wind Power in the United States 5 (2007).
105) REN21 2016, supra note 53, at 18.
106) Timilsina et al., supra note 102, at 458.
107) Id.
108) REN21 2016, supra note 53, at 119-21.
109) Id. at 139.
110) Timilsina et al., supra note 102, at 459
Bangladesh similarly launched a microcredit financing program that resulted in nearly one million installs of solar home systems between 2003 and 2011.111
On a global scale, governmental subsidies and tax breaks have played an undeniably important role in promoting solar. They account for almost twenty percent of the PV market historically, and roughly sixteen percent of PV installations in 2014.112
Ɉ . THE RAPIDLY EVOLVING LEGAL LANDSCAPE OF SOLAR SUPPORT MECHANISMS
Following their inception forty years ago, most legal support mechanisms for solar stayed relatively unchanged over the years, quietly helping PV and related technologies occupy their small, sleepy corner of the energy industry. Over the last decade, however, a virtual revolution in solar has begun. Growth of solar has exploded, with PV increasing from under 15 GW of global installed capacity in 2004 to nearly 180 GW in 2014.113 At the same time, the legal and policy instruments used to promote solar also have undergone rapid and extensive transformation. It is no coincidence that these two trends emerged in tandem. They are intrinsically interrelated.
As the solar power market has changed, so too have the legal instruments used to promote this resource, shifting and adapting in response to the altered technological and economic landscape.
By far, the most staggering change in solar power over the last decade is the precipitous decline in module costs. In 1978, the price of a solar panel in the United States was nearly $77/watt. By 2006, that price had dropped to roughly $4/watt.
Since then, the price has fallen further still—almost tenfold—with a recorded price of $0.49/watt in July 2016.114
Moreover, these drops in solar costs have altered where solar is installed. “In 2008, Spain fueled market development while Europe achieved more than eighty percent of the global market: a performance repeated until 2010.”115 Only six years
111) Id.
112) Int’l Energy Agency Photovoltaic Power Sys. Programme, supra note 51, at 32.
113) Id. at 8.
114) Galen Barbose & Naim Darghouth, Lawrence Berkeley Nat’l Laboratory, Tracking the Sun VIII: The Installed Price of Residential and Non-Residential Photovoltaic Systems in the United States 1 (Aug. 2015), https://emp.lbl.gov/sites/all/files/lbnl-188238_2.pdf; Zachary Shahan 13 Charts On Solar Panel Cost & Growth Trends, Clean Technica (Sept. 4, 2014), https://cleantechnica.com/2014/09/04/solar-panel-cost-trends-10-charts/.
115) Int’l Energy Agency Photovoltaic Power Sys. Programme, supra note 51, at 12.
later, all that has changed. Asia now accounts for roughly a third of the global market, and the Americas are rapidly increasing their solar market share as well.116 Thus, in 2014, China led the world in PV installations, representing twenty-seven percent of all projects, with Japan following at twenty-four percent, the United States in third at sixteen percent, and no other country accounting for more than six percent of the market.117
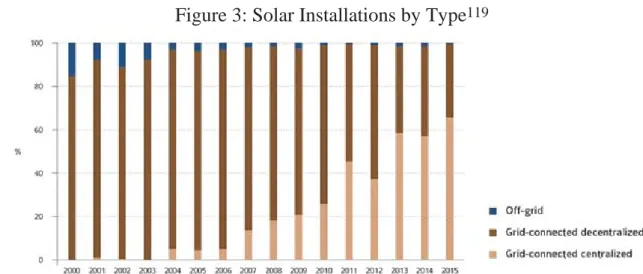
At the same time, the types of solar projects being built has shifted, with grid-connected and centralized large projects now dominating the scene—a stark change from only fifteen years ago when distributed PV was the most popular. In 2000, nearly eighty percent of installations worldwide were grid-connected distributed generation, with the remainder of installs coming from off-grid resources.
Since 2007, however, off-grid resources have essentially fallen off the map, accounting for only a sliver of global PV installations, while utility-scale installations have outstripped the growth of distributed solar. In 2015, for instance, utility-scale centralized solar projects made up more than sixty percent of the global market, grid-connected distributed generation comprised almost the entire balance, and off-grid projects barely registered.118
Figure 3: Solar Installations by Type119
116) Id. at 10.
117) Id. at 9.
118) Id. at 10-11.
119) This figure is reprinted with permission from Int’l Energy Agency Photovoltaic Power Systems Programme, Trends 2016 in Photovoltaic Applications: Survey Report of Selected IEA Countries Between 1992 and 2015, at 12 (2016), http://iea-pvps.org/index.php?id
=3&eID=dam_frontend_push&docID=3390.
These rapidly changing trends in solar deployment cannot be separated from the legal tools used to promote the technology. Until only recently, global drops in solar prices were a direct result of the wide adoption of feed-in tariffs in Europe, which achieved their goal of driving costs down by enhancing economies of scale and building efficiencies in soft costs, particularly by learning through doing.120 Indeed, Europe’s pioneering solar policy efforts, namely through FITs, helped entice new players into the PV manufacturing market, including China.121 The resulting shift in installations from Europe to other parts of the globe directly tracked the modification of support regimes in that region, particularly as feed-in tariffs were diluted or abandoned.122 Understanding what changes are occurring in the support regimes for solar, then, is critically important. It helps explain the market, and it identifies ways in which these legal tools are, or are not, working.
Overall, four recent trends in changes in the legal and policy support tools for solar can be observed worldwide. First, some jurisdictions have begun considering—and implementing—alterations to their net metering regimes, both to reduce compensation to NEM customers and to increase fees levied on them. Second, feed-in tariffs have rapidly and significantly evolved, with some countries putting strict limits on their regimes, others fundamentally transforming them, and others still abandoning them outright. Third, many jurisdictions using RPSs have updated their laws in an effort to promote solar. These changes include creating solar-specific tiers, adopting solar- specific targets, and giving extra credit for solar installations. Fourth, there has been a rise in the use of tendering regimes worldwide, which has helped promote larger solar projects.
Importantly, not all these trends cut in the same direction. Shifts away from FITs,
120) Barbose & Darghouth, supra note 114, at 2; see also, e.g., Robert Fares, The Price of Solar Is Declining to Unprecedented Lows, Sci. Am., Aug. 27, 2016, http://blogs.scientificamerican.com/
plugged-in/the-price-of-solar-is-declining-to-unprecedented-lows/; Katie Fehrenbacher, Solar Is Going to Get Ridiculously Cheap, Fortune, June 13, 2016, http://fortune.com/
2016/06/13/solar-to-get-crazy-cheap/; Chip Register, Solar Continues Trumping Fossil Fuel Pricing, With More Innovations to Come, Forbes, Sept. 11, 2014, http://www.forbes.com/
sites/chipregister1/2014/09/11/solar-continues-trumping-fossil-fuel-pricing-with-more-i nnovations-to-come/#2a347bde232f .
121) Dawei Liu & Hideaki Shiroyama, Development of Photovoltaic Power Generation in China: A Transition Perspective, 25 Renewable & Sustainable Energy Revs. 782, 788-89 (2013); see also Mo-lin Huo & Dan-wei Zhang, Lessons from Photovoltaic Policies in China for Future Development, 51 Energy Pol’y 38, 39 (2012).
122) Davies & Allen, supra note 64, at 1003-05; Pablo del Río González, Ten Years of Renewable Electricity Policies in Spain: An Analysis of Successive Feed-in Tariff Reforms, 36 Energy Pol’y 2917, 2928 (2008).
for instance, can reduce incentives for distributed solar, but solar-specific tenders might expand overall use of the resource. Further, the various changes to solar support schemes often interact, almost like a chemical reaction. For example, reductions in or limits on compensation in NEM schemes might on their own hinder small-scale solar deployment in the short-term, but inclusion of solar-specific targets in RPSs might dampen that effect, or at least encourage larger-scale projects that otherwise might not have been built.
It is imperative, then, to recognize that the various changes occurring in policies to promote solar are not independent. Indeed, while much of the scholarship to date has addressed changes to individual policies separately, a key contribution of this Article is the observation that these legal shifts are occurring simultaneously, in response to many of the same forces. Detailing how and why that is occurring, and what its implications are, is the primary objective of Part IV. First, however, it is necessary to describe the changes that have so quickly emerged in these laws.
A. NEM . . . to NEB?
The United States provides direct insight to the type of changes that net metering schemes have begun to undergo. In 2015, twenty-seven jurisdictions in the United States took regulatory action on their net metering policies.123 Of these, three states
—California, Hawaii, and Nevada—adopted successor regimes to their prior net metering laws.124 Almost immediately, this sent waves throughout the solar community, prompting one prominent report to ask whether the alteration of these regimes represented “the beginning of the end of net metering.”125
The question is legitimate. Twenty-four states in the U.S. “formally examined or resolved to examine some element of the value of solar or distributed generation more broadly” during 2015.126 The reasons given for doing so ranged widely, from aiming to better educate regulators, to improving integrated resource planning, to
123) North Carolina Clean Energy Technology Center & Meister Consultants Group, The 50 States of Solar: 2015 Policy Review and Q4 Quarterly Report, 13, 17 (Feb. 2016) [hereinafter 50 States of Solar].
124) Id. at 17.
125) Id. For more on NEM changes in other countries, see, e.g., Rodolfo Dufo-Lopez & Jose L.
Bernal-Agustiɩn, A Comparative Assessment of Net Metering and Net Billing Policies.
Study Cases for Spain, 84 Energy 684 (2015); David Watts et al., Potential Residential PV Development in Chile: The Effect of Net Metering and Net Billing Schemes for Grid-Connected PV Systems, 41 Renewable & Sustainable Energy Revs. 1037 (2015).
126) 50 States of Solar, supra note 123, at 19.