저작자표시-비영리-변경금지 2.0 대한민국 이용자는 아래의 조건을 따르는 경우에 한하여 자유롭게
l 이 저작물을 복제, 배포, 전송, 전시, 공연 및 방송할 수 있습니다. 다음과 같은 조건을 따라야 합니다:
l 귀하는, 이 저작물의 재이용이나 배포의 경우, 이 저작물에 적용된 이용허락조건 을 명확하게 나타내어야 합니다.
l 저작권자로부터 별도의 허가를 받으면 이러한 조건들은 적용되지 않습니다.
저작권법에 따른 이용자의 권리는 위의 내용에 의하여 영향을 받지 않습니다. 이것은 이용허락규약(Legal Code)을 이해하기 쉽게 요약한 것입니다.
Disclaimer
저작자표시. 귀하는 원저작자를 표시하여야 합니다.
비영리. 귀하는 이 저작물을 영리 목적으로 이용할 수 없습니다.
변경금지. 귀하는 이 저작물을 개작, 변형 또는 가공할 수 없습니다.
의학석사 학위논문
두개 내 신경 교종의 18 F-FDOPA 섭취에 영향을 미치는 임상병리학적 소견에 대한 평가
Evaluation of clinicopathologic findings affecting
18F-FDOPA uptake of intracranial glioma
울 산 대 학 교 대 학 원 의 학 과
[UCI]I804:48009-200000291322 [UCI]I804:48009-200000291322
두개 내 신경 교종의 18 F-FDOPA 섭취에 영향을 미치는 임상병리학적 소견에 대한 평가
지 도 교 수 김 재 승
이 논문을 의학석사 학위 논문으로 제출함.
2020년 2월
울 산 대 학 교 대 학 원
의 학 과
신언우의 의학석사 학위 논문을 인준함
심사위원 오 정 수 (인) 심사위원 오 민 영 (인) 심사위원 김 재 승 (인)
울 산 대 학 교 대 학 원
2020 년 2 월
Abstract
Purpose: While 18F-FDOPA PET is clinically useful in the evaluation of brain tumors, tumor uptake of 18F-FDOPA are known to vary. We investigated clinical, genetic, pathologic findings and MR findings that could affect 18F-FDOPA uptake of intracranial gliomas to improve the interpretation of 18F-FDOPA PET and the determination of therapeutic plans based on it.
Methods: We retrospectively reviewed 21 consecutive patients (M/F=13/8; median age 50 years; age range 21-72 years) with pathologically confirmed intracranial glioma and 9 patients (M/F=4/5; median age 49 years, age range 31-62 years) with non-tumorous lesions, who underwent both 18F-FDOPA brain PET/CT and brain MR imaging for preoperative evaluation from July 2015 to June 2018. 18F-FDOPA PET images were acquired during 30min immediately after injection. We calculated SUV ratio (SUVR) of lesion to reference (contralateral striatum or contralateral normal white matter) on 10-30 min summed image and the washout ratio of SUVR. In glioma patients, we evaluated the association between FDOPA uptake and clinicopathologic findings including the histology, tumor grade, IDH mutations and conventional MR findings (tumor size, location, laterality, gadolinium enhancement, proportion of non-contrast enhancing tumor, proportion of necrosis, and proportion of edema), and perfusion MR parameters (leakage-correlated rCBV/rCBF, vascular permeability).
Results: 18F-FDOPA uptake of gliomas in terms of SUVRstriatum and SUVRwhite matte was significantly higher than no-tumorous lesions (p<0.001). SUVRstriatum was associated with tumor grade, IDH mutation, histology, proportion of necrosis on MRI (p<0.05). Only proportion of non-enhancement on MRI is associated with SUVRwhite matter(p=0.005). There were no clinicopathologic findings associated with the washout of 18F-FDOPA uptake in gliomas (p>0.05). There was no significant correlation between SUVR and perfusion MR parameters in gliomas (p>0.05), although there was a positive correlation between the degree of gadolinium enhancement on MRI and SUVRStriatum (Spearman’s rho=0.881, p=0.002) or SUVRWhite matter(Spearman’s rho=0.991, p=0.001) in non-tumorous lesions.
Conclusion: 18F-FDOPA uptake of glioma was tumor specific with minimal effect of BBB breakage and associated with IDH mutation and histology. Further studies with a larger number of cases and molecular features such as LAT1 is needed to better understand the related mechanism of these clinicopathologic features and 18F-FDOPA uptake in glioma.
Contents
Abstract……….……….……….……… i
List of Figures……….………….……….………. iii
List of Tables………..……….…….….. iv
Introduction……….……….…..…… 1
Materials and Methods……….………..……… 2
Results………...… 5
Discussion……….…....8
Conclusion………... 12
국문요약……….... 27
List of Figures
Figure 1 Flow diagram showing inclusion and exclusion criteria of glioma and non-tumorous
groups…………..21
Figure 2 Representative images of quantitative analysis of MR parameters……….….……...22 Figure 3 18F-FDOPA uptake and washout according to pathologic features.…….……..………… 23 Figure 4Representative cases showing VOIs on 18F-FDOPA PET and MR images of low grade
oligodendroglioma with IDHmutation and glioblastoma withIDHwild-type……..…... 24 Figure 5 Correlation between SUVRwhite matterand perfusion MR parameters………...……. 25 Figure 6 FDOPA uptake in non-tumorous lesions………..…….……...….. 26
List of Tables
Table 1 Clinicopathologic characteristics of glioma patients…………...……….……...….. 16
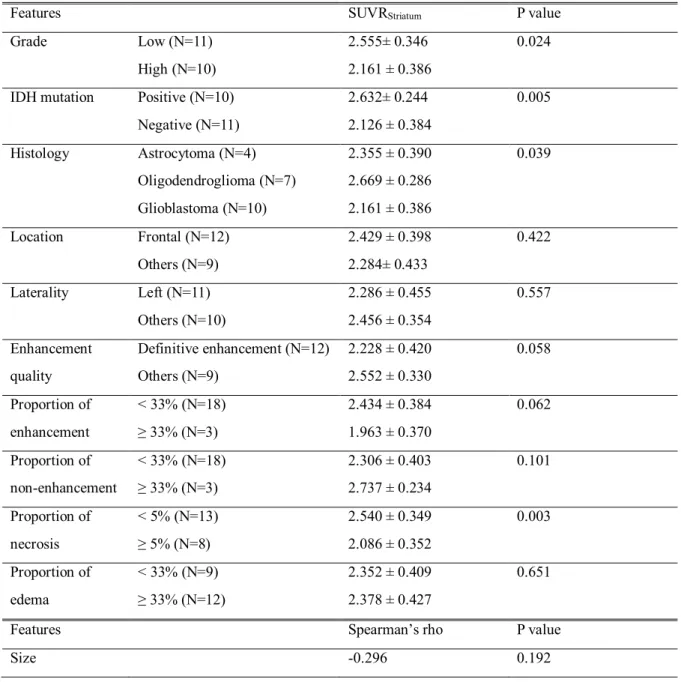
Table 2 Association between SUVRStriatumand clinicopathologic features.………...…… 17
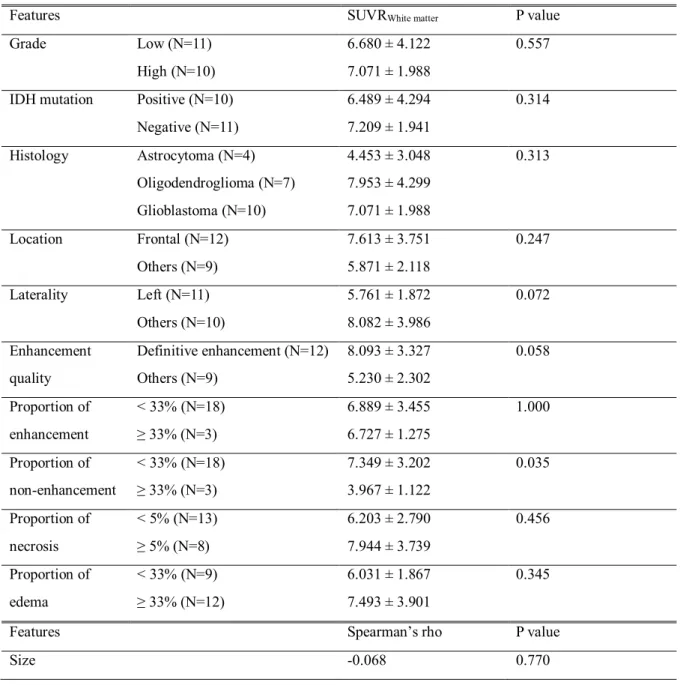
Table 3 Association betweenSUVRWhite matter clinicopathologic features……….…...….. 18
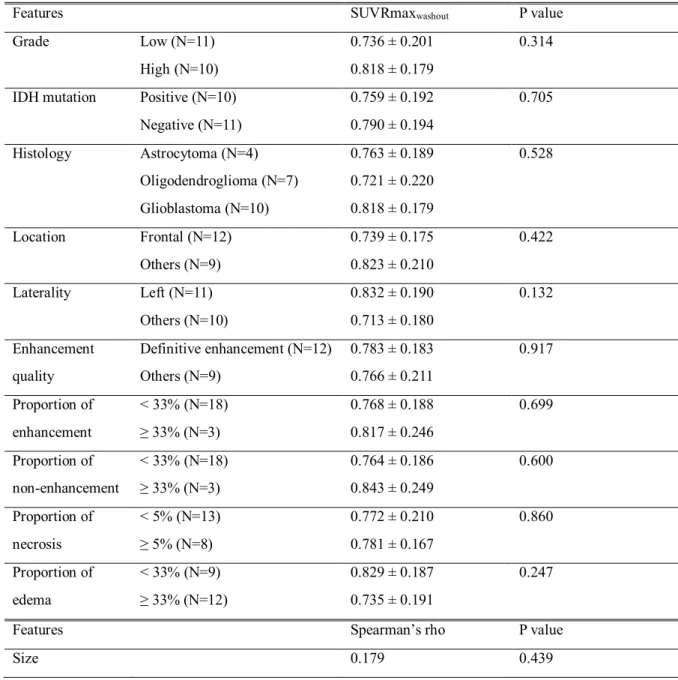
Table 4 Association between SUVRmaxwashoutand clinicopathologic features.………...….. 19
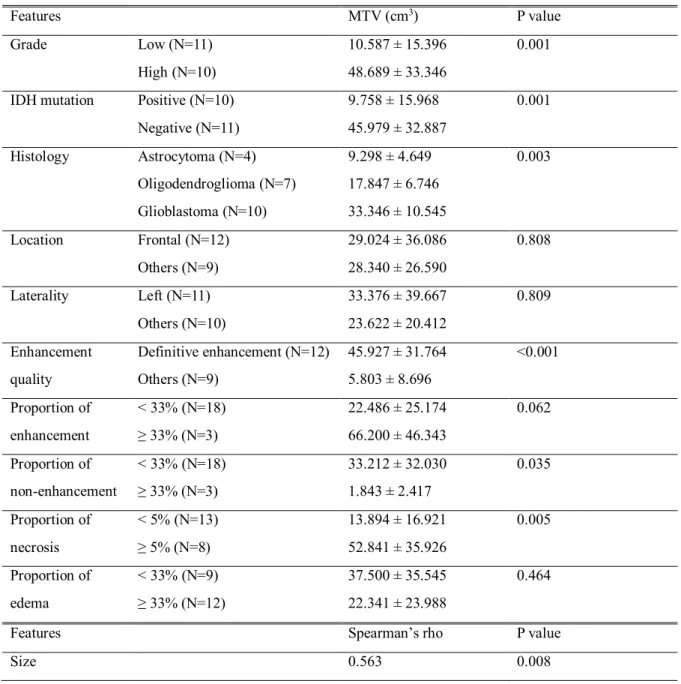
Table 5 Association between MTVand clinicopathologic features.……….……...….. 20
Introduction
Positron emission tomography (PET) imaging with amino acid analogues has known to show a high tumor to background contrast in the brain, and enables the depiction of the whole tumor mass with their ability to pass through the intact blood-brain barrier (BBB). Therefore, radiolabeled amino acid PET imaging is useful for differential diagnosis of brain tumors, delineation of tumor extent for treatment planning and biopsy guidance, differentiation between tumor progression and recurrence versus treatment-related changes, and for monitoring of therapy [1-3]. Response Assessment in Neuro-Oncology working group (RANO) consider radiolabeled amino acid PET as clinically helpful and suggest its use for managing patients with brain tumors additionally to MRI [4]. 3,4-dihydroxy-6- [18F]-fluoro-L-phenylalanine (18F-FDOPA) is one of the most widely used amino acid
radiopharmaceuticals in the world and has recently been approved for clinical use in Korea.
In order to increase the clinical application of 18F-FDOPA PET, accurate interpretation of PET images is important, and it is necessary to understand the relationship between various
clinicopathologic features on 18F-FDOPA uptake of the tumor. Previous studies with 18F-FDOPA PET showed higher 18F-FDOPA uptake related to higher LAT1 expression [5], higher Ki-67 expression [6, 7], and presence of IDHmutation [8] in brain tumors. Although the positive correlation between 18F- FDOPA uptake and tumor grade is controversial, recent reports showed favorable result in untreated gliomas [6, 9]. One study that investigated both 18F-FDOPA uptake and multiple parameter of diffusion and perfusion MR in low grade glioma showed no correlation between 18F-FDOPA uptake and diffusion and perfusion MR parameters [10]. There are several 18F-FDOPA parameters worth considering other than conventional parameters like standardized uptake value (SUV) and its derivations. Dynamic parameter of 18F-FDOPA showed predictive value of molecular features of gliomas [11]. Metabolic tumor volume (MTV) was investigated as tumor response marker in previous studies [12, 13].
To date, many studies have been reported to investigate the clinical utility of 18F-FDOPA PET.
However, limited data have been reported regarding the relationship between various 18F-FDOPA parameters and clinicopathologic features, and the results are controversial, although it might reveal novel insight about 18F-FDOPA uptake in glioma.
Therefore, we investigated retrospectively clinical, genetic, pathologic findings and MR findings that could affect 18F-FDOPA uptake of intracranial gliomas to improve the interpretation of 18F-FDOPA PET and the determination of therapeutic plans based on it.
Materials and methods
Patients
We reviewed clinical data of all patients who underwent both 18F-FDOPA PET/CT and MR scans within a month to evaluate untreated brain lesion between July 2016 and October 2018 at Asan Medical Center and included subjects who fulfilled one of the following criteria (a) pathology-proven intracranial glioma; (b) pathology-proven non-neoplastic lesion; (c) decreased lesion size for at least 6 months in following MR in this retrospective analysis.
Fig. 1is a flow diagram showing inclusion and exclusion criteria with number of subjects of each group. There were 21 patients with pathology-proven intracranial glioma and 11 patients with non- tumorous lesions. Among 21 patients with pathology-proven intracranial glioma, 15 patients who underwent DSC-MRI were further analyzed with perfusion MR parameter.
This study was approved by the Asan Medical Center Institutional Review Board for Human Research. Written informed consent was waived
18F-FDOPA PET/CT recording and reconstruction
18F-FDOPA PET/CT scans were obtained on 1 of 3 scanners: GE Discovery D690, GE Discovery 690 ELITE, GE Discovery D710 (GE Medical Systems, Milwaukee, USA). All patients fasted for at least 4 h, and did not take Carbidopa. The CT scan was first recorded and immediately followed by a 30-min 3D list-mode PET recording initiated during the bolus injection of 185 MBq of 18F-FDOPA, which was synthesized by the previously reported procedure [14]. The static PET images were reconstructed with the list mode data acquired from 10 to 30-min post-injection [15] while the additional PET images involved 6 consecutive frames of 5 min each were reconstructed with the list mode data acquired from 0 to 30 min post-injection. All images were reconstructed with VPFX-S algorithm (4 iterations, 24 subsets, 2 mm Gaussian filter), corrected for attenuation, scatter, radioactive decay, and displayed in a 256×256 matrix with 1.17×1.17×3.75 mm3voxel.
Quantitative analyses of PET images
Three Volume of interest (VOIs) were placed on the static PET images using a dedicated software (syngo.via VB20A software; Siemens, Erlangen, Germany). Two spherical VOIs of 6 mm diameter were located on the tumor area of maximum uptake for determining maximal standardized uptake value (SUVmax) of the tumor, and on the contralateral striatum as the reference tissue for determining
mean standardized uptake value (SUVmeanWhite matter), respectively. Another spherical VOI of 14 mm diameter was located on contralateral white matter usually at the level of centrum semiovale as the reference tissue for determining mean standardized uptake value (SUVmeanWhite matter). SUV ratio of tumor to reference tissues were calculated (SUVRStriatumand SUVRWhite matter, respectively).
Additionally, SUVmax values were obtained on static images of 5 to 10 min and 25 to 30 min on the same VOIs described before (SUVmax5-10and SUVmax25-30, respectively) and then SUVmaxwashout
was calculated with SUVmax5-10as the denominator and SUVmax25-30 as the numerator. MTV was obtained through a 3D auto-contouring process with a threshold corresponding to the SUV mean of the contralateral striatum [12].
MR protocol and image post-processing
All MRI studies were performed using a 3-T MR system (1.5T, Achieva, Philips Healthcare, Best, The Netherlands) with an 8-channel sensitivity encoding head coil. The dedicated MR protocol for brain tumors at our institution consisted of T2-weighted imaging, FLAIR, T1-weighted imaging, diffusion weighted image (DWI), CE-T1WI and dynamic susceptibility contrast MRI (DSC-MRI), but some of the MRI studies were performed outside hospital and DSC-MRI were not available in those cases.
DSC-MRI was acquired using a gradient-echo echo-planar imaging protocol. A preload of 0.01 mmol/kg gadoterate meglumine (DOTAREM®, Guerbet) was given before the dynamic bolus, then the dynamic bolus was administered as a standard dose of 0.1 mmol/kg gadoterate meglumine delivered at a rate of 4 mL/s by a MRI-compatible power injector (Spectris; Medrad). The bolus of contrast material was followed by a 20 mL bolus of saline, injected at the same rate. The parameters for the DSC-MRI included the following: repetition time (TR)/echo time (TE), 1808/40 ms; flip angle, 35°; field of view, 24 × 24 cm; slice thickness/gap, 5/2 mm; matrix, 128 × 128; total acquisition time, 1 min and 54 s. The dynamic acquisition was performed with a temporal resolution of 1.5 s, and 60 dynamics were acquired.
DSC-MRI data were transferred to an independent workstation and processed using nordicICE (V.4.0.6; NordicNeuroLab AS) software. Cerebral blood flow (CBF), corrected cerebral blood volume (CBV), and permeability index maps were generated after verification of an automatically detected arterial input function (AIF). All perfusion parameters were then normalized by dividing tumoral values by the normal contralateral value to obtain relative ratios (leakage-correlated rCBF, leakage- correlated rCBV, and K2, respectively).
Analysis of DSC-MRI
In case of patients with DSC MR, additional processing was performed. All reconstructed PET images, parameteric map of leakage-correlated rCBF/rCBV, and K2maps were spatially normalized to the baseline T2-weighted MR image using SPM8 (Wellcome Department of Imaging Neuroscience, Institute of Neurology, UCL, London, UK) with Matlab 2018a for Windows (MathWorks, Natick, MA). The VOIs of 7 mm diameter were positioned manually using editing in house software (ANIQUE) on the tumor area of maximum uptake. The additional VOIs (7 mm diameter on MR, 6 mm diameter on PET) were centered on gadolinium enhanced portion, and non-enhanced portion, if such portion was detected on MR to generate values of MR parameters and SUVmax of almost same tumor area. Example of quantitative analysis of MR parameter is presented on Fig. 2.
Clinicopathologic features
Pathologic features included tumor grade based on 2016 WHO classification, histology, IDH mutation and clinical features included age and sex. Conventional MR features were derived and modified from VASARI MRI feature set
(https://wiki.cancerimagingarchive.net/display/Public/VASARI+Research+Project)[16] and including following features: (a) location (frontal lobe vs. others); (b) laterality (left vs. others); (c)
enhancement quality (definitive enhancement vs. others); (d) proportion of enhancement (<33% vs.
≥33%); (e) proportion of non-enhancement (<33% vs. ≥33%); (f) proportion of necrosis (<5% vs.
≥5%); (g) proportion of edema (<33% vs. ≥33%). The MR feature of enhancement quality was evaluated in non-tumorous lesions in three staged scales; no enhancement, faint enhancement, definitive enhancement.
Statistical analysis
We used a Mann-Whitney U test or Kruskal-Wallis test to evaluate the correlation between various
18F-FDOPA uptake parameters and clinic-pathologic features. Benjamini-Hochberg procedure was used as post-hoc correction method after Kruskal-Wallis test. The Spearman correlation coefficients between the variables were calculated. The Statistical Package for the Social Sciences (SPSS) for Windows (version 21.0; SPSS Inc.) was used for the statistical analyses, and the Pvalue of less than 0.05 was considered statistically significant. Data for the study variables were expressed as the mean
± standard deviation (SD).
Results
Patient characteristics
The clinical characteristics of individual patient are presented in Table 1. There were 21 patients (13 men and 8 women, mean age of 50.1 ± 15.2 years, ranging from 21 to 72 years) with 11 low grade gliomas (four astrocytoma and seven oligodendroglioma) and 10 glioblastomas. Ten out of 11 low grade gliomas had IDHmutation while all of 10 high grade glioma was IDH wild type.
There are nine patients (M/F=4/5; median age 49 years, age range 31-62 years) with non-tumorous lesions. Among these, three were confirmed as reactive gliosis, non-neoplastic necrotic lesion, and perivascular lymphoproliferative infiltration by pathology and other cases showed decreased size of brain lesions without specific treatment (Fig. 1).
Association between 18F-FDOPA uptake and clinicopathologic features
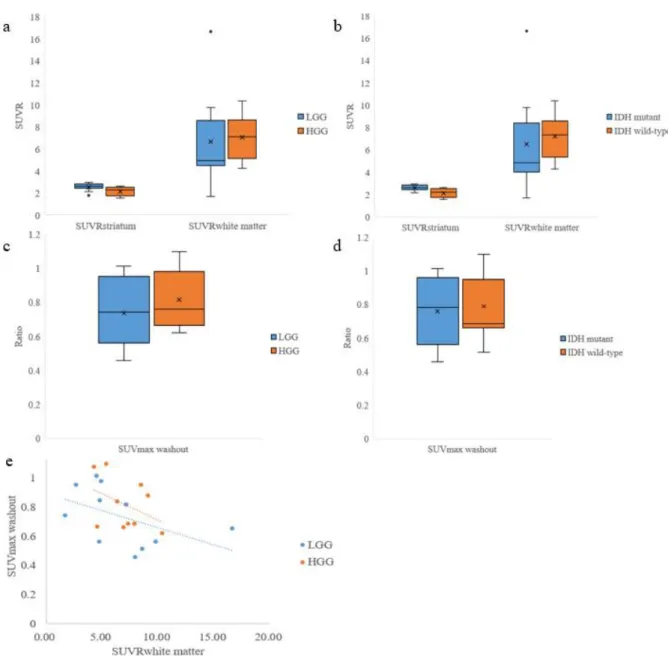
Association of SUVRStriatumand clinicopathologic features are shown in Table 2. Patients with low grade glioma (p=0.024) (Fig. 3a), IDHmutation (p=0.005) (Fig. 3b), smaller proportion of necrosis on MRI (p=0.003) had significant higher SUVRStriatum. There was significant relationship between SUVRStriatumand pathology (p=0.039), with post-hoc test showing significantly higher SUVRStriatumof oligodendroglioma than glioblastoma (2.669 ± 0.286 vs. 2.161 ± 0.386, p=0.014). Smaller proportion of enhancement on MRI showed higher SUVRStriatum(2.434 ± 0.384 vs. 1.963 ± 0.370, p=0.062) although statistically insignificant.
Association of SUVRWhite matterand clinicopathologic features are shown in Table 3. Only smaller proportion of non-enhancement on MRI showed significant higher SUVRWhite matterthan the others (7.349 ± 3.202 vs. 3.967 ± 1.122, p=0.005). There was no statistically significant difference between low grade and high grade glioma (6.680 ± 4.122 vs. 7.071 ± 1.988, p=0.557) (Fig. 3a), and between IDHmutation and wild type (6.489 ± 4.294 vs. 7.209 ± 1.941, p=0.314) (Fig. 3b), unlike SUVRStriatum. Glioma with definite enhancement showed higher SUVRWhite matterthan others with borderline
significance (5.230 ± 2.302 vs. 8.093 ± 3.327, p=0.058). Representative cases are presented in Fig. 4.
Association between 18F-FDOPA washout and clinicopathologic features
Association of SUVmaxwashoutand clinicopathologic features are shown in Table 4. There was no statistically significant association of SUVmaxwashoutand grade of glioma (p=0.325) (Fig. 3c) and IDH mutation (p=0.705) (Fig. 3d). There was no significant correlation of SUVRWhite matterand SUVmaxwashout
in both high grade glioma (Spearman’s rho=-0.309, p=0.385) and low grade glioma (Spearman’s rho=- 0.482, p=0.133)(Fig. 3e).
Association between MTV and clinicopathologic features
Association of MTV and clinicopathologic features are shown in Table 5. Gliomas with higher grade (10.587 ± 15.396 vs. 48.689 ± 33.346, p=0.001), IDHwild-type (9.758 ± 15.968 vs. 45.979 ± 32.887, p=0.001), definitive enhancement (45.927 ± 31.764 vs. 5.803 ± 8.696, p=0.001), smaller proportion of non-enhancement (33.212 ± 32.030 vs. 1.843 ± 2.417, p=0.001), larger proportion of necrosis (52.841
± 35.926 vs. 13.894 ± 16.921, p=0.005) on MRI showed larger MTV than others. There was significant correlation between MTV and pathology (p=0.039), with post-hoc test showing significant larger MTV in glioblastoma (p=0.010) and in astrocytoma (p=0.004). There was positive correlation between tumor size and MTV (Spearman’s rho=0.563, p=0.008).
Association between 18F-FDOPA uptake and perfusion MR parameters
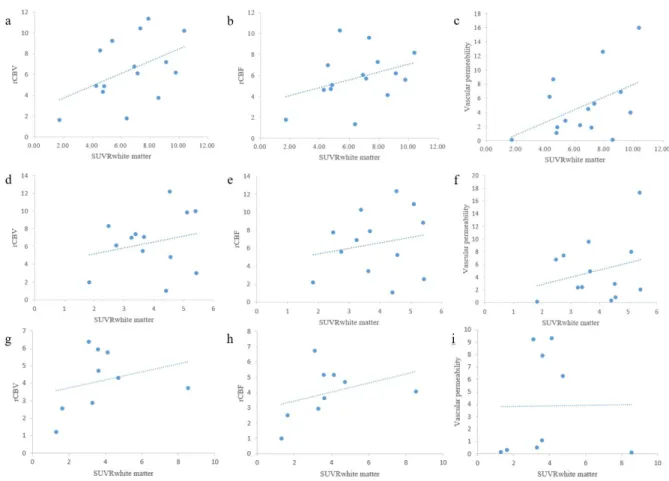
The values of leakage-correlated rCBV/rCBF, and vascular permeability of the regions of maximum tumor uptake in 15 patients with DSC-MRI were 6.450 ± 3.022, 5.808 ± 2.474, and 4.900 ± 4.579, respectively. Each of the perfusion MR parameters showed no significant correlation with SUVRWhite matter (Fig. 5a-c).
Thirteen out of 15 patients with DSC-MRI showed enhanced portion in glioma. The values of leakage-correlated rCBV/rCBF, vascular permeability of these region were 6.454 ± 3.260, 6.506 ± 3.569, and 4.973 ± 4.827, respectively. Each of the MR parameters showed no significant correlation with SUVRWhite matter (Fig. 5d-f).
Nine of 15 patients with DSC-MRI showed measurable non-enhanced portion. The values of leakage- correlated rCBV/rCBF, and vascular permeability were 4.151 ± 1.736, 3.978 ± 4.186, and 3.870 ± 4.186, respectively. Each of the MR parameters showed no significant correlation with SUVRWhite matter (Fig.
5g-i).
18F-FDOPA uptake of non-tumorous lesions
Eleven non-tumorous lesions showed significantly lower FDOPA uptake than gliomas in terms of SUVRStriatum(0.690 ± 0.301 vs. 2.310 ± 1.055, respectively, p<0.001) and SUVRWhite matter(2.261 ± 1.205 vs. 7.529 ± 3.643, respectively, p<0.001) (Fig. 6a).
There was positive correlation between the quality of gadolinium enhancement on conventional
MRI and 18F-FDOPA uptake in terms of SUVRStriatum(Spearman’s rho=0.881, p=0.002) and SUVRWhite matter(Spearman’s rho=0.991, p=0.001) (Fig. 6b).
Discussion
We investigated the association between 18F-FDOPA uptake of glioma and clinicopathologic features including conventional and perfusion MR features as well as well-known clinicopathologic features such as WHO tumor grade, IDHmutation in this study. In the results, 18F-FDOPA uptake of gliomas was significantly higher than no-tumorous lesions. SUVRstriatumwas associated with tumor grade, IDHmutation, histology, proportion of necrosis on MRI. Only proportion of non-enhancement on MR is associated with SUVRwhite matter. There were no clinico-pathologic findings associated with the washout of 18F-FDOPA uptake in gliomas. There was no significant correlation between SUVR and perfusion MR parameters in gliomas, although there was a positive correlation of gadolinium enhancement on MRI and SUVR in non-tumorous lesions.
In this study, 18F-FDOPA uptake was quantified by SUVR of glioma with striatum and white matter as reference tissue, wash rate of SUVR, and MTV. Because 18F-FDOPA shows specific uptake in the liver, pancreas, adrenal glands, basal ganglia, and shows activity in excretory organs of gallbladder, biliary tract, kidneys, ureters, urinary bladder [17], medical condition of these organ might affect 18F- FDOPA uptake in glioma. Therefore, we used SUVR rather than SUV for the quantification of FDOPA uptake.
The first study to mention diagnostic feasibility of 18F-FDOPA PET to distinguish low grade glioma from high grade glioma was published in 2003 [9]. That study was originally designed to compare
11C-methionine and 18F-FDOPA uptake in glioma and showed that it is feasible to distinguish tumor from non-tumorous lesion, but it is hard to distinguish low grade glioma from high grade glioma by
18F-FDOPA uptake. However, that study included multiple tumors treated with surgery, radiation, chemotherapy, which might affect radiotracer uptake in tumor. Fueger et al. showed significant correlation of 18F-FDOPA uptake with different tumor grades although several studies showed controversial results of diagnostic feasibility of 18F-FDOPA PET regarding the grading of brain tumor [6] and Nioche et al. reported a threshold of 2.8 of SUVmax to identify high grade gliomas in newly- diagnosed patients with sensitivity and specificity of 0.90 and 0.80, respectively [18]. In this study with untreated glioma, 18F-FDOPA uptake in terms of SUVRStriatumwas higher in low grade glioma than in high grade glioma and, SUVRWhite mattershowed no correlation to tumor grade. This results are inconsistent to the previous reports. Verger et al., however, reported that glioma with IDHmutation showed higher 18F-FDOPA uptake than IDHwild-type, and even ‘paradoxically’ higher 18F-FDOPA in low grade glioma with IDHmutation than in high grade glioma with IDHwild-type [8]. This is
consistent with the finding of this study that higher SUVRStriatumis observed in IDHmutation glioma than in IDHwild-type. As shown in Table 2, IDHmutation were found only in low grade glioma and not in high grade glioma, so that IDH mutations were not evenly distributed in this study. Considering the effect of IDHmutation on 18F-FDOPA uptake and skewed demography, relationship between tumor grade and 18F-FDOPA uptake in this study might be explained. From another point of view, the report of ‘paradoxically’ higher uptake is made after introduction of 2016 WHO classification, the consideration of molecular parameters in tumor grading since 2016 might be related to the
inconsistency with earlier reports.
In this study, SUVRWhite matter showed significantly higher uptake only in cases with smaller proportion of non-enhancement MR although SUVRStriatumof the glioma was affected by several clinicopathologic features including WHO tumor grade, IHDmutation, histology, and proportion of necrosis on MRI. This finding should be interpreted as association with tumor portion other than non- enhanced portion, which include usual MR feature of high grade glioma, because tumor is thought to consist of four major component (enhanced portion, non-enhanced portion, necrotic portion,
edematous portion) in VASARI feature. And different results between SUVRStriatumand SUVRWhite matter
may result from the inconsistent VOI locations of reference regions that are small and susceptible to partial volume effect to adjacent tissue such as CSF.
SUVmaxwashoutdid not showed any correlation with clinic-pathologic features in this study.
Considering that SUVRWhite matterand SUVmaxwashoutdid not showed any correlation with each other, SUVmaxwashoutmay show different aspect of glioma although there was no suggesting data in this study results. Further study with full kinetic data is needed.
This study evaluated also the association between clinicopathologic features and MTV which is not a frequently used quantitative parameter of 18F-FDOPA PET for the evaluation of glioma. There were two studies reporting MTV as prognostic or predictive markers in therapy of brain tumor [12, 13], and one study reporting MTV as predictive marker to evaluate gene mutation in brain tumor [11]. In this study, MTV had association with tumor grade, IDHmutation, histology, enhancement quality on MRI, and proportion of non-enhancement and necrosis on MRI, and showed strong correlation with tumor size. Because high grade tumors usually have larger size and well-enhanced portion, this result is consistent with well-known facts of brain tumor. Further research evaluating MTV as a prognostic biomarker might be needed for enhancing the clinical application of 18F-FDOPA PET.
This study is the first study investigating the correlation between perfusion MR features and 18F- FDOPA uptake. Vascular permeability is calculated in contrast-enhanced MR to correct discrepancy
between assumption of intact BBB and actual leakage of MR contrast through damaged BBB.
Therefore, vascular permeability might reflect BBB breakage which might affect 18F-FDOPA uptake at tumor tissue. The vascular permeability of glioma is thought to be measurable as perfusion MR parameter vascular permeability (k2) [19]. As an radiotracer, blood flow might also take role in 18F- FDOPA uptake [20]. Perfusion MR parameters such as leakage-correlated rCBF/rCBV reflect blood flow. All of these perfusion MR parameters did not show significant correlation with 18F-FDOPA uptake in the portion of maximum 18F-FDOPA uptake, enhanced portion, and non-enhanced portion although those showed some positive tendency. On the other hand, there was a positive correlation between enhancement quality on conventional MRI and 18F-FDOPA uptake in non-tumorous lesions.
Based on these results, we could guess that blood flow or blood brain barrier breakage are not the most considerable factors although it has some effect on 18F-FDOPA uptake in glioma. Otherwise, blood brain barrier breakage can have a significant effect on 18F-FDOPA uptake by passive diffusion into the non-tumorous lesion without specific uptake.
This study has several limitations. Firstly, the effect of IDHmutation in 18F-FDOPA uptake could not be fully evaluated because IDHmutation was not distributed evenly in low grade and high grade glioma groups, probably due to retrospective manner of this study. Secondly, several statistically insignificant results might be occurred due to small number of gliomas (n=21). Further studies with larger number of cases might overcome this weakness. Lastly, investigating the effect of molecular features from immunohistochemical (IHC) staining such as Ki67 or LAT1 on 18F-FDOPA uptake was limited by the lack of data. The mechanism of amino acid radiotracers including 18F-FDOPA are still remain to be fully understood. It is generally considered that the uptake of amino acid derived radiotracer in brain tumor is carried out with L-system amino acid transporters particularly, with LAT1 transporter in case of 18F-FDOPA [5, 21]. Nonetheless LAT1 transporters are overexpressed in brain tumors including gliomas, the intensity of 18F-FDOPA uptake is not correlated with the level of LAT1 expression [22]. Molecular parameters became important since the introduction of WHO 2016 classification, which provides more accurate characterization of brain tumor with regard to prognostic and therapeutic outcomes than previous classification, especially the presence or absence of IDH mutation and 1p/19qco-deletion [23]. IDH isoform of IDH1 and IDH2 area key Kreb cycle enzymes that are nicotinamide adenine dinucleotide phosphate (NADP+)-dependent and catalyze the oxidative decarboxylation of isocitrate to α–ketoglutarate (α-KG) [24]. IDH mutation induces the ability to catalyse NADPH-dependent reduction of α-KG to α-hydroxyglutarate (2-HG), leads to an excess of 2- HG in the cell, and eventually causes development of alternative molecular pathways [25]. One study
postulated this altered metabolism leads to a decrease in amino acid metabolism, including tyrosine and facilitated amino acid exchange with 18F-FDOPA via the amino acid transporter [8]. It is reasonable to consider other tumor specific factors, such as LAT1 expression or unknown pathway associated with gene mutation including IDH mutation, as influential factor in 18F-FDOPA uptake.
Conclusion
18F-FDOPA uptake of glioma was tumor specific with minimal effect of BBB breakage and associated with IDH mutation and histology. Further studies with a larger number of cases and molecular features such as LAT1 is needed to better understand the related mechanism of these clinicopathologic features and 18F-FDOPA uptake in glioma.
References
1. Filss CP, Cicone F, Shah NJ, Galldiks N, Langen KJ. Amino acid PET and MR perfusion imaging in brain tumours. Clin Transl Imaging. 2017;5:209-23.
2. Langen KJ, Galldiks N. Update on amino acid PET of brain tumours. Curr Opin Neurol. 2018;31:354- 61.
3. Langen KJ, Galldiks N, Hattingen E, Shah NJ. Advances in neuro-oncology imaging. Nat Rev Neurol.
2017;13:279-89.
4. Albert NL, Weller M, Suchorska B, Galldiks N, Soffietti R, Kim MM, et al. Response Assessment in Neuro-Oncology working group and European Association for Neuro-Oncology recommendations for the clinical use of PET imaging in gliomas. Neuro Oncol. 2016;18:1199-208.
5. Youland RS, Kitange GJ, Peterson TE, Pafundi DH, Ramiscal JA, Pokorny JL, et al. The role of LAT1 in (18)F-DOPA uptake in malignant gliomas. J Neurooncol. 2013;111:11-8.
6. Fueger BJ, Czernin J, Cloughesy T, Silverman DH, Geist CL, Walter MA, et al. Correlation of 6-18F- fluoro-L-dopa PET uptake with proliferation and tumor grade in newly diagnosed and recurrent gliomas. J Nucl Med. 2010;51:1532-8.
7. Karavaeva E, Harris RJ, Leu K, Shabihkhani M, Yong WH, Pope WB, et al. Relationship Between [18F]FDOPA PET Uptake, Apparent Diffusion Coefficient (ADC), and Proliferation Rate in Recurrent Malignant Gliomas. Mol Imaging Biol. 2015;17:434-42.
8. Verger A, Metellus P, Sala Q, Colin C, Bialecki E, Taieb D, et al. IDH mutation is paradoxically associated with higher (18)F-FDOPA PET uptake in diffuse grade II and grade III gliomas. Eur J Nucl Med Mol Imaging. 2017;44:1306-11.
9. Becherer A, Karanikas G, Szabo M, Zettinig G, Asenbaum S, Marosi C, et al. Brain tumour imaging with PET: a comparison between [18F]fluorodopa and [11C]methionine. Eur J Nucl Med Mol Imaging.
2003;30:1561-7.
10. Rossi Espagnet MC, Romano A, Mancuso V, Cicone F, Napolitano A, Scaringi C, et al.
Multiparametric evaluation of low grade gliomas at follow-up: comparison between diffusion and perfusion MR with (18)F-FDOPA PET. Br J Radiol. 2016;89:20160476.
11. Ginet M, Zaragori T, Marie PY, Roch V, Gauchotte G, Rech F, et al. Integration of dynamic parameters
in the analysis of (18)F-FDopa PET imaging improves the prediction of molecular features of gliomas.
Eur J Nucl Med Mol Imaging. 2019
12. Schwarzenberg J, Czernin J, Cloughesy TF, Ellingson BM, Pope WB, Grogan T, et al. Treatment response evaluation using 18F-FDOPA PET in patients with recurrent malignant glioma on bevacizumab therapy. Clin Cancer Res. 2014;20:3550-9.
13. Gauvain K, Ponisio MR, Barone A, Grimaldi M, Parent E, Leeds H, et al. (18)F-FDOPA PET/MRI for monitoring early response to bevacizumab in children with recurrent brain tumors. Neurooncol Pract.
2018;5:28-36.
14. Kim Y, Lee SJ, Yook CM, Oh SJ, Ryu JS, Lee JJ. Biological evaluation of new [(18) F]F-labeled synthetic amino acid derivatives as oncologic radiotracers. J Labelled Comp Radiopharm.
2016;59:404-10.
15. Law I, Albert NL, Arbizu J, Boellaard R, Drzezga A, Galldiks N, et al. Joint EANM/EANO/RANO practice guidelines/SNMMI procedure standards for imaging of gliomas using PET with radiolabelled amino acids and [(18)F]FDG: version 1.0. Eur J Nucl Med Mol Imaging. 2019;46:540-57.
16. The Cancer Imaging Archive. Wiki for the VASARI feature set. The National Cancer Institute Web site.
2015 [cited 2019 4 Dec]; Available from:
https://wiki.cancerimagingarchive.net/display/Public/VASARI+Research+Project
17. Chondrogiannis S, Marzola MC, Al-Nahhas A, Venkatanarayana TD, Mazza A, Opocher G, et al.
Normal biodistribution pattern and physiologic variants of 18F-DOPA PET imaging. Nucl Med Commun. 2013;34:1141-9.
18. Nioche C, Soret M, Gontier E, Lahutte M, Dutertre G, Dulou R, et al. Evaluation of quantitative criteria for glioma grading with static and dynamic 18F-FDopa PET/CT. Clin Nucl Med. 2013;38:81-7.
19. Skinner JT, Moots PL, Ayers GD, Quarles CC. On the Use of DSC-MRI for Measuring Vascular Permeability. AJNR Am J Neuroradiol. 2016;37:80-7.
20. Pike VW. PET radiotracers: crossing the blood-brain barrier and surviving metabolism. Trends Pharmacol Sci. 2009;30:431-40.
21. Papin-Michault C, Bonnetaud C, Dufour M, Almairac F, Coutts M, Patouraux S, et al. Study of LAT1 Expression in Brain Metastases: Towards a Better Understanding of the Results of Positron Emission Tomography Using Amino Acid Tracers. PLoS One. 2016;11:e0157139.
22. Dadone-Montaudie B, Ambrosetti D, Dufour M, Darcourt J, Almairac F, Coyne J, et al. [18F] FDOPA standardized uptake values of brain tumors are not exclusively dependent on LAT1 expression. PLoS One. 2017;12:e0184625.
23. Louis DN, Perry A, Reifenberger G, von Deimling A, Figarella-Branger D, Cavenee WK, et al. The 2016 World Health Organization Classification of Tumors of the Central Nervous System: a summary.
Acta Neuropathol. 2016;131:803-20.
24. Kaminska B, Czapski B, Guzik R, Krol SK, Gielniewski B. Consequences of IDH1/2 Mutations in Gliomas and an Assessment of Inhibitors Targeting Mutated IDH Proteins. Molecules. 2019;24 25. Metellus P, Colin C, Taieb D, Guedj E, Nanni-Metellus I, de Paula AM, et al. IDH mutation status
impact on in vivo hypoxia biomarkers expression: new insights from a clinical, nuclear imaging and immunohistochemical study in 33 glioma patients. J Neurooncol. 2011;105:591-600.
Table 1.Clinicopathologic characteristics of glioma patients
Patient Age Sex Pathology Grade IDH mutation
#1 32 F Diffuse astrocytoma II Mutant
#2 44 F Diffuse astrocytoma II Mutant
#3 32 M Diffuse astrocytoma II Mutant
#4 57 M Diffuse astrocytoma II Wild-type
#5 66 M Oligodendroglioma II Mutant
#6 47 M Oligodendroglioma II Mutant
#7 22 F Oligodendroglioma II Mutant
#8 46 M Oligodendroglioma II Mutant
#9 63 M Oligodendroglioma II Mutant
#10 50 M Oligodendroglioma II Mutant
#11 47 M Oligodendroglioma II Mutant
#12 72 M Glioblastoma IV Wild-type
#13 51 F Glioblastoma IV Wild-type
#14 65 M Glioblastoma IV Wild-type
#15 58 M Glioblastoma IV Wild-type
#16 21 M Glioblastoma IV Wild-type
#17 55 M Glioblastoma IV Wild-type
#18 70 F Glioblastoma IV Wild-type
#19 71 F Glioblastoma IV Wild-type
#20 43 F Glioblastoma IV Wild-type
#21 40 F Glioblastoma IV Wild-type
Table 2. Association between SUVRStriatumand clinicopathologic features
Features SUVRStriatum P value
Grade Low (N=11) 2.555± 0.346 0.024
High (N=10) 2.161 ± 0.386
IDH mutation Positive (N=10) 2.632± 0.244 0.005
Negative (N=11) 2.126 ± 0.384
Histology Astrocytoma (N=4) 2.355 ± 0.390 0.039
Oligodendroglioma (N=7) 2.669 ± 0.286 Glioblastoma (N=10) 2.161 ± 0.386
Location Frontal (N=12) 2.429 ± 0.398 0.422
Others (N=9) 2.284± 0.433
Laterality Left (N=11) 2.286 ± 0.455 0.557
Others (N=10) 2.456 ± 0.354
Enhancement quality
Definitive enhancement (N=12) 2.228 ± 0.420 0.058
Others (N=9) 2.552 ± 0.330
Proportion of enhancement
< 33% (N=18) 2.434 ± 0.384 0.062
≥ 33% (N=3) 1.963 ± 0.370
Proportion of non-enhancement
< 33% (N=18) 2.306 ± 0.403 0.101
≥ 33% (N=3) 2.737 ± 0.234
Proportion of necrosis
< 5% (N=13) 2.540 ± 0.349 0.003
≥ 5% (N=8) 2.086 ± 0.352
Proportion of edema
< 33% (N=9) 2.352 ± 0.409 0.651
≥ 33% (N=12) 2.378 ± 0.427
Features Spearman’s rho P value
Size -0.296 0.192
Table 3.Association between SUVRWhite matter and clinicopathologic features
Features SUVRWhite matter P value
Grade Low (N=11) 6.680 ± 4.122 0.557
High (N=10) 7.071 ± 1.988
IDH mutation Positive (N=10) 6.489 ± 4.294 0.314
Negative (N=11) 7.209 ± 1.941
Histology Astrocytoma (N=4) 4.453 ± 3.048 0.313
Oligodendroglioma (N=7) 7.953 ± 4.299 Glioblastoma (N=10) 7.071 ± 1.988
Location Frontal (N=12) 7.613 ± 3.751 0.247
Others (N=9) 5.871 ± 2.118
Laterality Left (N=11) 5.761 ± 1.872 0.072
Others (N=10) 8.082 ± 3.986
Enhancement quality
Definitive enhancement (N=12) 8.093 ± 3.327 0.058
Others (N=9) 5.230 ± 2.302
Proportion of enhancement
< 33% (N=18) 6.889 ± 3.455 1.000
≥ 33% (N=3) 6.727 ± 1.275
Proportion of non-enhancement
< 33% (N=18) 7.349 ± 3.202 0.035
≥ 33% (N=3) 3.967 ± 1.122
Proportion of necrosis
< 5% (N=13) 6.203 ± 2.790 0.456
≥ 5% (N=8) 7.944 ± 3.739
Proportion of edema
< 33% (N=9) 6.031 ± 1.867 0.345
≥ 33% (N=12) 7.493 ± 3.901
Features Spearman’s rho P value
Size -0.068 0.770
Table 4.Association between SUVmaxwashoutand clinicopathologic features
Features SUVRmaxwashout P value
Grade Low (N=11) 0.736 ± 0.201 0.314
High (N=10) 0.818 ± 0.179
IDH mutation Positive (N=10) 0.759 ± 0.192 0.705
Negative (N=11) 0.790 ± 0.194
Histology Astrocytoma (N=4) 0.763 ± 0.189 0.528
Oligodendroglioma (N=7) 0.721 ± 0.220 Glioblastoma (N=10) 0.818 ± 0.179
Location Frontal (N=12) 0.739 ± 0.175 0.422
Others (N=9) 0.823 ± 0.210
Laterality Left (N=11) 0.832 ± 0.190 0.132
Others (N=10) 0.713 ± 0.180
Enhancement quality
Definitive enhancement (N=12) 0.783 ± 0.183 0.917
Others (N=9) 0.766 ± 0.211
Proportion of enhancement
< 33% (N=18) 0.768 ± 0.188 0.699
≥ 33% (N=3) 0.817 ± 0.246
Proportion of non-enhancement
< 33% (N=18) 0.764 ± 0.186 0.600
≥ 33% (N=3) 0.843 ± 0.249
Proportion of necrosis
< 5% (N=13) 0.772 ± 0.210 0.860
≥ 5% (N=8) 0.781 ± 0.167
Proportion of edema
< 33% (N=9) 0.829 ± 0.187 0.247
≥ 33% (N=12) 0.735 ± 0.191
Features Spearman’s rho P value
Size 0.179 0.439
Table 5.Association between metabolic tumor volume (MTV) and clinicopathologic features
Features MTV (cm3) P value
Grade Low (N=11) 10.587 ± 15.396 0.001
High (N=10) 48.689 ± 33.346
IDH mutation Positive (N=10) 9.758 ± 15.968 0.001
Negative (N=11) 45.979 ± 32.887
Histology Astrocytoma (N=4) 9.298 ± 4.649 0.003
Oligodendroglioma (N=7) 17.847 ± 6.746 Glioblastoma (N=10) 33.346 ± 10.545
Location Frontal (N=12) 29.024 ± 36.086 0.808
Others (N=9) 28.340 ± 26.590
Laterality Left (N=11) 33.376 ± 39.667 0.809
Others (N=10) 23.622 ± 20.412
Enhancement quality
Definitive enhancement (N=12) 45.927 ± 31.764 <0.001
Others (N=9) 5.803 ± 8.696
Proportion of enhancement
< 33% (N=18) 22.486 ± 25.174 0.062
≥ 33% (N=3) 66.200 ± 46.343
Proportion of non-enhancement
< 33% (N=18) 33.212 ± 32.030 0.035
≥ 33% (N=3) 1.843 ± 2.417
Proportion of necrosis
< 5% (N=13) 13.894 ± 16.921 0.005
≥ 5% (N=8) 52.841 ± 35.926
Proportion of edema
< 33% (N=9) 37.500 ± 35.545 0.464
≥ 33% (N=12) 22.341 ± 23.988
Features Spearman’s rho P value
Size 0.563 0.008
Figure 1.Flow diagram showing inclusion and exclusion criteria of glioma and non-tumorous groups.
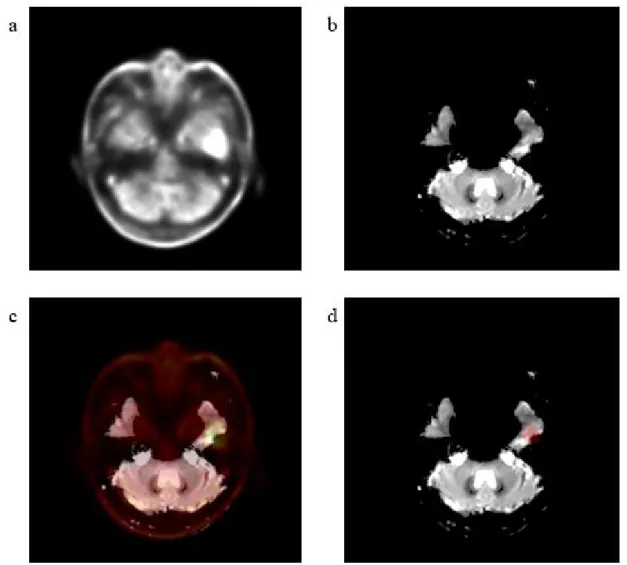
Figure 2. Representative images of quantitative analysis of MR parameters.a 18F-FDOPA PET image,b Baseline T2 MR image for parametric MR map,c Coregistered 18F-FDOPA PET image on baseline T2 MR,dVOI centered at the point of maximum 18F-FDOPA uptake
Figure 3. 18F-FDOPA uptake and washout according to pathologic features.aSUVRstriatumand SUVRwhite matterof low grade glioma and high grade glioma, bSUVRstriatumand SUVRwhite matterof IDHmutant and IDH wild-type, cSUVmaxwashoutof low grade glioma and high grade glioma dSUVmaxwashoutof IDH mutant and IDHwild-type, ethe correlation of SUVRWhite matterand SUVmaxwashout in high grade glioma and low grade glioma, respectively.
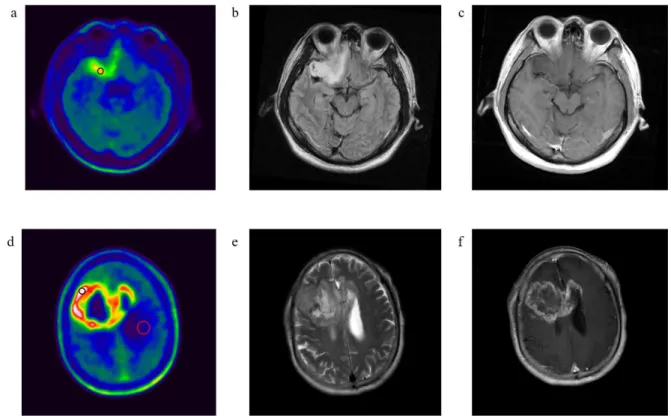
Figure 4. Representative cases showing VOIs on 18F-FDOPA PET and MR images of low grade
oligodendroglioma with IDHmutation (a, b, c) and glioblastoma withIDHwild-type (d, e, f). 18F- FDOPA PET (a) shows increased tumor uptake with target VOI (black circle) in right frontobasal cortex. MR FLAIR (b) and gadolinium enhanced T1 weighted (c) images show no enhancement, larger (≥ 33%) proportion of non-enhancement. 18F-FDOPA PET (d) shows increased tumor uptake with target VOI (black circle) in right frontal lobe and reference VOI in contralateral white matter (red circle). MR T2 weight (e)and gadolinium enhanced T1 weight (f)images show gadolinium enhancement with smaller (< 33%) proportion of non-enhancement.
Figure 5. Correlation between SUVRwhite matterand perfusion MR parameters (rCBV/rCBF, vascular
permeability).a-cCorrelation between SUVRWhite matter and MR parameters at the maximum
18F-FDOPA uptake site, d-fCorrelation between SUVRWhite matter and MR parameters at gadolinium enhanced portion, g-i Correlation between SUVRWhite matter and MR parameters at non-enhanced portion.
Figure 6. FDOPA uptake in non-tumorous lesions. (a) SUVstriatumand SUVwhite matterof non-tumorous lesions are significantly lower than those of gliomas, and (b) there are positive correlation between both SUVstriatumand SUVwhite matterof non-tumorous lesions and enhancement quality on Gd-enhancement MR images (b).
국문요약
목적 : 18F-FDOPA PET는 뇌종양의 임상적 평가에 유용하지만, 18F-FDOPA의 종양 흡수 정도는 다양한 것으로 알려져 있다. 본 연구에서는 두개 내 신경교종의 18F-FDOPA 흡수에 영향을 주는 임상적, 유전학적, 병리학적 및 MR영상 등의 소견을 후향적으로 평가하였다.
방법 : 2015년 7월부터 2018년 6월까지 뇌종양으로 처음 진단받고 18F-FDOPA 뇌 PET/CT 와 뇌 MR영상을 모두 촬영한 환자 중 병리학적으로 진단이 확인된 두개 내 신경교종 환자 21 명(남성/여성=13/8; 50세 중앙값; 21-72세)와 비종양성 병변으로 확인된 9 명의 환자(남성/여성=4/5; 49세 중앙값; 31-62세)를 후향적으로 분석하였다. 18F-FDOPA PET영상 주사 직후 30분간 (5분 / 6프레임) 촬영하였다. 여기에서 얻어진 10-30분의 합산 이미지에서 반대측 선조체 혹은 반대측 정상 백색질을 기준조직으로 하는 뇌
병변의 섭취비(SUVRstriatum 및 SUVRwhite matter)과 뇌 병변의 대사활성종양 부피를 구하였고, 2번째 및 6번째 프레임 영상 사이의 SUVRwhite matter 감소비를 계산하였다. 신경교종에서의
18F-FDOPA 섭취 지표들과 환자에서의 조직학, 악성도, IDH 돌연변이 및 통상적인 MR 소견(종양 크기, 위치, 크기, 가돌리늄 조영 정도, 가돌리늄 조영 부위 비율, 가돌리늄 조영 없는 부위 비율, 괴사 비율, 부종 비율), 및 관류 MR 지표(leakage-correlated rCBV/rCBF, 혈관 투과성) 사이의 상관 관계를 평가하였다.
결과 : 신경교종의 18F-FDOPA 섭취(SUVR)는 비종양성병변보다 통계적으로 유의하게 높았다(p=0.001). SUVRstriatum은 종양의 악성도, IDH 돌연변이, 조직학, MR영상에서 괴사의 비율과 관련이 있었다 (p<0.05). SUVRwhite matter은 여러 지표 중 MR영상에서 비조영증강 비율만 관련이 있었다(p=0.005). 신경교종에서 SUVRwhite matter 섭취 감소비와 관련된 임상-병리학적 소견은 없었다 (p>0.05). 비종양성 병변에서 조영증강정도와 SUVRstriatum(Spearman's rho=0.881, p=0.002) 또는 SUVRwhite matter(Spearman 's rho = 0.991)가 유의한 양의 상관관계가 있었지만, 신경교종에서는 조영증강정도 및 관류 MR 파라미터 사이에는 유의한 상관 관계가 없었다(p> 0.05).
결론 : 신경교종의 18F-FDOPA 섭취는 종양 특이적이었고 뇌혈뇌장벽의 파괴의 영향은 작았으며, IDH 돌연변이 및 조직학 진단과 관련이 있었다. 신경교종에서 이러한
임상병리학적 소견과 18F-FDOPA 섭취의 관련기전을 이해하기 위해서는 더 많은 증례 및
LAT1과 같은 분자생물학적 지표를 이용한 추가 연구가 필요하다.