저작자표시-비영리-변경금지 2.0 대한민국 이용자는 아래의 조건을 따르는 경우에 한하여 자유롭게
l 이 저작물을 복제, 배포, 전송, 전시, 공연 및 방송할 수 있습니다. 다음과 같은 조건을 따라야 합니다:
l 귀하는, 이 저작물의 재이용이나 배포의 경우, 이 저작물에 적용된 이용허락조건 을 명확하게 나타내어야 합니다.
l 저작권자로부터 별도의 허가를 받으면 이러한 조건들은 적용되지 않습니다.
저작권법에 따른 이용자의 권리는 위의 내용에 의하여 영향을 받지 않습니다. 이것은 이용허락규약(Legal Code)을 이해하기 쉽게 요약한 것입니다.
Disclaimer
저작자표시. 귀하는 원저작자를 표시하여야 합니다.
비영리. 귀하는 이 저작물을 영리 목적으로 이용할 수 없습니다.
변경금지. 귀하는 이 저작물을 개작, 변형 또는 가공할 수 없습니다.
Host materials for Mg 2+ intercalation
Dong-Min Kim
Department of Energy Engineering (Battery Science and Technology)
Graduate School of UNIST
Host materials for Mg 2+ intercalation
A thesis
submitted to the Graduate School of UNIST in partial fulfillment of the
requirements for the degree of Master of Science
Dong-Min Kim
1. 31. 2016 Approved by
Advisor
Nam-soon Choi
Host materials for Mg 2+ intercalation
Dong-Min Kim
This certifies that the thesis of Dong-Min Kim is approved.
1. 31. 2016
Signature
Advisor: Prof. Nam-Soon Choi
Signature
Prof. Kyu Tae Lee: Thesis Committee Member #1 Signature
Prof. Sung You Hong: Thesis Committee Member #2
Abstract
As time goes by, need for energy storage system is increasing. Especially, with the development of electric vehicles and smart grid system, interest for energy storage system with high energy density and safety is getting increased. Until now, lithium ion batteries (LIBs) have been in charge of that energy storage system. However, LIBs have limitations in the view of high price and safety issues to be used as large scale energy storage system. So, needs for next generation battery systems are getting larger.
Magnesium based battery systems are promising candidates to alternate lithium based systems. They provide lower price and better safety than lithium based system. However, they also have limitations.
First, only a few high voltage cathodes have been introduced. Second, magnesium metal cannot be used with conventional polar aprotic solvent. So, in this study, I will introduce cathode material which can store Mg2+ ions and operates in high voltage region. In addition, I will introduce magnesium insertion anode which is expected to be used with conventional solvents.
Na0.69Fe2(CN)6 and Fe2(CN)6 were tested as cathode material for magnesium based system.
Na0.69Fe2(CN)6 showed reversible cycling with the capacity about 70 mA h g-1. However, Fe2(CN)6 did not show electrochemical activity with magnesium. Na0.69Fe2(CN)6 showed small and reversible structural change and stable cycle performance over 30 cycles. By comparing Na0.69Fe2(CN)6 and Fe2(CN)6, it seems that the existence of Na+ helps reversible intercalation/de-intercalation of magnesium.
Natural graphite was tested as magnesium insertion anode. It showed reversible and stable cycling when cycled with the capacity of 180 mA h g-1. According to insertion/de-insertion of magnesium, it showed reversible structural change. The existence of magnesium in the natural graphite was observed with TEM.
In this report, magnesium intercalation phenomena into Na0.69Fe2(CN)6 and natural graphite were reported. They showed possibility as cathode and anode for magnesium based energy storage system.
Because these are first reports for magnesium based system, they are expected to introduce new way for magnesium system research.
Contents
1. Introduction---1
1.1 Lithium ion batteries ---1
1.2 Magnesium based batteries ---5
1.3 Cathode materials for Mg2+ ion storage ---7
1.4 Anode materials for Mg2+ ion storage---8
2. Na0.69Fe2(CN)6 as cathode material ---9
2.1 Experimental ---9
2.1.1. Synthesis ---9
2.1.2 Material characterization ---9
2.1.3 Electrode preparation ---10
2.1.4 Cell configuration ---10
2.1.5 Electrochemical test ---10
2.2 Results and discussion ---11
2.2.1 Preparation of materials ---11
2.2.2 Electrochemical properties ---17
2.2.3 Structural and oxidation state analysis ---21
2.2.4 Reversible Mg2+ intercalation ---28
3. Mg2+ co-intercalation into Natural graphite ---30
3.1 Experimental ---30
3.1.1 Material characterization ---30
3.1.2 Electrode preparation ---30
3.1.3 Cell configuration ---30
3.1.4 Electrochemical test ---30
3.2 Results and discussion ---31
3.2.1 Electrochemical properties ---31
3.2.2 Magnesium anode analysis ---31
3.2.3 Structural analysis ---34
3.3.4 Co-intercalation of magnesium with solvent ---39
4. Conclusion ---41
Reference ---42
List of Figures
Figure 1 Schematic structure of lithium ion battery Figure 2 Lithium source reserves in the world Figure 3 Lithium battery market development Figure 4 Dendrite formation on lithium surface Figure 5 SEM images of electrodeposited magnesium
Figure 6 XRD patterns of Fe2(CN)6 (FCN) and Na0.69Fe2(CN)6 (NFCN) Figure 7 Schematic diagram of NaxFe2(CN)6 cubic structure
Figure 8 SEM images of (a), (b) Fe2(CN)6 (FCN) and (c), (d) Na0.69Fe2(CN)6 (NFCN) Figure 9 Cyclic voltammetry of activated carbon (AC) electrode for OCV calibration
Figure 10 Anodic and cathodic linear sweep voltammetry of 0.3 M Mg(TFSI)2/AN electrolyte Figure 11 Voltage profile of FCN
Figure 12 Voltage profile of NFCN starting with (a) discharge and (b) charge Figure 13 Cycle performance of NFCN starting with (a) discharge (b) charge Figure 14 Ex-situ XRD (a) spots and (b) patterns pattern of FCN ranging 15 - 20 ° Figure 15 Ex-situ XRD patterns of FCN ranging 10 - 60 °
Figure 16 Ex-situ XRD (a) spots and (b) patterns of NFCN ranging 15 - 20 ° Figure 17 Ex-situ XRD pattern of NFCN ranging 10 - 60 °
Figure 18 Lattice parameter variation
Figure 19 X-ray absorption near edge structure (XANES) variation of NFCN according to discharge and charge
Figure 20 EDS mapping of NFCN after (a) discharge and (b) following charge by TEM Figure 21 Constant capacity cycling with 180 mA h g-1
Figure 22 SEM images of (a) pristine (b) cycled magnesium anode surface
Figure 23 Ex-situ XRD (a) spots and (b) patterns of natural graphite ranging 20 - 30 ° Figure 24 Ex-situ XRD patterns of natural graphite ranging 10 - 40 °
Figure 25 TEM images of (a) pristine (b), (c) Mg intercalated natural graphite Figure 26 EDS mapping of natural graphite after magnesium intercalation by TEM
Figure 24 FT-IR analysis of electrolyte and natural graphite at pristine and discharged state
1
1. Introduction
1.1 Lithium ion batteries
As human life becomes more convenient with portable devices, importance of electrical power sources for them is increasing. In addition, with the development of electric vehicles and smart grid system, interest for energy storage system with high energy density and safety is also getting increased.
Until now, lithium ion batteries (LIBs) have been in charge of these energy storage systems.1
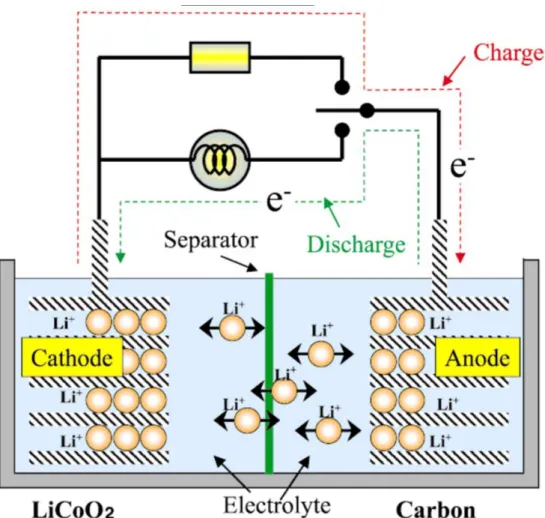
Batteries are systems that store energy with electrochemical reactions between two chemicals. They mainly consist of cathode, anode, separator and electrolyte (Figure 1). Cathodes and anodes store cations which act as charge carriers moving between them. Separators divide cathode and anode physically to prevent direct chemical reaction due to thermodynamic energy difference between them.
Electrolytes transfer cations between cathodes and anodes. The energy is charged and discharged based on oxidation and reduction of cathode and anode materials. Electrons generated form redox reaction pass through outer circuit, which is expressed as electric energy.2 Lithium ion batteries are the systems that use lithium ions as charger carriers. Lithium ion has low redox potential (3.05 V vs.
NHE), small ion size (0.69 Å) and light weight (6.941 amu).1b With these characteristics, lithium ion batteries can provide high capacity and energy density.
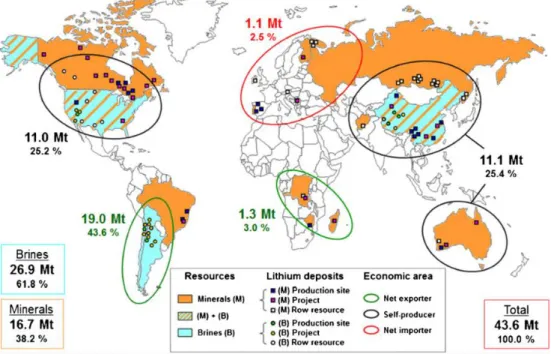
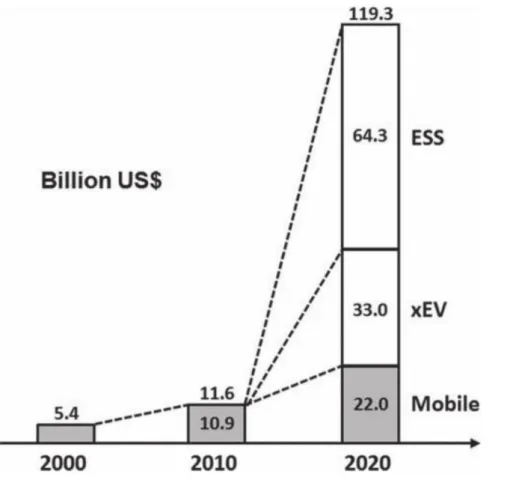
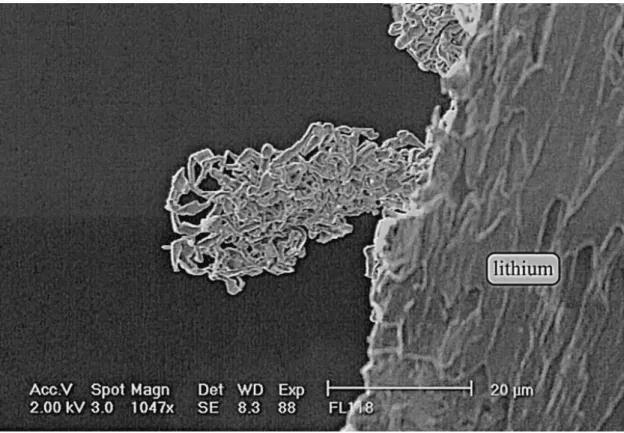
However, lithium ion batteries have limitations to be used as large scale energy storage system. First, lithium source reserves are located in only several countries (Figure 2).3 Unfortunately, these reserves are concentrated in South America, so the supply of lithium source is unstable. In addition, lithium battery market has been enlarged so far and the speed of market development is still rapidly rising (Figure 3).4 This rapid market growth leads lithium source demand increase. This results in lack of supply than demand, and the price of lithium source increases accordingly. For last 10 years, lithium carbonate price increased almost 3 times higher than before. Second, high reactivity of lithium leads safety issues such as explosion. When lithium ion battery is damaged with unexpected stress, it vigorously reacts leading unwanted reaction and explosion. Especially, when lithium deposition occurs, it forms dendrite on the surface (Figure 4). These dendrites trigger serious safety problems.
When the dendrite grows and reaches the cathode, it makes internal short circuit which leads explosion of the batteries.5 With these drawbacks, need for nest generation batteries is increasing.
2
Figure 5 Schematic structure of lithium ion battery6
3
Figure 6 Lithium source reserves in the world3b
Figure 7 Lithium battery market development4
4
Figure 8 Dendrite formation on lithium surface5
5
1.2 magnesium based batteries
Magnesium based battery systems are one of the promising candidates for replacing lithium ion batteries in terms of several advantages.7 First and basically, magnesium has higher charge (+2) than lithium (+1). When magnesium ions are used as charge carriers, they can deliver two times larger charge than lithium per one ion. Second, magnesium (3833 mA h cm-3) has higher volumetric capacity than lithium (2046 mA h cm-3). With higher volumetric capacity, magnesium can provide same sources with smaller amount than lithium. Third, magnesium is fifth abundant element in the crust. With its abundance, magnesium source is much cheaper than lithium source. Finally, there were no reports for magnesium about dendrite formation.8 As mentioned before, in the case of lithium, dendrites are formed on the surface of anode. It leads unwanted reaction and even explosion of the batteries.
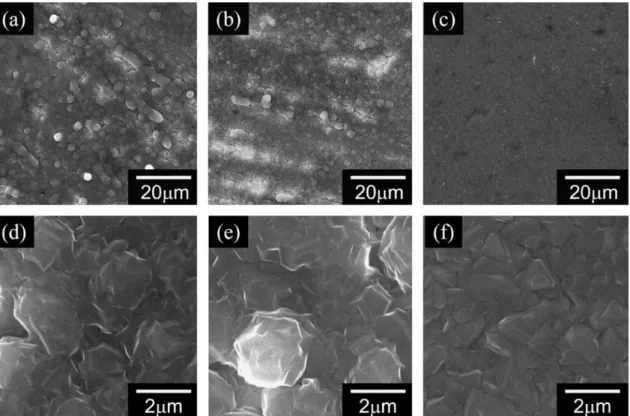
However, so far, magnesium in known not to form dendrite on the surface of the anode (Figure 5).
Inexpensive price from high volumetric density and abundance, safety from non-dendritic reaction make magnesium based system attractive as an alternative for lithium ion battery system.
However, there are several limitations for magnesium based system. First, there have been only a few high voltage cathodes. Because there were no electrolytes that can be operated in high voltage region, development of cathode materials were also limited in low voltage area near 2 V (vs.
Mg/Mg2+).9 Recently, with the development of high voltage electrolyte that can be used near 3 V (vs.
Mg/Mg2+), need for high voltage cathode materials is getting larger.10 Second, magnesium metal cannot be used with conventional polar aprotic solvents.11 When metals or electrodes meet electrolytes, Solid Electrolyte Interface (SEI) layers are formed on the surface. Lithium ions can pass through this SEI layers to react with electrode materials. On the other hand, when SEI layers are formed, magnesium ions cannot pass through SEI layers leading failure of reaction with electrode materials.
So, researches about anode materials are required.
6
Figure 5 SEM images of electrodeposited magnesium8
(a) 500×, 0.5 mA cm−2, (b) 500×, 1.0 mA cm−2, (c) 500×, 2.0 mA cm−2, (d) 5000×, 0.5 mA cm−2, (e) 5000×, 1.0 mA cm−2 (f) 5000×, 2.0 mA cm−2.
7
1.3 Cathode materials that can store magnesium ionsThe first observation of magnesium stripping was reported in 1920s.12 After this report, electrochemical magnesium deposition was reported.13 These studies used ether based Grignard solution. However, this system cannot used in actual battery system due to low stability and ionic conductivity of Grignard solutions. In 2000, Aurbach et al. reported first reversible magnesium battery system. Cheveral phase Mo6S8, magnesium metal and 0.25 M Mg(AlCl2BuEt)2 solution in THF were used as cathode, anode and electrolyte respectively.9a This report showed a new possibility of cheveral phase materials as magnesium battery cathode materials. Other kinds of cheveral materials such as Mo6T8 (T = S, Se) were reported as cathode materials.9d, 9e Cheveral phase cathodes delivered about 100 mA h g-1 with stable cycle performance. Transition metal oxide materials were also reported as cathode materials. MoO3, and MnO2 were introduced as cathode materials.14 They showed larger specific capacity than chevaral phase materials but they showed poor cycle performance stability.
These cathode materials were operated in low voltage region (< 2 V vs. Mg/Mg2+) because of lack of high voltage electrolytes.
However, in these days, electrolytes that can be operated in high voltage were developed. With these electrolyte, a few high voltage cathode materials were introduced. V2O5 thin film, MgFeSio4, synthesized by lithium de-insertion from Li2FeSiO4, vanadium phosphate and amorphous V2O5-P2O5
with the various ratio were introduces as high voltage cathode materials operating in 1.5 ~ 3.8 V (vs.
Mg/Mg2+).15
Here, I introduce one of the Prussian blue analogues, Na0.69Fe2(CN)6,as a magnesium storing cathode materials. Prussian blue analogues have been reported as cathode materials for lithium and sodium ion batteries.16 Most of them can be easily synthesized by simple precipitation method, which implies easier application to large scale production. In addition, due to cubic structure and large channel size, they have high possibilities as cathode materials.
8
1.4 anode materials that can store magnesium ionsBecause magnesium metal cannot be used with conventional polar aprotic electrolytes, studies about anodes that could store magnesium ions have been introduced. Non-metal magnesium anodes can be used with conventional polar aprotic solvents. Arthur et al. reported bismuth and antimony and their alloys as conversion type anodes.17 The insertion of magnesium was conducted under 0.4 V (vs.
Mg/Mg2+) and showed reversible cycling. Bi0.88Sb0.45 alloys showed best results in terms of capacity with 298 mA h g-1. The reversible insertion of magnesium into Sn was reported by Singh et al.18 It showed the capacity of 903 mA h g-1 low working potential (0.15 V vs. Mg/Mg2+). Although these materials showed possibilities to be used with polar aprotic solvents, their volume expansion was too large, which leads rapid capacity fading. So, non-conversion type anodes are required for lower volume expansion.
Natural graphite is commercialized anode material in lithium battery, which means it is easy to apply to other systems. However, storing of other cations in natural graphite is not available. It shows poor capability when used with sodium. Recently, co-intercalation of sodium with ether solvents were reported.19 It showed reversible cycle performance with high capacity. By applying proper solvents, natural graphite can store other cations.
9
2. Na
0.69Fe
2(CN)
6as cathode material
2.1. Experimental
2.1.1 Synthesis
Fe2(CN)6 (FCN) was synthesized by simple precipitation method. 2 M FeCl3 solution was added to 1 M K3Fe(CN)6 solution with the molar ratio of FeCl3 : K3Fe(CN)6 = 2 : 1 by dropwise addition. All solution was prepared with D.I water solvent. The addition was conducted while the solution was stirred.
The precipitate was filtered and washed by D.I water and dried at 80 °C under vacuum.
Na0.69Fe2(CN)6 (NFCN) was prepared with same precipitation method. 0.08 M Fe(NO3)3∙9(H2O) was added to 0.04 M Na4Fe(CN)6 solution. CH3COONa was added to solution with the molar ratio of Na4Fe(CN)6 : CH3COONa = 1 : 30. CH3COONa was added to control acidity of solution for managing Na content. The reaction was conducted with the molar ratio of Fe(NO3)3∙9(H2O) : Na4Fe(CN)6 = 2 : 1.
All solution was prepared with D.I water solvent. The addition was conducted while the solution was stirred. The precipitate was filtered and washed by D.I water and dried at 120 °C under vacuum.
2.1.2 Material characterization
Scanning electron microscopy (SEM) images were taken by Hitachi S-4800 field-emission scanning electron microscope (FE-SEM). X-Ray diffraction (XRD) patterns of powders and electrodes were gained with a Rigaku D/MAX2500V/PC powder diffractometer using Cu-Kα radiation (λ = 1.5405 Å) operated in the 2θ range of 10−80°. High-resolution TEM and EDS analysis were conducted using a scanning transmission electron microscope (HR-TEM, STEM, JEOL JEM-2100F). An ion milling (Ion slicer, JEOL EM-09100 IS) was conducted to prepare the specimens for transmission electron microscopy (TEM) analysis. The specimens were prepared by an epoxy embedding, followed by mechanical milling and ion milling. Fe K-edge X-ray absorption near edge structure (XANES) analysis was conducted on the 6D beamline at the Pohang Accelerator Laboratory (PAL). The Na content in sample was examined by inductively coupled plasma optical emission spectroscopy (ICP-OES) analysis.
10
2.1.3 Electrode preparation
Working electrode was prepared with active material, conducting carbon and binder. Super P and PVdF(polyvinylidene fluoride) were used as conduction carbon and binder. The binder was dispersed in NMP for even dispersion and easier mixing. The electrode was composed with the ratio of active material : conducting carbon : binder = 75 : 15 : 15. Active material and conducting carbon was firstly mixed with mortar and the mixed with binder solution. Then, the mixture was blended with mixing machine (Thinky ARE-250, Interelectronics Co.) with extra addition of NMP for appropriate viscosity.
The mixed slurry was casted on Al current collector and dried at 80 °C. The electrode was dried at 120 °C right before the cell assembly.
Counter electrode was prepared with activated carbon (MSP-20), conducting carbon (Super P), and binder (PTFE : polytetrafluoroethylene). PTFE was dispersed in D.I water. All compounds was mixed in mortar with the ratio of 80 : 10: 10. Mixed compounds were pressed to sheet form with 750 ~800 mm thickness. The sheet was dried at 120 °C and re-dried right before cell assembly at same temperature.
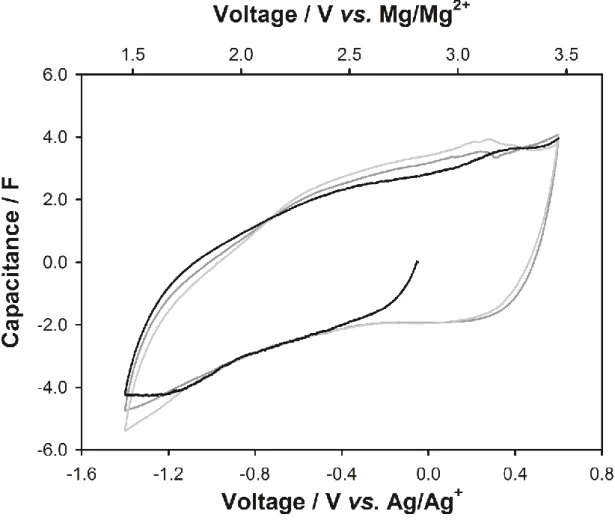
The open circuit voltage of activated carbon is measured with Ag/Ag+ reference electrode for several times. It was measured as - 0.05 V (vs. Ag/Ag+), which is calibrated to 2.864 V (vs. Mg/Mg2+)
2.1.4 Cell configuration
The electrochemical test was conducted by 2032 coin cell. Active material casted on Al foil was used as working electrode. Activated carbon (AC) was used as counter and reference electrode. The reference voltage was calibrated with Ag/Ag+ reference electrode. 0.3 M Mg(TFSI)2 in acetonitrile was used as electrolyte.
2.1.5 Electrochemical test
Galvanostatic tests were conducted in - 0.8 ~ 0.8 V (vs. AC) region with current density of 3.65 mA g-1. The tests were processed using WBCS 3000 (WonATech, Korea) at 30 °C.
11
2.2 Results and discussion2.2.1 Preparation of materials
Two Prussian blue analogues, FCN and NFCN, were synthesized by a simple precipitation method.
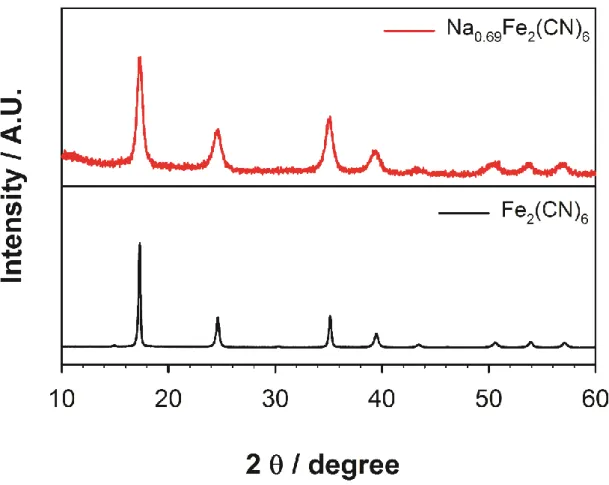
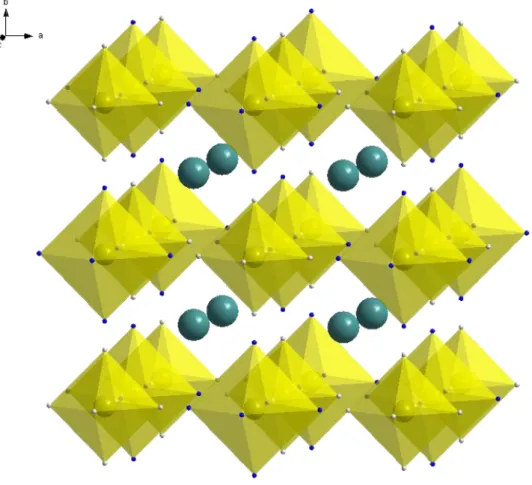
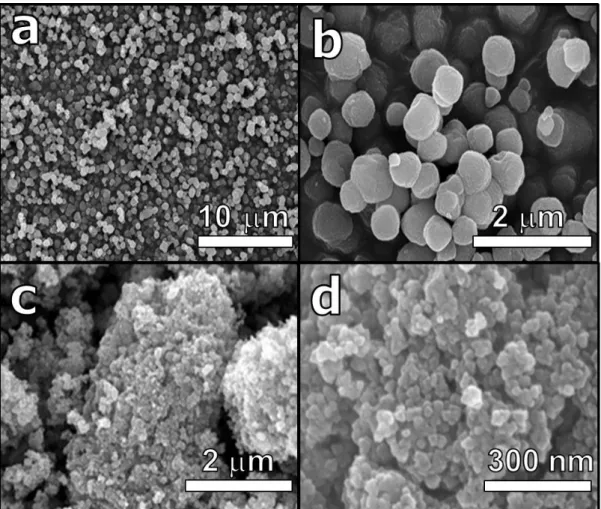
There were no impurity peaks in the XRD patterns (Figure 6) and they showed that the as-prepared samples both have typical cubic structure (space group Fm-3m) of Prussian blue analogues. Figure 7 shows the typical structure NaxFe2(CN)6 is schematically. SEM images of Figure 8 shows that FCN and NFCN have hundreds of nm and tens of nm particle size respectively. Although they have same structure except existence of Na, it is quite astonishing that they showed different electrochemical properties.
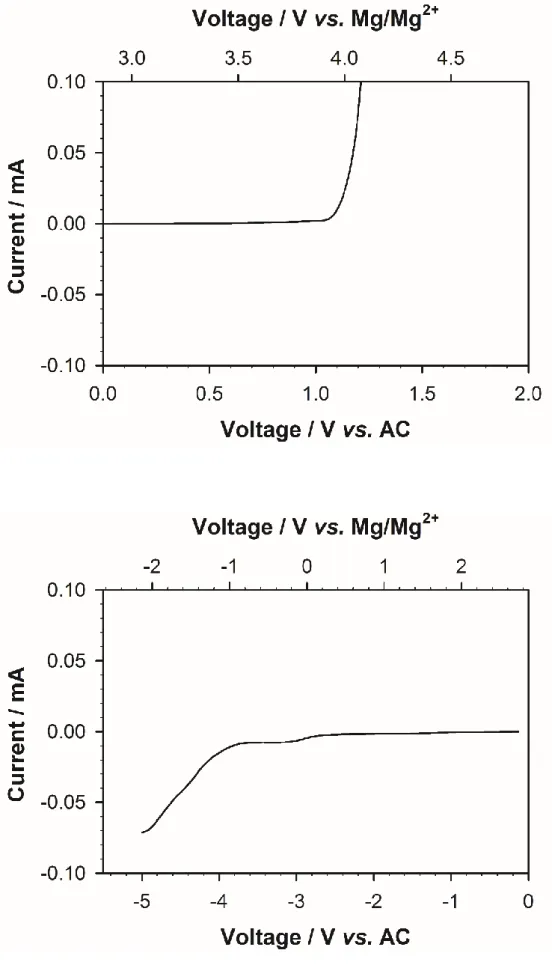
Solution consisted of 0.3 M Mg(TFSI)2 and acetonitrile was used as electrolyte to examine cathode in high voltage area. However, acetonitrile based electrolyte cannot be used Mg metal because there was no report for Mg deposition in this electrolyte. So, the electrochemical properties of FCN and NFCN were examined with activated carbon (AC) quasi-reference electrodes. The potential of AC electrode was calibrated by Ag/Ag+ reference electrode (Figure 9). In addition, the amount of AC is 20 times higher than active materials, so the voltage of AC is expected not to vary significantly. The stability of electrolyte was examined by linear sweep voltammetry (Figure 10). It showed stable performance in - 2.8 V ~ 1.0 V (vs. AC).
12
Figure 6 XRD patterns of Fe2(CN)6 (FCN) and Na0.69Fe2(CN)6 (NFCN)
13
Figure 7 Schematic diagram of NaxFe2(CN)6 cubic structure
14
Figure 8 SEM images of (a), (b) Fe2(CN)6 (FCN) and (c), (d) Na0.69Fe2(CN)6 (NFCN)
15
Figure 9 Cyclic voltammetry of activated carbon (AC) electrode for OCV calibration
16
Figure 10 Anodic and cathodic linear sweep voltammetry of 0.3 M Mg(TFSI)2/AN electrolyte
17
2.2.2 Electrochemical propertiesAs shown in Figure 11, 12, electrochemical properties were examined for both FCN and NFCN. FCN showed no electrochemical activity with Mg2+ ions (Figure 11). However, NFCN showed stable cycling with the capacity about 70 mA h g-1. It delivered about 45 mA h g-1 in the first discharge, which corresponds to 0.24 mole of Mg 2+ ions per 1 mole of NFCN. However, charge capacity of NFCN in the following charge cycle. This indicates that larger amount of cations were de-inserted form NFCN during charge than inserted Mg2+ cations during discharge. It means that not only inserted Mg2+ ions but also existing Na+ ions in bare NFCN acted as charge carriers. To confirm that existing Na+ ions can act as charge carriers, electrochemical properties of NFCN was tested starting with charging process. NFCN delivered about 40 mA h g-1 in the first charge cycle (Figure 12b). In addition, it delivered about 90 mA h g-1 in the following discharge cycle. It means that both existing Na+ ions in NFCN and inserted Mg2+ ions from electrolyte acted as charge carriers. Furthermore, regardless of starting with discharge or charge, NFCN delivered about 70 mA h g-1 after second cycle. NFCN showed stable cycle performance without critical capacity fading over 35 cycles for both initial step condition (Figure 13).
So, further analyses were conducted only for starting with discharge.
18
Figure 11 Voltage profile of FCN
19
Figure 12 Voltage profile of NFCN starting with (a) discharge and (b) charge
20
Figure 13 Cycle performance of NFCN starting with (a) discharge (b) charge
21
2.2.3 Structural and oxidation state analysisStructural change of FCN and NFCN with Mg2+ ions was examined by ex situ XRD analysis as shown in Figure 14 - 17. In accordance with electrochemical analysis, FCN does not show notable structural change with discharge and following charge process (Figure 14b, 15). On the other hand, in the case of NFCN, XRD peak reversible shifted with discharge and charge process. After Mg2+ ions were firstly intercalated into NFCN (discharge), XRD peak at 17-18 ° shifted to lower angle which means that the lattice of NFCN enlarged. Then, it moved higher angle with following de-intercalation of charge carriers (charge). Because not only inserted Mg2+ ions but also existing Na+ ions were de-inserted, XRD peak shifted to higher angle than pristine NFCN state. This means that the lattice of NFCN reduced. This reversible peak shift was also observed at further cycled state and Na+ de- intercalation as first cycle (vi of Figure 16b).
As shown in Figure 18, more detailed lattice parameter was compared with Rietveld refinement.
According to intercalation and de- intercalation of charge carriers, lattice parameter of NFCN reversibly changed. Lattice parameter was enlarged with discharge and decreased with charge process. The amount of difference is about 0.1Å, which leads about 3 % volume expansion than pristine volume.
Interestingly, lattice parameter expansion is smaller in charge process. This comes from structural change form cubic to rhombohedral structure in alkali-rich phase in Na0.69+Fe2(CN)6 (0.31 < ). When the amount cations in NFCN increases, the structure of NFCN starts to be distorted and changes to rhombohedral structure. So, lattice parameter variance is larger in discharge process than charge process due to phase transition to rhombohedral structure.
Reversible Mg2+ intercalation is also supported by ex situ XANES analysis. As shown in Figure 19, XANES peak shifted to lower energy than pristine state after discharge. This means that Fe in NFCN is reduced than pristine state. Then the peak shifted to high energy in following charge, which means that Fe got oxidized after charge process. In addition, Fe got more oxidized than pristine state in charged state. This results from Na+ de- intercalation in charge process in accordance with ex situ XRD analysis.
22
Figure 14 Ex-situ XRD (a) spots and (b) patterns pattern of FCN ranging 15 - 20 °
23
Figure 15 Ex-situ XRD patterns of FCN ranging 10 - 60 ° (Ordering is the same with Figure 13)
24
Figure 16 Ex-situ XRD (a) spots and (b) patterns of NFCN ranging 15 - 20 °
25
Figure 17 Ex-situ XRD pattern of NFCN ranging 10 - 60 ° (Ordering is the same with figure 14)
26
Figure 18 Lattice parameter variation (Ordering is the same with figure 14)
27
Figure 19 X-ray absorption near edge structure (XANES) variation of NFCN according to discharge and charge
28
2.2.4 Reversible Mg2+ intercalationReversible intercalation and de-intercalstion of Mg2+ ions were investigated by ex situ TEM analysis.
Figure 20 shows cross-sectional TEM images and EDS mapping of discharged and following charged state. After Mg2+ ions were intercalated into NFCN, Mg was detected clearly in NFCN particle by EDS mapping. The Mg/Fe mole ratio was calculated to 0.24, which matches discharge capacity at first cycle leading Mg0.24Na0.69Fe2(CN)6. After following charge, ca. 0.15 mol of Mg was detected after following charge. This indicates that 0.09 mol of Mg were reversibly de-intercalated from Mg0.24Na0.69Fe2(CN)6
and existing Na+ ions were de-intercalated with Mg2+ ions. This phenomena comes from faster diffusion kinetics of Na+ ions than that of Mg2+ ions. Due to bivalency, Mg - (CN)– bonding can have stronger coulombic attraction than Na - (CN)– bonding. So, Na+ ion de-intercalation could be easier than that of Mg2+ ions.
29
Figure 20 EDS mapping of NFCN after (a) discharge and (b) following charge by TEM
30
3. Mg
2+co-intercalation into Natural graphite
3.1 Experimental
3.1.1 Material characterization
X-Ray diffraction (XRD) patterns were obtained with a Rigaku D/MAX2500V/PC powder diffractometer using Cu-Kα radiation (λ = 1.5405 Å) operated in the 2θ range of 10−60°. High- resolution TEM and EDS analysis were conducted using a scanning transmission electron microscope (HR-TEM, STEM, JEOL JEM-2100F).
3.1.2 Electrode preparation
Working electrode was prepared with active material and binder. PVdF (polyvinylidene fluoride) was used as binder. The binder was dispersed in NMP for even dispersion and easier mixing. The electrode was composed with the ratio of active material : binder = 80 : 20. Active material and binder were blended with mixing machine (Thinky ARE-250, Interelectronics Co.) with extra addition of NMP for appropriate viscosity. The mixed slurry was casted on Al current collector and dried at 80 °C. As prepared electrode was dried at 120 °C again right before the cell assembly.
Mg metal disk was used as counter electrode. Mg disks were polished with sand paper thoroughly to remove native oxide on the surface. Then it was washed with THF to remove polished dust.
3.1.3 Cell configuration
The electrochemical test was conducted by 2032 coin cell. Active material casted on Al foil was used as working electrode. Mg disk was used as counter and reference electrode. 0.3 M Mg(TFSI)2 in DME/DEGDME (5:5 v:v) solution was used as electrolyte.
3.1.4 Electrochemical test
Galvanostatic tests were conducted with constant capacity of 180mA h g-1 with current density of 2.0 mA g-1.The tests were processed using WBCS 3000 (WonATech, Korea) at 30 °C.
31
3.2 Result and discussion3.2.1 Electrochemical properties
As shown in Figure 21, natural graphite showed reversible cycling with constant capacity of 180 mA h g-1 with current density of 2 mA g-1. The intercalation of magnesium was conducted around 0 V and following de- intercalation. Because the intercalation occurs near 0 V and below, deposition of magnesium can occur simultaneously. So, the electrochemical tests were conducted with constant capacity to avoid deposition reaction. After first cycle, the intercalation was conducted same voltage region, but de- intercalation voltage region was decreased. This is because unwanted side reactions were includes in first charge cycle. The cycle showed stable performance over 15cycles.
3.2.2 Magnesium anode analysis
To confirm that magnesium actually participated in electrochemical reaction, the surface of cycled magnesium anode was investigated with SEM. As shown SEM images in Figure 22, the surface of magnesium anode after several cycles is different from pristine magnesium anode. There were hundreds of micrometer sized pores and deposits on the surface. It indicates that magnesium actually participated in electrochemical reaction and stripping and deposition of magnesium occurs at magnesium anode.
32
Figure 21 Constant capacity cycling with 180 mA h g-1
33
Figure 22 SEM images of (a) pristine (b) cycled magnesium anode surface
34
3.2.3 Structural analysisTo investigate structural change according to magnesium co-intercalation into natural graphite, ex situ XRD was conducted as shown in Figure 23. The (002) peak of natural graphite gradually decrease as intercalation proceeds. Then, it splits into two peaks. After the intercalation was performed with 180 mA h g-1, (002) peak almost disappeared. In the process of de-intercalation, split peaks disappeared and (002) peak appeared again. However, it did not fully recovered compared with pristine natural graphite.
This results from constant capacity test. Because unwanted side reactions were included in the capacity, intercalated ions were not fully de-intercalated form the structure. When de-intercalation was performed with larger capacity than intercalation, (002) peak was more recovered than same capacity de- intercalation. So, magnesium can reversibly co-intercalated with natural graphite.
To investigate detailed structural change, natural graphite was examined with TEM analysis after magnesium intercalation. As shown TEM images of Figure 25, graphite layers were well-stacked in the case of pristine electrode. However, after Mg co-intercalation, there were some regions that natural graphite layers seems to be collapsed. Both layered and non-layered were observed. By EDS mapping, magnesium was mainly detected in the non-layer region as shown in Figure 26. When magnesium is co-intercalated into natural graphite, its layered crystallinity decreases.
35
Figure 23 Ex-situ XRD (a) spots and (b) patterns of natural graphite ranging 20 - 30 °
36
Figure 24 Ex-situ XRD patterns of natural graphite ranging 10 – 40 ° (ordering is the same with figure 22)
37
Figure 25 TEM images of (a) pristine (b), (c) Mg intercalated natural graphite
38
Figure 26 EDS mapping of natural graphite after magnesium intercalation(c of Figure 25) by TEM
39
3.3.3 Co-intercalation of magnesium with solventThe co-intercalation of magnesium into natural graphite is supported by ex situ Fourier transform infrared (FT-IR) analysis. After magnesium intercalation process, cell was disassembled and cycled electrode was washed with THF to remove residual salt and electrolyte on the electrode surface.
Compard with pristine electrode, vibrations of bondings that is related with electrolyte was observed in the case of cycled electode. It indicates that solvated magnesium ions were co-intercalated with solvents into natural graphite during discharge process. Ether bases electrolytes could solvate magnesium ion in non-polar like form, which makes it easier easier to intercalate in natural graphite that has hydrocpopic characteristic.19
40
Figure 24 FT-IR analysis of electrolyte and natural graphite at pristine and discharged state
41
4. Conclusion
In this research, magnesium ion intercalation materials were introduced for electrode materials for magnesium based battery system. One of the Prussian blue analogues, Na0.69Fe2(CN)6 is introduced as cathode materials that can store magnesium ions. It showed approximately 70 mA h g-1 of capacity with stable cycle performance over 35 cycles in 2.0 ~ 3.6 V (vs. Mg/Mg2+, calibrated). The reversible structural change was observed with ex situ XRD during intercalation and de-intercalation of magnesium. Due to the phase transition of alkali-rich state of Na0.69+ Fe2(CN)6 (0.31 < ), it showed larger structural change during discharge. However, the maximum volume expansion was only 103 % than pristine state. This negligible volume expansion leads stable cycle performance. The reversible intercalation and de-intercalation were observed with TEM and EDS mapping. 0.24 mol of magnesium was detected after discharge, which matches with first discharge capacity, and 0.15 mol of magnesium was detected after following charge. This indicates that 0.09 mol of magnesium was reversibly de- intercalated with existing sodium in Na0.69Fe2(CN)6. The possibility of sodium de-intercalation can be confirmed with electrochemical test of Na0.69Fe2(CN)6 starting with charge. Because of bivalency of magnesium ions, coulombic attraction between Mg-(CN) bonding is larger than Na-(CN) bonding. This affects de-intercalation kinetics of magnesium leading more de-intercalation of sodium than magnesium.
By comparing Fe2(CN)6 and Na0.69Fe2(CN)6, it seems that existence of sodium make magnesium ions easier to be intercalated into Prussian blue analogues.
The co-intercalation of magnesium with ether solvent into natural graphite was introduced. It showed reversible cycling with constant capacity of 180 mA h g-1. The reversible structural change was observed by ex situ XRD during intercalation and de-intercalation. (002) peak of natural graphite was disappeared with intercalation and recovered with following de-intercalation. Detailed structural change was investigated with TEM and EDS mapping. There were spots that (002) layers of natural graphite are collapsed and magnesium ions were mainly detected in that region. To confirm participant of magnesium in the reaction, SEM analysis of magnesium metal surface was performed. There were hundreds of micrometer sized pores and deposits on the surface of magnesium. It indicates that the magnesium actually participated in reaction. To confirm co-intercalation of solvents into natural graphite, ex situ FT-IR was conducted with magnesium intercalated electrode. It showed there were peaks of electrolytes in the electrode which means co-intercalation of solvents into natural graphite.
Na0.69Fe2(CN)6 and natural graphite were introduced as magnesium ion intercalstion electrode materials that can be used as cathode and anode respectively. Intercalation of magnesium into Prussian blue compounds with sodium and co-intercalation of magnesium into natural graphite with ether solvents could suggest new method for development of magnesium based battery systems.
42
References
1. (a) Dunn, B.; Kamath, H.; Tarascon, J.-M., Electrical Energy Storage for the Grid: A Battery of Choices. Science 2011, 334 (6058), 928-935; (b) Tarascon, J. M.; Armand, M., Issues and challenges facing rechargeable lithium batteries. Nature 2001, 414 (6861), 359- 367.
2. Armand, M.; Tarascon, J. M., Building better batteries. Nature 2008, 451 (7179), 652-657.
3. (a) Vikström, H.; Davidsson, S.; Höök, M., Lithium availability and future
production outlooks. Applied Energy 2013, 110, 252-266; (b) Grosjean, C.; Miranda, P. H.;
Perrin, M.; Poggi, P., Assessment of world lithium resources and consequences of their geographic distribution on the expected development of the electric vehicle industry.
Renewable and Sustainable Energy Reviews 2012, 16 (3), 1735-1744.
4. Kim, T.-H.; Park, J.-S.; Chang, S. K.; Choi, S.; Ryu, J. H.; Song, H.-K., The Current Move of Lithium Ion Batteries Towards the Next Phase. Advanced Energy Materials 2012, 2 (7), 860-872.
5. Orsini, F.; Du Pasquier, A.; Beaudoin, B.; Tarascon, J. M.; Trentin, M.;
Langenhuizen, N.; De Beer, E.; Notten, P., In situ Scanning Electron Microscopy (SEM) observation of interfaces within plastic lithium batteries. Journal of Power Sources 1998, 76 (1), 19-29.
6. Nishi, Y., The development of lithium ion secondary batteries. The Chemical Record
2001, 1 (5), 406-413.7. Yoo, H. D.; Shterenberg, I.; Gofer, Y.; Gershinsky, G.; Pour, N.; Aurbach, D., Mg rechargeable batteries: an on-going challenge. Energy & Environmental Science 2013, 6 (8), 2265-2279.
8. Matsui, M., Study on electrochemically deposited Mg metal. Journal of Power Sources 2011, 196 (16), 7048-7055.
9. (a) Aurbach, D.; Lu, Z.; Schechter, A.; Gofer, Y.; Gizbar, H.; Turgeman, R.; Cohen, Y.; Moshkovich, M.; Levi, E., Prototype systems for rechargeable magnesium batteries.
Nature 2000, 407 (6805), 724-727; (b) Kim, J.-S.; Chang, W.-S.; Kim, R.-H.; Kim, D.-Y.;
Han, D.-W.; Lee, K.-H.; Lee, S.-S.; Doo, S.-G., High-capacity nanostructured manganese dioxide cathode for rechargeable magnesium ion batteries. J. Power Sources 2015, 273 (0), 210-215; (c) NuLi, Y.; Yang, J.; Wang, J.; Li, Y., Electrochemical Intercalation of Mg2+ in Magnesium Manganese Silicate and Its Application as High-Energy Rechargeable
Magnesium Battery Cathode. J. Phys. Chem. C 2009, 113 (28), 12594-12597; (d) Aurbach, D.; Suresh, G. S.; Levi, E.; Mitelman, A.; Mizrahi, O.; Chusid, O.; Brunelli, M., Progress in Rechargeable Magnesium Battery Technology. Advanced Materials 2007, 19 (23), 4260- 4267; (e) Mitelman, A.; Levi, M. D.; Lancry, E.; Levi, E.; Aurbach, D., New cathode
materials for rechargeable Mg batteries: fast Mg ion transport and reversible copper extrusion in CuyMo6S8 compounds. Chemical Communications 2007, (41), 4212-4214.
10. (a) Ha, S. Y.; Lee, Y. W.; Woo, S. W.; Koo, B.; Kim, J. S.; Cho, J.; Lee, K. T.; Choi, N. S., Magnesium(II) bis(trifluoromethane sulfonyl) imide-based electrolytes with wide electrochemical windows for rechargeable magnesium batteries. ACS Appl. Mater. Interfaces
2014, 6 (6), 4063-73; (b) Fukutsuka, T.; Asaka, K.; Inoo, A.; Yasui, R.; Miyazaki, K.; Abe,T.; Nishio, K.; Uchimoto, Y., New Magnesium-ion Conductive Electrolyte Solution Based on Triglyme for Reversible Magnesium Metal Deposition and Dissolution at Ambient
Temperature. Chem. Lett. 2014, 43 (11), 1788-1790.
43
11. (a) Lu, Z.; Schechter, A.; Moshkovich, M.; Aurbach, D., On the electrochemical behavior of magnesium electrodes in polar aprotic electrolyte solutions. Journal of
Electroanalytical Chemistry 1999, 466 (2), 203-217; (b) Ruch, P. W.; Cericola, D.; Hahn, M.;
Kötz, R.; Wokaun, A., On the use of activated carbon as a quasi-reference electrode in non- aqueous electrolyte solutions. J. Electroanal. Chem. 2009, 636 (1–2), 128-131; (c) Aurbach, D.; Weissman, I.; Gofer, Y.; Levi, E., Nonaqueous magnesium electrochemistry and its application in secondary batteries. The Chemical Record 2003, 3 (1), 61-73.
12. Gaddum, L. W.; French, H. E., THE ELECTROLYSIS OF GRIGNARD SOLUTIONS1. Journal of the American Chemical Society 1927, 49 (5), 1295-1299.
13. Gregory, T. D.; Hoffman, R. J.; Winterton, R. C., Nonaqueous Electrochemistry of Magnesium: Applications to Energy Storage. J. Electrochem. Soc. 1990, 137 (3), 775-780.
14. (a) Spahr, M. E.; Novák, P.; Haas, O.; Nesper, R., Electrochemical insertion of lithium, sodium, and magnesium in molybdenum(VI) oxide. Journal of Power Sources 1995, 54 (2), 346-351; (b) Rasul, S.; Suzuki, S.; Yamaguchi, S.; Miyayama, M., Synthesis and electrochemical behavior of hollandite MnO2/acetylene black composite cathode for secondary Mg-ion batteries. Solid State Ionics 2012, 225, 542-546.
15. (a) Gershinsky, G.; Yoo, H. D.; Gofer, Y.; Aurbach, D., Electrochemical and spectroscopic analysis of Mg2+ intercalation into thin film electrodes of layered oxides:
V2O5 and MoO3. Langmuir 2013, 29 (34), 10964-72; (b) Orikasa, Y.; Masese, T.; Koyama, Y.; Mori, T.; Hattori, M.; Yamamoto, K.; Okado, T.; Huang, Z.-D.; Minato, T.; Tassel, C.;
Kim, J.; Kobayashi, Y.; Abe, T.; Kageyama, H.; Uchimoto, Y., High energy density rechargeable magnesium battery using earth-abundant and non-toxic elements. Sci. Rep.
2014, 4, 5622; (c) Huang, Z.-D.; Masese, T.; Orikasa, Y.; Mori, T.; Yamamoto, k., Vanadium
phosphate as a promising high-voltage magnesium ion (de)-intercalation cathode host. RSC Adv. 2014, 5 (12), 8598-8603; (d) Arthur, T. S.; Kato, K.; Germain, J.; Guo, J.; Glans, P.-A.;
Liu, Y.-S.; Holmes, D.; Fan, X.; Mizuno, F., Amorphous V2O5?P2O5 as high-voltage cathodes for magnesium batteries. Chemical Communications 2015, 51 (86), 15657-15660.
16. (a) Lu, Y.; Wang, L.; Cheng, J.; Goodenough, J. B., Prussian blue: a new framework of electrode materials for sodium batteries. Chem. Commun. 2012, 48 (52), 6544-6; (b) Yu, S.
H.; Shokouhimehr, M.; Hyeon, T.; Sung, Y. E., Iron Hexacyanoferrate Nanoparticles as Cathode Materials for Lithium and Sodium Rechargeable Batteries. ECS Electrochem. Lett.
2013, 2 (4), A39-A41; (c) Wang, L.; Lu, Y.; Liu, J.; Xu, M.; Cheng, J.; Zhang, D.;