저작자표시-비영리-변경금지 2.0 대한민국 이용자는 아래의 조건을 따르는 경우에 한하여 자유롭게
l 이 저작물을 복제, 배포, 전송, 전시, 공연 및 방송할 수 있습니다. 다음과 같은 조건을 따라야 합니다:
l 귀하는, 이 저작물의 재이용이나 배포의 경우, 이 저작물에 적용된 이용허락조건 을 명확하게 나타내어야 합니다.
l 저작권자로부터 별도의 허가를 받으면 이러한 조건들은 적용되지 않습니다.
저작권법에 따른 이용자의 권리는 위의 내용에 의하여 영향을 받지 않습니다. 이것은 이용허락규약(Legal Code)을 이해하기 쉽게 요약한 것입니다.
Disclaimer
저작자표시. 귀하는 원저작자를 표시하여야 합니다.
비영리. 귀하는 이 저작물을 영리 목적으로 이용할 수 없습니다.
변경금지. 귀하는 이 저작물을 개작, 변형 또는 가공할 수 없습니다.
Master's Thesis
Fluorinated ester additive for the enhancement of LiNi 0.7 Co 0.15 Mn 0.15 O 2 cathode performance
in lithium ion batteries
Yeonkyoung Kim
Department of Energy Engineering (Battery Science and Technology)
Graduate School of UNIST
2018
1
Master's Thesis
Fluorinated ester additive for the enhancement of LiNi 0.7 Co 0.15 Mn 0.15 O 2 cathode performance
in lithium ion batteries
Yeonkyoung Kim
Department of Energy Engineering (Battery Science and Technology)
Graduate School of UNIST
2018
2
Fluorinated ester additive for electrochemical enhancement of LiNi 0.7 Co 0.15 Mn 0.15 O 2 cathode
in lithium ion batteries
Yeonkyoung Kim
Department of Energy Engineering (Battery Science and Technology)
Graduate School of UNIST
3
Fluorinated ester additive for the enhancement of LiNi 0.7 Co 0.15 Mn 0.15 O 2 cathode performance
in lithium ion batteries
A thesis/dissertation
submitted to the Graduate School of UNIST in partial fulfillment of the
requirements for the degree of Master of Science
Yeonkyoung Kim
2018. 1. 11
4
Fluorinated ester additive for the enhancement of LiNi 0.7 Co 0.15 Mn 0.15 O 2 cathode performance
in lithium ion batteries
Yeonkyoung Kim
This certifies that the thesis/dissertation of Yeonkyoung Kim is approved.
1/11/2018
5
Abstract
Energy density has been enhanced for next-generation applications such as electronic vehicle (EVs), hybrid electric vehicle (HEVs) and energy storage systems (ESSs). One of the alternative cathode candidate is layered lithium nickel(Ni)-cobalt(Co)-manganese(Mn) oxide Ni-rich LiNi1-x- yCoxMnyO2(NCM, 0<x,y<1). The first developed NCM was LiN1/3Co1/3Mn1/3O2(NCM111) which has already commercialized for mobile applications due to not only high capacity but low cost than LiCoO2. However, its capacity (155mAh/g) is still low for use in recent applications. Accordingly, many researchers have been studied high-Ni content NCM as a cathode by increasing the Ni content which is the main active redox species (Ni2+/Ni4+). By the way, Ni-rich NCM cathode has some problems such as transition metal dissolution, low thermal stability and microcrack generation, etc.
In this study, to overcome these problem ethyl 4,4,4-trifluoro butyrate (ETFB) as additive for stability at high voltage Ni-rich NCM (LiNi0.75Co0.15Mn0.15O2) cathode was introduced. When we used ETFB in 1.15M LiPF6 in EC/EMC/DEC (2/5/3 vol%, baseline) as electrolyte, it had improved electrochemical performances as well as thermal stability and retarded microcrack formation than baseline electrolyte.
In floating test and inductively coupled plasma-mass spectroscopy (ICP-MS), in case of ETFB, side reaction between cathode and electrolyte was lower than baseline electrolyte at high voltage (4.5V vs Li/Li+) and also decreased transition metal dissolution such as Ni, Mn and Co. In addition, discharge capacity of ETFB was enhanced considerably than no additive electrolyte, in particular at high temperature, 45oC. To understand the role of ETFB additive, differential scanning calorimetry (DSC) measurement was evaluated to the thermal stability of solid electrolyte interphase (SEI) and our group verified SEI formation through X-ray Photoelectron Spectroscopy (XPS) and attenuated total reflectance Fourier transform infrared (ATR-FTIR). Nuclear magnetic resonance (NMR) was evaluated to identify influence of LiOH in generation of microcrack generation developed by manufacturing process of cathode including high nickel.
These results suggested SEI formed by ETFB on the cathode and anode contributes to protect unwanted reaction which happen to solvent decomposition and HF attack which is responsible for microcrack and also endured at high temperature and during long-term cycling. Specially, microcrack generation.
6
Contents
1. INTRODUCTION
1.1. Lithium-ion battery...………..…….………12
1.2. Challenges of the Ni-based NCM cathode material………...………...……..………15
1.2.1. Transition metal dissolution……….………...15
1.2.2. Safety Issues...……….………17
1.3 Improvement strategies………...………..20
2. EXPERIMENTAL 2.1. Preparation of electrolytes and electrode……….21
2.2. Electrochemical measurements………...………..……….……….22
2.3. Characterization………...…...23
3. RESULTS AND DISCUSSION 3.1. Electrochemical performances of ETFB on the LiNi0.7Co0.15Mn0.15O2/graphite full cell …...24
3.2. Effect of ETFB on the cathode surface.………...……….……….….…26
3.2.1. Surface modification of LiNi0.7Co0.15Mn0.15O2 cathode….……….….26
3.2.2. Anodic stability improvements……….……….….……….30
3.2.3. Thermal stability enhancement……….……….….……….31
3.2.4. The microcrack generation retardation……….……….….……….32
3.3. Effect of ETFB on the anode surface.……….…………. ……38
3.3.1. Differential Capacity(dQ/dV) Analysis……….…………. ……38
3.3.2. Surface modification of graphite anode……….…………. ……39
4. CONCLUSION………...…………...………...….………...42
5. REFERENCES………...…………...………..………..………...43
7
List of figures
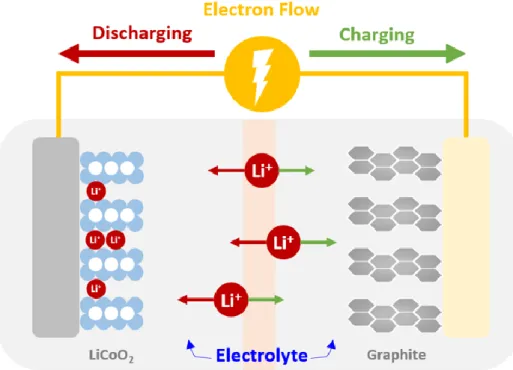
Figure 1. Schematic illustration of the Lithium-ion battery.
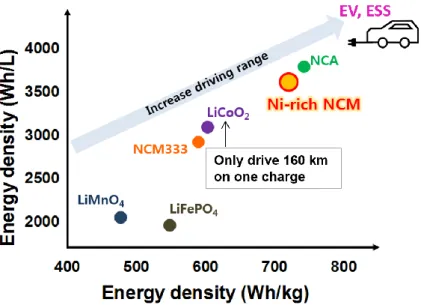
Figure 2. Energy density comparison for LiFePO4, LiMnO4, NCM333, LiCoO2, Ni-rich NCM and NCA.
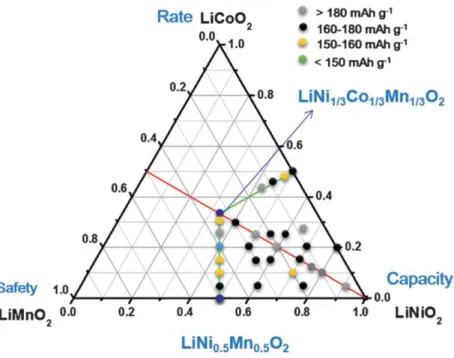
Figure 3. Compositional phase diagrams of lithium stoichiometric-layered transition-metal oxide:
LiCoO2-LiNiO2-LiMnO2. The positions indicated by dots represent the described LiNi1-x-yCoxMnyO2
materials.
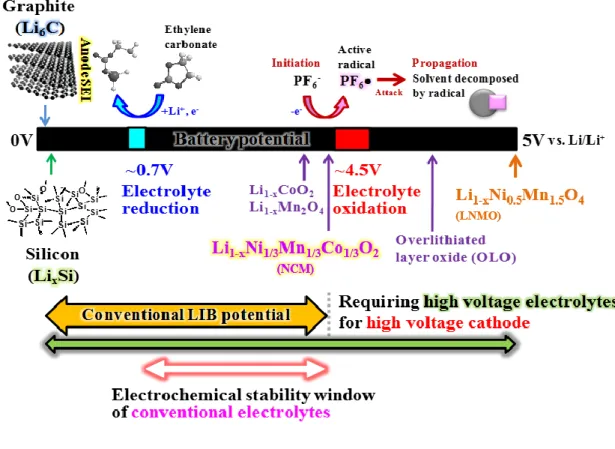
Figure 4. Schematic representation of potential window of conventional electrolytes.
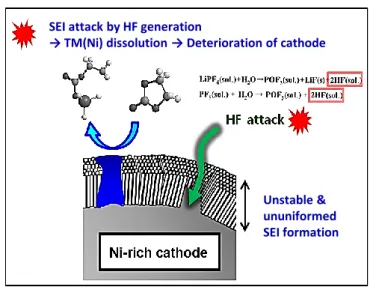
Figure 5.Schematic representation of transition metal dissolution on the Ni-rich cathode by a HF attack.
Figure 6. TGA curves of the chemically delithiated Li1-x[NixCoyMnz]O2 with (a)x=1/3, (b) x=0.5, (c)x=0.6, (d)x=0.7, (e)x=0.8 and (f)x=0.85.
Figure 7. A map of relationship between discharge capacity and thermal stability and capacity retention of Li/Li[NixCoyMnz]O2 (x=1/3, 0.5, 0.6, 0.7, 0.8 and 0.85)
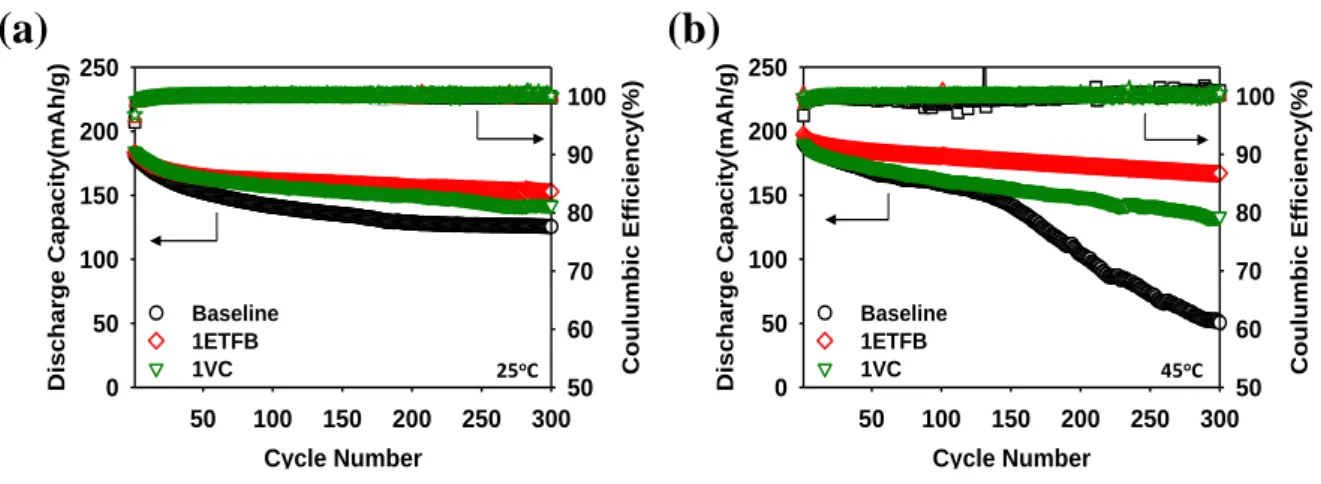
Figure 8. Cycle performance and Columbic efficiency of LiNi0.7Co0.15Mn0.15O2/graphite full cells with baseline. 1% ETFB additive and 1%VC additive at the different temperature, 25oC and 45oC, at a rate of C/2 during 300 cycles.
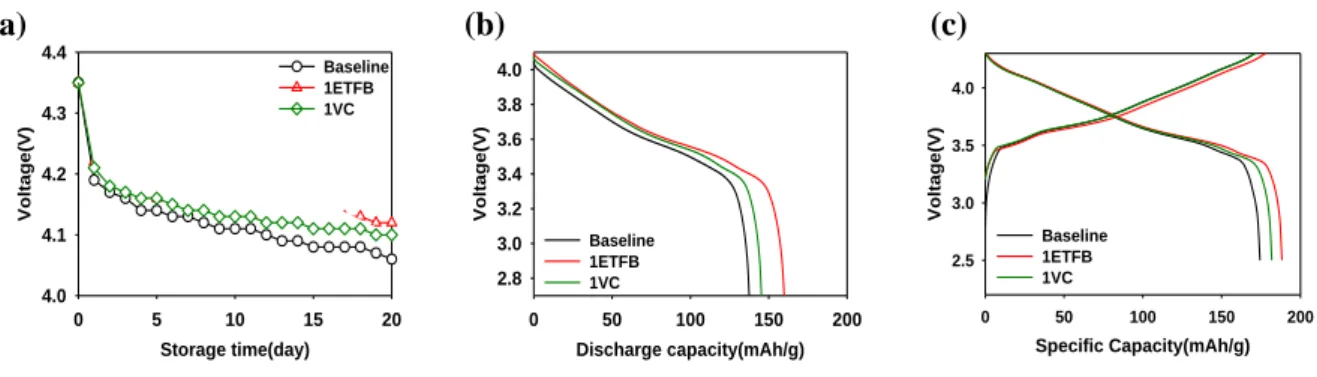
Figure 9. Storage performance of the LiNi0.7Co0.15Mn0.15O2/graphite full cells without additive, with 1%ETFB and 1%VC additive at the 60oC during 20days. (a)OCV drop, (b)discharge profile after storage and (c)charge and discharge profile after retention.
Figure 10. FTIR spectra of LiNi0.7Co0.15Mn0.15O2 cathodes after precycle at 2.5-4.35V of full cell according to electrolytes with and without ETFB additive.
Figure 11. F 1s, P 2p and C 1s spectra of LiNi0.7Co0.15Mn0.15O2 cathode after precycle at 2.5-4.35V of full cell. (a), (c) and (e) baseline electrolyte and (b), (d) and (f) electrolyte with 1%ETFB.
Figure 12. Possible mechanism of surface film formation for the ETFB additives on the LiNi0.7Co0.15Mn0.15O2 cathodes.
Figure 13. (a) Potentiostatic profiles at constant voltage of 4.4V for 10hour after charged to 4.4V for Li/ LiNi0.7Co0.15Mn0.15O2 half-cells with baseline and 1%ETFB electrolytes at 25oC. (b) A comparison
8
of transition metal dissolution of the baseline electrolytes and 1%ETFB contained electrolyte at 60oC for 24hours.
Figure 14. DSC heating curves of the fully delithiated LiNi0.7Co0.15Mn0.15O2 cathode with the baseline- derived SEI or ETFB-derived SEI heated to 300oC in presence of the baseline electrolyte.
Figure 15. The cross section SEM micrographs of the LiNi0.7Co0.15Mn0.15O2 (a), (b) with baseline electrolyte after 300th cycles and (b), (d) with 1%ETFB after 300th cycles after ion milling.
Figure 16. Voltage profile of the three electrode pouch full cell according to ETFB or not. (a) and (b) cathode voltage, (c) and (d) anode voltage vs Li/Li+.
Figure 17. 19F NMR spectra with and without 1%LiOH in baseline electrolyte. (a), (b) before storage and (c), (d) after storage during 3days at 60oC.
Figure 18. Mechanism of the LiPF6 hydrolysis existed ROH in electrolyte. (a)POF3 generation reaction with ROH and PF5 and (b) further mechanisms be the reactivity of POF3.
Figure 19. (a) Differential capacity versus voltage (dQ/dV) curves during precycle at the 25oC for the formation for the LiNi0.7Co0.15Mn0.15O2 /graphite full cells with and without ETFB, (b) dQ/dV plots of the LiNi0.7Co0.15Mn0.15O2 /graphite full cells with EC-free electrolyte (EMC/DEC/1.15M LiPF6 with and without 1%ETFB) during first Li intercalation of the formation cycle.
Figure 20. F 1s, P 2p and C 1s spectra of graphite anode after precycle at 2.5-4.35V of full cell. (a), (c) and (e) baseline electrolyte and (b), (d) and (f) electrolyte with 1%ETFB
Figure 21. Possible mechanism of surface film formation for the ETFB additives on the graphite anode.
9
List of Tables
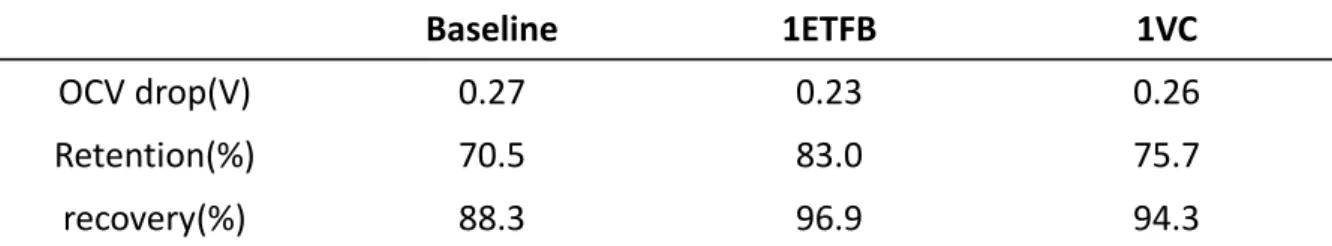
Table 1. Summarizing the storage performance of the LiNi0.7Co0.15Mn0.15O2/graphite full cells according to the electrolyte without additive, 1%ETFB and 1%VC.
Table 2. Summarizing the cut-off voltage of the cathode and anode vs. Li/Li+ at the threeelectrode system.
10
1. Introduction
1.1 Lithium-ion battery
Lithium-ion battery(LiBs) is a device that converts chemical energy to electronic energy or electronic energy to chemical energy through oxidation-reduction reaction. LiBs consist of cathode, anode, separator and electrolyte. (Fig. 1) During charging, cathode is lithiated and electron is moved to anode through outside tunnel. And then the electron make anode reduction state and lithium inserted in anode.
Separator prevents a short caused an electronic contact between cathode and anode. Electrolyte transports lithium ions between anode and cathode to maintain electrochemical stability1-4.
Rechargeable LiBs have been widely used in many commercial fields. In recent years, many researchers are focused on electric vehicle (EVs) as alternative of gasoline which has been used fossil fuel. However, there are points to solve for using LiBs in EV. Presently, LiCoO2(LCO), commercially used today such as mobile phone, laptop computer and camera, is too expensive but also low energy density (155mAh/g) (Fig. 2). Due to that reason, when we compose module of battery with LCO for EVs, it will increase the number of battery and also weight. Therefore, many researchers are going to study other cathode materials such as LiNixMn1-xO2(LNMO), Li-rich cathode, Ni-rich LiNi1-x- yCoxMnyO2(NCM, 0<x,y<1) cathode. 5-10 Today, Ni-rich NCM(1-x-y≥0.5) cathode is prospective candidate for LiBs cathode materials. Because when we used three component layered NCM, there are many benefits such as low cost, good compatibility with the electrolytes and high energy density (800Wh kg-1), etc. (Fig 3)11 That is, Ni-rich cathode can same output using small number of batteries.
11
Figure 1. Schematic illustration of the Lithium-ion battery
12
Figure 2. Energy density comparison for LiFePO4, LiMnO4, NCM333, LiCoO2, Ni-rich NCM and NCA.
Figure 3. Compositional phase diagrams of lithium stoichiometric-layered transition-metal oxide: LiCoO2-LiNiO2-LiMnO2. The positions indicated by dots represent the described
LiNi1−x−yCoxMnyO2 materials11
13 1.2 Challenges of the Ni-based NCM cathode material 1.2.1. Transition metal dissolution
When Ni-rich NCM uses as cathode materials, the energy density increases because Ni-rich NCM has a high voltage. However, transition metal dissolution takes place from cathode materials due to high voltage near 4.3V (vs. Li/Li+) which decomposition of an electrolyte is started. (Fig. 4)2,12-13 Especially, this reaction is accelerated by high temperature and a HF known as strong Lewis acid, decomposition compound formed by reaction with lithium hexafluorophosphate (LiPF6) salt and a little water existed in cell, following hydrolysis reaction14-15.
LiPF6 ↔ LiF + PF5
PF5 + H2O → POF3 + 2HF POF3 + H2O → PO2F2- + H+ + HF
PO2F2- + H+ + H2O → PO3F2- + 2H+ + HF PO3F2- + 2H+ + H2O → PO43- + 3H+ + HF
Formed by the HF attack, irreversible transition metal leads to not chemically fading on the cathode but capacity fading of the anode. In particular, highly reactive species Ni4+ in electrolyte facilitate decomposition of an electrolyte, leading to destroy solid electrolyte interface(SEI) on the anode (Fig.
5).16-21 More specifically, the transition metal dissolved in the electrolyte will continuously attack and degrade the electrode surface. As a results, high-nickel NCM transforms layered structure into spinel and rock salt phase. That is, structure disintegration unceasingly happens upon lithium ion extraction and reinsertion during repeated charge-discharge. Furthermore, it has influence on micro crack formation.10,22-23
Thus, the surface chemistry and side reactions are the key factor significantly impact on the performance of LiBs using Ni-rich materials as cathode. Therefore, a fundamental approach to protect surface of an electrode is required to obtain high performance of LiBs using high Ni-content NCM as a cathode.
14
Figure 4. Schematic representation of potential window of conventional electrolytes.
Figure 5. Schematic representation of transition metal dissolution on the Ni-rich cathode by a HF attack
SEI attack by HF generation
→ TM(Ni) dissolution → Deterioration of cathode
Unstable &
ununiformed SEI formation
15 1.2.2 Safety Issues
Energy density has been enhanced for next-generation applications such as electronic vehicle (EVs), hybrid electric vehicle (HEVs) and energy storage systems (ESSs). One of the alternative cathode candidate is layered lithium nickel(Ni)-cobalt(Co)-manganese(Mn) oxide, Ni-rich LiNi1-x- yCoxMnyO2(NCM, 0<x,y<1). The first developed NCM was LiN1/3Co1/3Mn1/3O2(NCM111) which has already commercialized for mobile applications due to not only high capacity but low cost than LiCoO2. However, its capacity (155mAh/g) is still low for use in recent applications. Accordingly, many researchers have been studied high-Ni content NCM as a cathode by increasing the Ni content which is the main active redox species (Ni2+/Ni4+)24-25. By the way, it is widely known cathode formed by the higher Ni contents has a trade-off between a high energy density and thermal stability. (Fig. 6, Fig.7)26 In other words, Ni provides low thermal stability as well as a high capacity. That is, increasing the composition of Ni is inevitable to apply NCM to following energy market. And it also means exothermic reactions between organic electrolyte and active material easily take place in high-capacity LiBs in a charge state. This situation is caused when oxygen released from a cathode having structural instability by triggering mechanism. Above all, the oxygen species produced from the cathode are so reactive with the electrolytes that they contribute remarkably to the thermal runaway.11 Therefore, developing the electrolyte material having a heat-resisting property and additive to form cathode electrolyte interface (CEI) delaying a thermal runaway are mandatory to enhance the safety of LiBs.
16
Figure 6. TGA curves of the chemically delithiated Li1-x[NixCoyMnz]O2 with (a) x=1/3, (b) x=0.5, (C)x=0.6, (d)x=0.7, (e)x=0.8 and (f)x=0.85.26
17
Figure 7. A map of relationship between discharge capacity and thermal stability, and capacity retention of Li/Li[NixCoyMnz]O2 (x=1/3, 0.5, 0.6, 0.7, 0.8 and 0.85) 26
18 1.3 Improvement strategies
Although Ni-rich NCM has high capacity and low cost, there are several challenges to solve such as electrolyte decomposition due to high operating voltage and low thermal stability. In recent years, to solve this problem many researchers have been focused on surface modification through electrolytes with new lithium salts 27,28, new solvents29,30, new electrolyte system31 and newadditives32-34. J,R Dahn.
et al. studied mixture of lithium bis(fluorosulfonyl) imide (LiFSI) salt and lithium hexafluorophosphate (LiPF6). The effect of the mixture salt demonstrated several advantages such as low voltage drop during storage and decreasing the gas generation in Li[Ni1/3Mn1/3Co1/3]O2/graphite pouch full cells.27 K.Y cho et al. reported that electrolyte containing 1.0M LiPF6 in solvent mixture of methyl (2,2,2-trifluoroethyl) carbonate (FEMC) and fluoroethylene carbonate(FEC) exhibited excellent cycling performance at 25oC in Li[Ni0.5Mn0.3Co0.2]O2/graphite coin full cells compared to conventional electrolytes which is not contained fluorine atoms in molecule.29 Yamada et al. introduced superconcentrated system in electrolytes. They found considerable effect at high-voltage LiNi0.5Mn1.5O4/graphite battery that exhibits excellent cycling durability, high rate capability and enhanced safety.31 Qiyang Hu and co- workers reported enhanced cell performance via the addition of the 1-propylphosphonic acid cyclic anhydride(PACA). The addition of 0.5wt% PACA in the electrolyte significantly improved capacity retention at 25oC in LiNi0.5Co0.2Mn0.3O2/Graphite coin full cell. at high operation voltage.34 To the best of our group knowledge, we focused on method associated to modify an electrode surface by decomposing additive prior to carbonate-based electrolyte which is widely used in commercial electrolyte of lithium-ion battery(LiBs) by using of fluorine(F)-contained ester which has been a little reported as electrolyte additive in high voltage LiBs. In this study, one of the F-contained ester additive candidates our group selected the ethyl 4,4,4-trifluorobutyrate (ETFB) and we studied to understand how the ETFB improves the electrochemical performance on Li[Ni0.7Mn0.15Co0.15]O2 / graphite full cell at high voltage.
19
2. Experimental
2.1. Preparation of the electrolytes and electrodes
Baseline electrolyte was prepared 1.15M Lithium hexafluorophosphate(LiPF6) dissolved in solvent mixture of ethylene carbonate(EC)/ethyl methyl carbonate(EMC)/diethyl carbonate(DEC) with 2:5:3 volume ratios. ETFB-added electrolyte was made by blending with 1wt% ethyl 4,4,4-trifluoro butyrate(ETFB, Sigma-aldrich, ≥98%) in baseline electrolyte. All solvent and LiPF6 salt (Soulbrain Co., Ltd) were purchased. The mixed solvents were treated with calcium hydride (CaH2, Sigma-Aldrich, 95%) to reduce water content less than 10ppm before LiPF6 was dissolved in solvent mixture to form electrolytes. Two electrolytes after dissolved salt in solvent mixture with and without ETFB were treated by CaH2 and filtered after 3Hr. The water content of electrolytes was confirmed less than 10 ppm by Karl Fischer titration (C30, Mettler toledo).
The cathode performed with NCM/graphite full cell was composed of LiNi0.7Co0.15Mn0.15O2,Super C and polyvinylidene fluoride (PVDF 6020) dissolved in anhydrous N-methyl-2-pyrrolidone (NMP, 99.5%, Sigma-Aldrich) as active material, conducting material and binder (94/3/3wt%), respectively.
The thickness without current collector and active material loading of the cathode were 80um, 25.6mg/cm2. The anode consisted of 97.5wt% graphite as active material and 2.5wt% binder (1.5wt%
styrene butadiene rubber+1wt% sodium carboxymethyl cellulose) dissolved in distilled water. The thickness without current collector and active material loading of the anode were 83um, 13.6mg/cm2
20 2.2. Electrochemical measurements
NCM/graphite 2032 coin-type full-cells were assembled with a microporous polyethylene film (SK innovation Co., Ltd) as a separator, which was 20um thick and 38% porosity, in an argon-filled glove box (O2 and H2O < 1ppm). NCM/graphite full-cells were galvanostatically precycled between 3.0V and 4.35V vs. Li/Li+ at 25oC at a constant current of C/10 by using a computer-controlled battery testing equipment (WonATech WBCS 3000). After the charge of the precycling, the constant voltage condition was applied until the current was below C/100. Before cycling at 25oC or 45oC, standard cycling was performed between 3.0 and 4.35V vs. Li/Li+ at a constant current of C/5. Thereafter, the full-cells were evaluated for cycling performance between 3.0V and 4.35V vs. Li/Li+ at 25oC or 45oC at a constant current of C/2.
To investigate effect of the ETFB additive at storage performance at elevated temperature, the NCM/graphite full cells were stored for 20days at 45oC in a fully lithiation state, and then their capacity retention was performed at 25oC. This capacity retention was calculated on the basis of the discharge capacity before storage.
21 2.3. Characterization
The cells after precycling were opened carefully in a glove box. Then, the electrodes and parts of the cell were put in a PE vial including 2g of dimethyl carbonate(DMC) to identify the residual of ETFB additive in electrolyte. After 5 min, DMC in PE vial was filtered and mixed with [D8] THF solvent (1/1 vol%) to prepare the samples for 19F NMR analysis. As a comparative group of this sample, ETFB itself was evaluated by mixing with [D8] THF solvent. Cell impedances of NCM/graphite full cell after precycling and cycling were measured by an AC impedance analysis with an IVIUM frequency response analyzer over a frequency range of 0.01Hz to 1MHz, perturbation amplitude 5mV. After precycling and cycling, the cells were opened in a glove box to obtain their electrodes. Then, the electrodes were rinsed in DMC to remove the residual electrolyte. After sufficient volatilization of DMC at room temperature, sample were sealed in an aluminum pouch to prevent a contamination as much as possible. The electrodes were used for surface chemistry and cross-section. The surface composition of the electrodes was studied by ex-situ X-ray photoelectron spectroscopy (XPS, Thermo Scientific K- Alpha system) and attenuated total reflectance Fourier transform infrared (ATR-FTIR, Varian 670) spectra. The cross-section images of the electrodes were obtained with field-emission (FE-SEM, JSM- 6700F, JEOL) in a high-vacuum environment after the smooth cross section was prepared by ion-milling system (IM4000, Hitachi) that employs an Ar ion beam. Thermal analysis of charged NCM cathode was conducted by using differential scanning calorimeter (DSC, Mettler Toledo) to investigate the thermal stability of the solid electrolyte interphase (SEI) with and without ETFB additive, scanned at a 5oC min-1 under a nitrogen atmosphere.
22
3. Results and discussion
3.1 Electrochemical performances of Additive on the LiNi0.7Co0.15Mn0.15O2/graphite full cell
The cycling performances of full cells constructed with graphite anodes, and the electrolytes with baseline electrolyte, 1% ETFB and 1%VC were shown in Figure 8 under the different temperature, 25oC and 45oC. When the cells were cycled in the voltage range (3.0-4.35V), they showed different discharge capacity retention behavior repeated 300 charge-discharge cycles. The cells with ETFB additive in the electrolyte demonstrated significantly enhanced cycling performance, especially high temperature at 45oC. The capacities of the cells at the initial discharge were 181mAh/g, 190mAh/g and 184mAh/g following baseline electrolyte, 1%ETFB and 1%VC, respectively 25oC and 45oC. After 100th charge-discharge cycles, the cells using baseline electrolyte were 141mAh/g and 159mAh/g and 1%VC additive electrolyte was 158mAh/g and 162mAh/g whereas the discharge capacity in the electrolyte with ETFB additive were 161mAh/g and 180mAh/g, respectively 25oC and 45oC. With respect to capacity retentions were 69.3%, 83.4% and 77.1% for cells without additive, with 1% ETFB and 1%VC additive at 25oC, respectively as shown in Figure 8(a). Moreover, a discharge capacity retention of the full cells at 45oC with the baseline electrolyte were obtained only 26.5% compared to cells introducing ETFB additive 84.8% after undergoing 300 cycles as shown in Figure 8(b).
Figure 8. Cycle performance and Columbic efficiency of LiNi0.7Co0.15Mn0.15O2/graphite full cells with baseline, 1% ETFB additive and 1%VC additive at the different temperature, 25oC and 45oC, at a rate of C/2 during 300 cycles.
Cycle Number
50 100 150 200 250 300
Discharge Capacity(mAh/g)
0 50 100 150 200 250
Coulumbic Efficiency(%)
50 60 70 80 90 100
Y Axis 4
50 60 70 80 90 100
Baseline 1ETFB 1VC
Cycle Number
50 100 150 200 250 300
Discharge Capacity(mAh/g)
0 50 100 150 200 250
Coulumbic Efficiency(%)
50 60 70 80 90 100
Y Axis 4
50 60 70 80 90 100
Baseline 1ETFB 1VC
(a) (b)
25oC 45oC
23
As shown the Figure 9 and Table 1, ETFB additive was also outstanding storage performance at the high temperature 20 days at 60oC. Compared to VC additive, ETFB has similar OCV drop in Figure 9(a). Whereas, ETFB has high discharge capacity after storage and recovery in Figure 9(b) and (c).
Table 1 was summarized the storage performance of the LiNi0.7Co0.15Mn0.15O2/graphite full cells according to the electrolyte without additive, 1%ETFB and 1%VC. The OCV drop means how well retain initial charge voltage during storage which was calculated by voltage after 20days storage subtracting from charge voltage, 4.35V. The capacity retention and recovery were calculated on the basis of the discharge capacity before storage.
Figure 9. Storage performance of the LiNi0.7Co0.15Mn0.15O2/graphite full cells without additive, with 1%ETFB and 1%VC additive at the 60oC during 20days. (a)OCV drop, (b)discharge profile after storage and (c)charge and discharge profile after retention.
Table 1. Summarizing the storage performance of the LiNi0.7Co0.15Mn0.15O2/graphite full cells according to the electrolyte without additive, with 1%ETFB and 1%VC.
Storage time(day)
0 5 10 15 20
Voltage(V)
4.0 4.1 4.2 4.3
4.4 Baseline
1ETFB 1VC
Discharge capacity(mAh/g)
0 50 100 150 200
Voltage(V)
2.8 3.0 3.2 3.4 3.6 3.8 4.0
Baseline 1ETFB 1VC
(a) (b) (c)
Specific Capacity(mAh/g)
0 50 100 150 200
Voltage(V)
2.5 3.0 3.5 4.0
Baseline 1ETFB 1VC
Baseline 1ETFB 1VC
OCV drop(V) 0.27 0.23 0.26
Retention(%) 70.5 83.0 75.7
recovery(%) 88.3 96.9 94.3
24 3.2. Effect of Additives on cathode surface.
3.2.1. Surface modification of LiNi0.7Co0.15Mn0.15O2 cathode
To investigate the electrochemical enhancement behavior of cells on the cathode surface with 1%
ETFB at NCM/graphite full cells, FTIR spectra of the cathode from precycled the full cells and pristine were obtained in Figure 10, according to presence of 1%ETFB or not. Pristine and all precycled cathode can be observed peaks at 1457-1407 cm-1 and 1497cm-1 due to methyl(-CH3) and methylene groups(- CH2-) of alkyl functionality from PvdF binder.Prominent peak at 1280-1260cm-1 is ν(C-F) peak about PvdF binder. A weak absorbance peak at 1457 cm-1 is due to ν(CO3)sym of low fraction of Li2CO3. Relatively high absorbance peaks at 1263cm-1 and 1083 cm-1 attibuted to ν(C-O-C)asym and ν(O-C-C)asym
confirmed the ester fuctionalities by the ETFB. 35,36,37,38 New peak around 1100-1084 cm-1 and 1178cm-
1 can be detected due to –CF3 and CF functionalities, which is ETFB decomposition products. Without ETFB, related -CF2- and –CF3 is not found.39,40,41 This in turn demonstrates the effect of the ETFB on the cathode in producing –CF3 and –CF2- containing species.
Figure 10. FTIR spectra of LiNi0.7Co0.15Mn0.15O2 cathodes after precycle at 2.5-4.35V according to electrolytes with and without ETFB additive.
Wavenumber (cm
-1)
1000 1200
1400 1600
1800 2000
Abs orbanc e (a .u.)
Pristine Baseline ETFB
0.005
25
In addition, XPS measurement conducted to check more closely the degree of side-reactions caused by decomposition of LiPF6 salt at the interface between electrolyte and cathode. Figure 11 shows the surface chemistries of the Ni-rich NCM with and without 1%ETFB after the precycle. Clearly, the F 1s peak indicates relative fraction of LiF peak at 685 eV with ETFB which acted as resistance layer on the cathode additive remarkably decreased than baseline electrolyte from 39.7% to 34.9%.42,43 The implicit intensity of the peaks corresponding to LixPFy, LixPOyFz and phosphate (P-O) in the P 2p peak are considerably reduced for the cathode with 1% ETFB as shown in Figure 11(c) and (d). Figure 11 (f) was shown new peak at 291.8eV formed by decomposition of ETFB additive similar to FT-IR results and carboxylate peak (-CO2) little increase due to oxidized ETFB on the cathode surface due to ETFB as the presence of ester moiety. In addition, lithium carbonate (Li2CO3) has diminished from to owing to disturbance solvent decomposition such as ring-opening reaction of EC. compared to baseline in Figure 11 (e). This results suggested that surface film derived by additive effectively interrupts contact between cathode and HF formed by LiPF6 hydrolysis during cycling.
Characteristic mechanism of ETFB illustrated in Figure 12 based on FT-IR and XPS analytical method.
ETFB oxidized on the LiNi0.7Co0.15Mn0.15O2 cathode with EC solvent in baseline electrolyte and formed fluorine contained SEI restrict from attack of HF.
26
Figure 11. F 1s, P 2p and C 1s spectra of LiNi0.7Co0.15Mn0.15O2 cathodeafter precycle at 2.5-4.35V of full cell. (a), (c) and (e) baseline electrolyte and (b), (d) and (f) electrolyte with 1% ETFB.
F 1s
Binding energy(eV)
680 682 684 686 688 690 692 694
Intensity(a.u.)
0 25000 50000 75000 100000
P 2p
Binding energy(eV)
128 130 132 134 136 138 140 142 144
Intensity(a.u.)
0 1000 2000 3000 4000
P 2p
Binding energy(eV)
128 130 132 134 136 138 140 142 144
Intensity(a.u.)
0 1000 2000 3000 4000
C 1s
Binding energy(eV)
282 284 286 288 290 292 294
Intensity(a.u.)
0 25000 50000 75000 100000
C 1s
Binding energy(eV)
282 284 286 288 290 292 294
Intensity(a.u.)
0 25000 50000 75000 100000
F 1s
Binding energy(eV)
680 682 684 686 688 690 692 694
Intensity(a.u.)
0 25000 50000 75000 100000
P-F/C-F LiF
60.3% 39.7%
P-F/C-F LiF
65.1% 34.9%
LixPFy LixPOFy
P-O (P 2p1/2)
P-O (P 2p3/2)
LixPFy LixPOFy
P-O (P 2p1/2)
P-O (P 2p3/2)
C-H
C-O-C Li2CO3
-CO2 -CF2
ETFB C-H
C-O-C Li2CO3
-CO2 -CF2
(a) (b)
(c) (d)
(e) (f)
27
Figure 12. Possible mechanism of surface film formation for the ETFB additives on the LiNi0.7Co0.15Mn0.15O2 cathodes.
ETFB additive
CF3contained compounds (SEI)
+EC
Further decompose
- e
-+
+
-CO2
28 3.2.2 Anodic stability improvements
To identify improvement of anodic stability in the electrolyte with 1% ETFB, an electrochemical floating test was performed using Li/LiNi0.75Co0.15Mn0.15O2 half cell up to 4.4V vs. Li/Li+. As shown in Figure 13 (a), 1% ETFB has low current value compared to baseline which means CEI derived ETFB added electrolyte is more stable than CEI derived EC-based electrolyte. To investigate transition metal dissolution with and without additive, Figure 13 (b) demonstrates the transition metal dissolution concentrations in the electrolyte samples existing ETFB or not, stored in PE vial with 2g of electrolyte and delithiated cathode during 24hours at 60oC. Metal dissolution increases when baseline electrolyte used which means baseline electrolyte added ETFB additive effectively protected Ni-rich cathode surface. This features suggests CEI formed by ETFB including –CF2- and –CF3 in Figure 13 has higher oxidation durability than baseline and also prevents undesirable electrolyte decomposition in the highly oxidizing environment, in particular transition metal dissolution.
Figure 13. (a) Potentiostatic profiles at constant voltage of 4.4V for 10hour after charged to 4.4V for Li/LiNi0.7Co0.15Mn0.15O2 half-cells with baseline and 1%ETFB electrolytes at 25oC. (b) A comparison of transition metal dessolution of the baseline electrolyte and 1%ETFB contained electrolyte at 60oC for 24hours.
Transition metal dissolution content (ppm)
0.0 0.5 1.0 1.5 2.0 2.5
Baseline 1ETFB
Ni Co Mn
Time (hr)
0 2 4 6 8 10
Normal Current (%)
0 20 40 60 80
100 Baseline
1ETFB
(a) (b)
29 3.2.3. Thermal stability enhancement
To investigate the surface chemical reaction, Ni-rich NCM cathodes, LiNi0.7Co0.15Mn0.15O2, charged until 4.35V vs. Li/Li+ after precycle and obtained the profile of thermal stability in the presence of a baseline electrolyte through the DSC analysis up to 300oC. In Figure 14, DSC curve of deithiated cathode material without additive behave quite differently against ETFB. Compared to no additive electrolyte, ETFB contained electrolyte deferred onset temperature about 4oC and reduced around 70% of the exothermic heat production due to fluorinated compound constructed by ETFB. It was good evidences that ETFB derived SEI may help form thermally stable surface film on the cathode particles. As a result, surface modification added ETFB additive enhances thermal stability and ameliorates safety issue, one of the Ni-rich NCM cathode problem.
Figure 14. DSC heating curves of the fully delithiated LiNi0.7Co0.15Mn0.15O2 cathode with the baseline- derived SEI or ETFB-derived SEI heated to 300oC in presence of the baseline electrolyte.
Temperature (oC)
150 200 250 300
Heat fl ow ( mW)
EC derived SEI ETFB derived SEI
H = 241.13 J/g
H = 324.8 J/g Onset temp. 237oC
Onset temp. 233oC
30 3.2.4 The microcrack generation retardation
After the cycling at 25oC and 45oC, cells carefully disassembled in glove box and the withdrawing sample after 5min washing keep aluminum pouch in vacuum state to protect from contaminations. To identify degree of the microcrack formation in Ni-rich NCM cathode, cross section SEM images were obtained after ion milling according to temperature and additive or not. Figure 15 (a) and (b) demonstrated cross section features in accordance with ETFB additive at 25oC and Figure 15 (c) and (d) are obtained image after repeated 300th charge discharge at 45oC. As a results, NCM protected by ETFB has clean face and observed little crack formation. However, baseline electrolyte which has EC derived SEI confirm severe microcrack. In particular, cathode protected as SEI formed by baseline electrolyte accelerates the phenomenon about broken the secondary particle at high temperature condition 45oC. Those difference between baseline and ETFB added electrolyte explained cause improved cell performance in Figure 8 for that reason increasing formation of crack by baseline brings less electrical conductivity and electrochemical inertness than ETFB added electrolyte.
Figure 15. The cross section SEM micrographs of the LiNi0.7Co0.15Mn0.15O2 (a), (b) with baseline electrolyte after 300th cycles and (b), (d) with 1%ETFB after 300th cycles after ion milling.
crack
crack
crack
50um 50um
50um 50um
50um
(a) (b)
(c) (d)
25oC 25oC
45oC 45oC
31
Pengfei. Y et al studied cause of microcrack formation and demonstrated high-voltage cycling is the direct driving force for intragranylar crack generation.22 Figure 16 indicated cycling performance as the three electrode pouch full cell for that reason full cell system didn’t identify own voltage of the cathode and anode and summerize the cut-off voltage applied to electrode pratically in Table 2. Baseline electrolyte has high charge and discharge voltage than ETFB added electrolyte approximately as much as 0.05V vs Li/Li+. As a results, cell applied electrolyte contained baseline deteriorates as proceeding continuous cycling but when introduced ETFB in the electrolyte cell performance improved and situation increasing the voltage cut-off not happen.
32
Figure 16. Voltage profile of the three electrode pouch full cell according to ETFB or not. (a) and (b) cathode voltage, (c) and (d) anode voltage vs Li/Li+.
Table 2. Summerizing the cut-off voltage of the cathode and anode vs Li/Li+ at the threeelectrode system.
1ETFB
Specific Capacity(mAh/g)
0 50 100 150 200
Voltage(V)
2.0 2.5 3.0 3.5 4.0 4.5
1th 50th 100th 150th 200th 250th 300th
1ETFB
Specific Capacity(mAh/g)
0 50 100 150 200
Voltage(V)
0.0 0.2 0.4 0.6 0.8 1.0
1th 50th 100th 150th 200th 250th 300th Baseline
Specific Capacity(mAh/g)
0 50 100 150 200
Voltage(V)
2.0 2.5 3.0 3.5 4.0 4.5
1th 50th 100th 150th 200th 250th 300th
Baseline
Specific Capacity(mAh/g)
0 50 100 150 200
Voltage(V)
0.0 0.2 0.4 0.6 0.8 1.0
1th 50th 100th 150th 200th 250th 300th
(a) (b)
(c) (d)
1th 50th 100th 150th 200th 250th 300th
Basline (V) 4.5-0.15 4.44-0.09 4.47-0.12 4.47-0.12 4.48-0.13 4.50-0.15 4.50-0.15 1ETFB (V) 4.44-0.09 4.43-0.08 4.43-0.08 4.44-0.09 4.43-0.08 4.43-0.08 4.43-0.08
33
Although voltage of cell having condition without additive climbs slightly, that condition not directly effect on formation of the microcrack due to pertaining small difference of voltage between additive or not. Thus, residual by-products inside Ni-rich cathode considered as another reasons, the degradation of the cathode materials, in that Ni-rich NCM has high pH value possiblity undegoing more unwanted reaction is high than other cathode materials. Because Wantanabe. S. et al suggested that the thick SEI film formed by the side reaction at a grain boundaries cause poor electrical contact between the primary particles and lead to capacity and power dereioration.44 Additionally, it is investigated impact in the electrolyte of LiOH created in process made Ni-rich NCM due to similar ion size both Ni2+ and Li+. At first, the concentration of LiOH in LiNi0.7Co0.15Mn0.15O2 powder were inquired and it has 2950ppm. Baseline electrolyte with and without 1%LiOH stored in PE vial during 3days at 60oC to verify the influence of LiOH. Figure 17 signified LiPF6 hydrolysis accelerate as LiOH introduced in electrolyte and generation amount of HF increase as schematic diagram in Figure 18.45,14 Consquently, LiOH multiplied the side reaction in bulk electrolyte and it is essencial to
remove. But if LiOH formation is unavoidable, the electrode should be protected from these unwanted reaction through tuning the surface by additive like ETFB. This experiment verified ETFB additive tellingly contribute to perform the surface film at LiNi0.7Co0.15Mn0.15O2 cathode whereby microcrack development retarded effectively.
34
Figure 17. 19F NMR spectra with and without 1%LiOH in baseline electrolyte (a), (b) before storage and (c), (d) after storage during 3days at 60oC.
Chemical shift (ppm) -90 -85 -80 -75 -70 -65 -60
PF
6-PO
2F
2-Chemical shift (ppm) -90 -85 -80 -75 -70 -65 -60
PF
6-PO
2F
2-Chemical shift (ppm) -90 -85 -80 -75 -70 -65 -60
PF
6-Chemical shift (ppm) -90 -85 -80 -75 -70 -65 -60
PF
6-PO
2F
2-PO
3F
-(a) (b)
(c) (d)
Chemical shift (ppm)
-154.5 -154.0
No HF
Chemical shift (ppm)
-154.5 -154.0
No HF
Chemical shift (ppm)
-154.5 -154.0
HF
Chemical shift (ppm)
-154.5 -154.0
HF
Baseline 1LiOH
1LiOH Baseline
35
Figure 18. Mechanism of the LiPF6 hydrolysis existed ROH in electrolyte. (a) POF3 generation reaction with ROH and PF5 and (b) further mechanisms by the reactivity of POF3.45,14
LiPF
6↔ LiF + PF
5ROH
HF + RF
POF
3H2O
HF
PF5+ LiF
H2O
H2O
HF
H2O
HF
HF
LiPF6 F P F
F F F F
-
Li+
O F
P F
F
OPF3
H+(PO2F2)- O O P
F F H+
-
O O P
O O 3H+
3-
2H+(PO3F)2- O O P
O F 2H+
2-
OPF
3(a)
(b)
36 3.3. Effect of Additives on anode surface.
3.3.1. Differential Capacity (dQ/dV) Analysis
To understand the electrochemical enhancement behavior of cells with 1% ETFB at NCM/graphite full cells, the dQ/dV plot of the cells after precycle were obtained with and without 1%ETFB. Figure 19 (a) show the differential capacity (dQ/dV) versus voltage (V) during precycle. A small different peak can be observed in Figure 19. The apparent peaks at 3.02V and 3.04V were observed in the dQ/dV versus V curves shown in Figure 19 (a), which may respectively be consistent to the EC reduction and ETFB with EC co-reduction at the graphite anode during charge. To clarify the possibility of co- reduction between EC and ETFB at the graphite anode, dQ/dV graphs precycled with EC-free electrolytes (EMC/DEC/1.15M LiPF6 with and without 1% ETFB) were obtained, as shown in the Figure 19 (b). Interestingly, Figure 19 (b) provide the reduction voltage of the ETFB decomposition was similar with the EC in the baseline electrolyte. This finding implied that the reaction between EC and ETFB can happen and co-reduction peak of the EC and ETFB delayed in comparison with only decomposing the EC.
Figure 19. (a) Differential capacity versus voltage (dQ/dV) curves during precycle at the 25oC for the formation for the LiNi0.7Co0.15Mn0.15O2/graphite full cells with and without ETFB, (b) dQ/dV plots of the LiNi0.7Co0.15Mn0.15O2/graphite full cells with EC-free electrolyte (EMC/DEC/1.15M LiPF6 with and without 1% ETFB) during first Li intercalation of the formation cycle.
Voltage (V)
2.8 3.0 3.2 3.4
dQ/dV
0.000 0.002 0.004 0.006 0.008 0.010
Baseline 1ETFB
EC reduction EC & ETFB Co-reduction
Voltage (V)
2.8 3.0 3.2 3.4
dQ/dV
0.000 0.001 0.002 0.003 0.004 0.005
EMC/DEC EMC/DEC+1ETFB
ETFB reduction
(a) (b)
37 3.3.2. Surface modification of graphite anode
XPS measurement was employed to analyze the effect of additive on the electrode surface component of graphite retrieved LiNi0.7Co0.15Mn0.15O2/graphite full cell after precycle. The peak located at 685.1 eV is associated with F atoms within LiF generated by ETFB additive.46,47,48 As observed from the F 1s spectra in Figure 20 (b), the intensity of LiF was greater than that for the anode without additive in Figure 20 (a), indicating that ETFB participate in developing the surface film as LiF formation.
Contrastively. the intensities of LiF peak on the cathodes with ETFB in the baseline electrolyte were lower than those for cells without additive as indicated in Figure 11 (a) and (b). The implicit intensity of the peaks corresponding to LixPFy, LixPOyFz and phosphate (P-O) in the P 2p peak (Figure 20 (c) and (d)) are narrowly reduced for the anode with 1% ETFB. Four peaks are observed in the C 1s spectra, shown in Figure 20 (f). New peak having CF2 moiety reduced ETFB on the anode was emerged at 290.6 eV in C 1s spectra.49,50 This results were demonstrated ETFB reduced on the graphite anode and formed protective film to hinder the side-reaction by LiPF6 hydrolysis with residual water and LiOH.
Possible mechanism of ETFB reforming surface chemistry on the anode illustrated in Figure 21 based on dq/dv and XPS analytical method.51 As depicted, ETFB reduced on the graphite anode with EC solvent as one electron was accepted and put out the LiF and SEI composed CF2 moiety effectively could prevent from unwanted reaction.
![Figure 6. TGA curves of the chemically delithiated Li 1-x [Ni x Co y Mn z ]O 2 with (a) x=1/3, (b) x=0.5, (C)x=0.6, (d)x=0.7, (e)x=0.8 and (f)x=0.85](https://thumb-ap.123doks.com/thumbv2/123dokinfo/10518606.0/18.892.124.798.138.900/figure-tga-curves-chemically-delithiated-li-ni-mn.webp)
![Figure 7. A map of relationship between discharge capacity and thermal stability, and capacity retention of Li/Li[Ni x Co y Mn z ]O 2 (x=1/3, 0.5, 0.6, 0.7, 0.8 and 0.85) 26](https://thumb-ap.123doks.com/thumbv2/123dokinfo/10518606.0/19.892.124.784.134.752/figure-relationship-discharge-capacity-thermal-stability-capacity-retention.webp)