대기보정 알고리즘 개발을 위한 현장관측자료 및 표준알고리즘 확보 3차년도에는 황해에서 관측된 생체정보 분석 및 해색정보 활용 연구를 통해 SeaWiFS 데이터를 지속적으로 확보하고, 이를 분석하여 한반도 주변 해역의 해양이용에 대한 연구가 진행되었다. OSMI 검증 및 보정을 위한 수중광학자료의 수집 및 분석방법에 대한 표준제안을 제시하고 이를 바탕으로 한반도 주변 해역의 수중광학관측자료를 분석하였다.
또한 표준 대기보정 알고리즘 개선에 필요한 현장조사 및 연구를 진행하였으며, 기존 CZCS, OCTS, SeaWiFS 데이터를 해양색 데이터 활용을 위해 분석하였으며, 연구 개발 목표를 달성하십시오. . 대기보정 알고리즘의 수정 및 개선 연구를 위해 안면도에서 현장조사를 진행하였고, 현장관측 자료를 바탕으로 한반도 표준대기의 대기특성과 황사의 발생 정도를 비교하였다. 황해의 엽록소 분포 관측과 유사하게 동해의 엽록소 분포 관측은 CZCS, OCTS, SeaWiFS 해색 데이터를 분석하여 제시하였다.
본 연구에서 얻은 실제 측정 데이터는 Case-2 및 Standby 알고리즘 개발에 사용된다.
Objectives and significance
Contents and scope
These activities were carried out over three years by a phased approach as follows. In the first year, studies were done to select a minimum set of observation elements for the Cal/Val of OSMI. Optical measurements in the water and biochemical analyzes on water samples were carried out in the Yellow Sea.
The optical properties of the Yellow Sea were characterized by the Yellow Sea was studied by comparing CZCS and OCTS data. This was used as an input to the radiative transfer done (MODTRAN) to simulate the irradiances in each OSMI band. The field studies were done in the Eastern Sea, which has very different optical properties from the Yellow Sea.
SeaWiFS data with the same bands as OSMI were analyzed for possible applications in.
Results
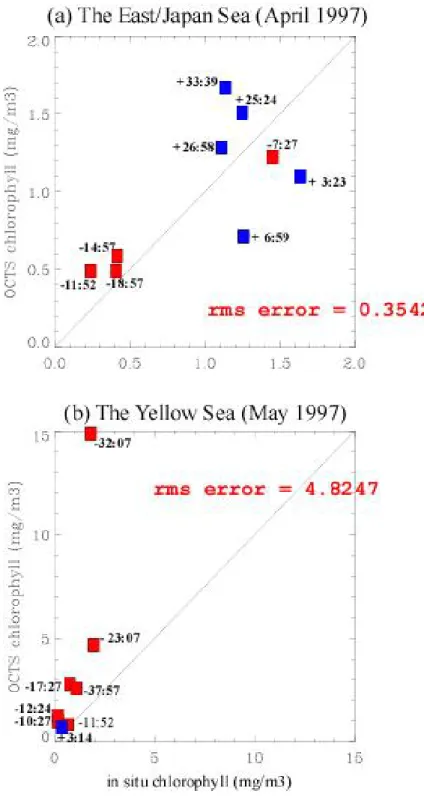
The data from the surveys were used in the evaluation of the SeaWiFS algorithm for atmospheric correction. The in-situ data will be used in the future to develop a Geelsand model. Applications are illustrated by analyzing CZCS, OCTS and SeWiFS data in the Korean waters as follows;.
The high concentration of suspended sediment in the Yellow Sea results in an overestimation of the applied chlorophyll concentration. The distribution of chlorophyll and SST was compared in frontal areas. The analysis will be useful in climate change studies. A very high amount of suspended sediment is present in the Changjiang Estuary region, Gyung-Gi Bay and Mogpo region.
A suspended sediment algorithm is proposed based on the Gyung-Gi Bay bio-optical data.
Future utilization of the results
CONTENTS
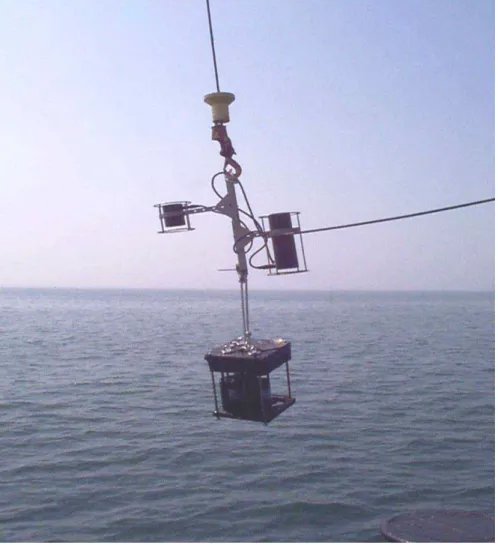
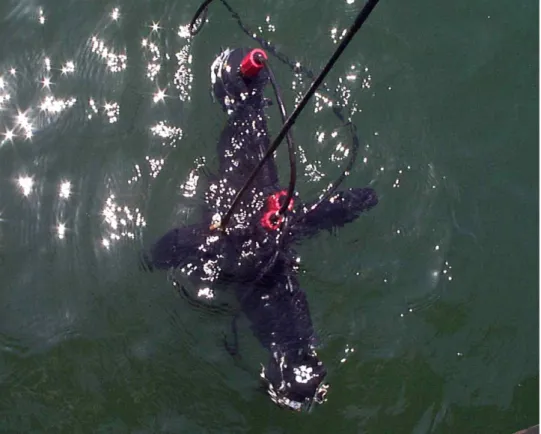
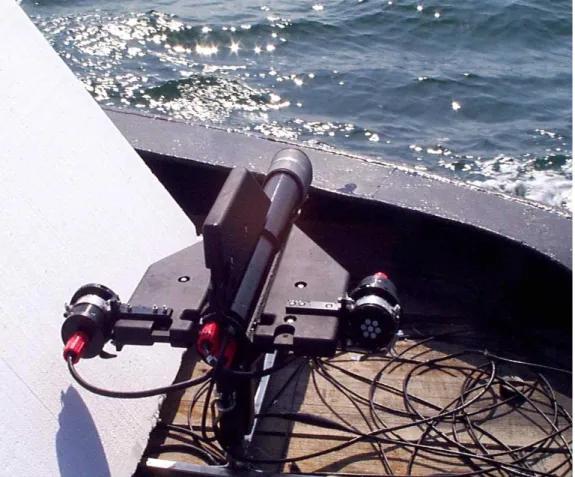
- OCP (Satlantic Co.)
- SBE 25 CTD
- SBE 25 CTD
- MER 204X
- PRR 600
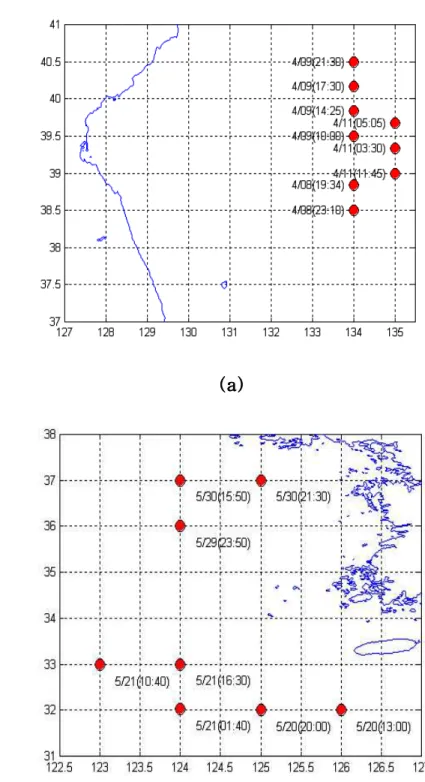
- 자료 및 방법
- 동아시아 표준대기의 특징
본 연구에 사용된 SeaWiFS 데이터는 한국해양연구원 HRPT 스테이션에서 받은 raw data를 TeraScan 소프트웨어에서 레벨 0으로 변환한 후 레벨 1로 변환하였다. 2단계에서는 엽록소 농도를 계산하였다. 1) CZCS 데이터를 이용한 이미지 분석. 본 연구에서는 알고리즘 버전 3으로 처리한 OCTS 레벨 2 데이터를 NASDA에서 제공받아 1997년 5월 현장 조사에서 관찰된 엽록소 농도와 비교하였다. ⑦ 그림자 피하기: 수중 광학관측에서 가장 중요한 현장 관찰 기술이다.
따라서 케이블을 표층으로 낮추어 장치의 조정시간을 포함하여 5~10분 이상 일정 수심에 있으면서 데이터를 수집한 후 수심에 따라 천천히 광 데이터를 획득한다. ③ 깔때기에 충분한 양(200ml 이상)의 증류수를 깔때기 벽에 부어 베이스가 완전히 제거되도록 한다. .따라서 다시 증류수로 여과하여 염분을 충분히 제거하되 이때 증류수를 여과지에 직접 뿌리지 않도록 주의한다. ④ 냉동보관하여 실험실로 가지고 오십시오(부유물질에는 유기성분을 포함한 엽록소와 식물성 플랑크톤 폐기물이 포함되어 있어 상온에서 지속적인 반응으로 중량변화가 있으므로 냉동보관 하십시오).
이를 보완하기 위해 청정해역에서 채취한 해수를 여과하여 용존유기물흡수량을 측정하는 표준시액으로 사용한다. ③ 질소탱크에 급속냉각 보관(시료를 하나의 정점에 여러 겹 처리할 경우 냉동고에 한 개씩 잠시 보관했다가 한 번에 모두 질소탱크에 넣는다.) 일반적으로 시료는 바다에서 제자리
⑥ 분광광도계에서 같은 방법으로 다시 흡광도를 측정한다. 동해와 황해에서 획득한 OCTS 위성자료와 현장관측을 분석한 비교 결과는 OSMI 검증 및 보정을 위한 다음과 같은 연구 결과를 제시한다. 도 4-9는 표층의 엽록소 농도와 동일한 공간분포를 나타낸다.
4-12는 표층의 현장에서 관찰된 부유사 농도의 공간적 분포를 보여준다. 부유 퇴적물은 수층에서 빛의 흡수 및 산란 특성으로 인해 위성 데이터를 기반으로 엽록소를 계산하는 알고리즘에 영향을 미칩니다. 2에서 분석한 생체광학적 파라미터를 추출하여 각 피크에서 얻은 수중광학적 데이터를 분석하였다.
각 지점에서 관찰한 결과를 바탕으로 현장에서 얻은 생체광학 데이터와 수중광학측정장비(OCP)에서 얻은 결과를 비교하여 2. 검증 및 보정을 위한 생체광학 데이터 분석에 제시하였다. 본 절에서는 먼저 동해 관측자료를 바탕으로 각 연구지점의 수층구조를 분석하였다.
Temperature
Water Vapor
Ozone