Overall, this thesis/dissertation describes three approaches to improve the performance of pathway and/or network analysis of transcriptomic and genomic data. Next, a powerful competitive gene cluster analysis tool for summary GWAS data, called GSA-SNP2, will be introduced.
Introduction
- Omics data
- Genomic data
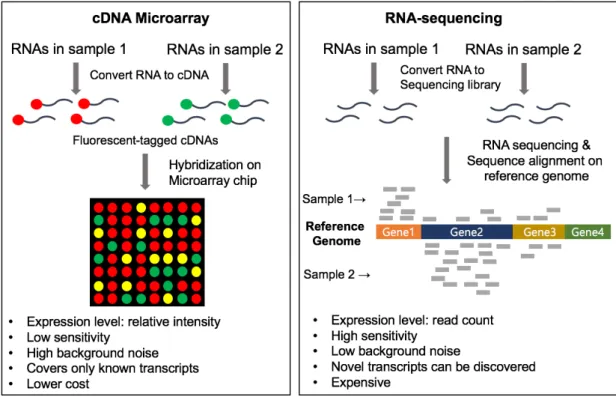
- Transcriptomic data
- Pathway analysis
- Pathway databases
- Pathway analysis methods
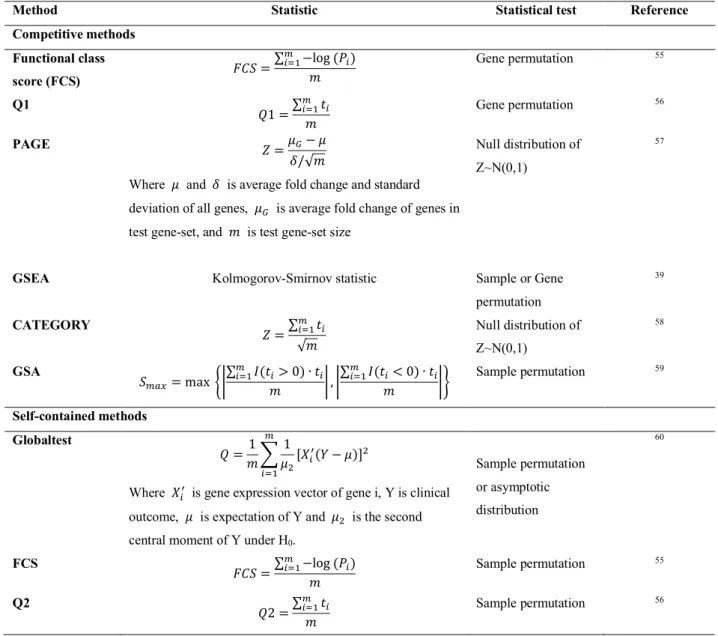
- Competitive and self-contained gene-set analysis
- Biological network
- Research overview
The pathway analysis is classified into three types based on the gene set scoring method as follows. First, most gene expression data analysis methods were designed for microarray.
Improving gene-set enrichment analysis of RNA-seq data with small replicates
- Abstract
- Introduction
- Materials and Methods
- Absolute gene-permuting GSEA and filtering
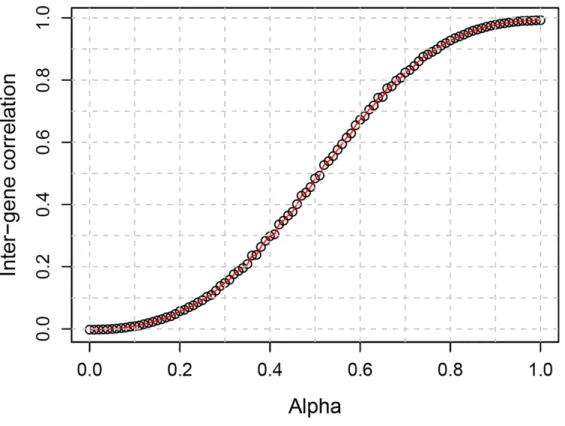
- Simulation of the read count data with the inter-gene correlation
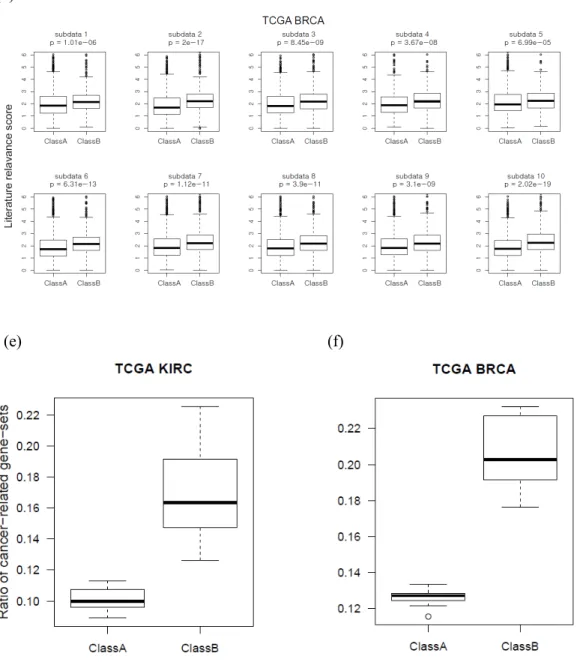
- Biological relevance measure of a gene-set
- RNA-seq data handling and gene-set condition
- Gene-set size
- AbsfilterGSEA R package
- Results
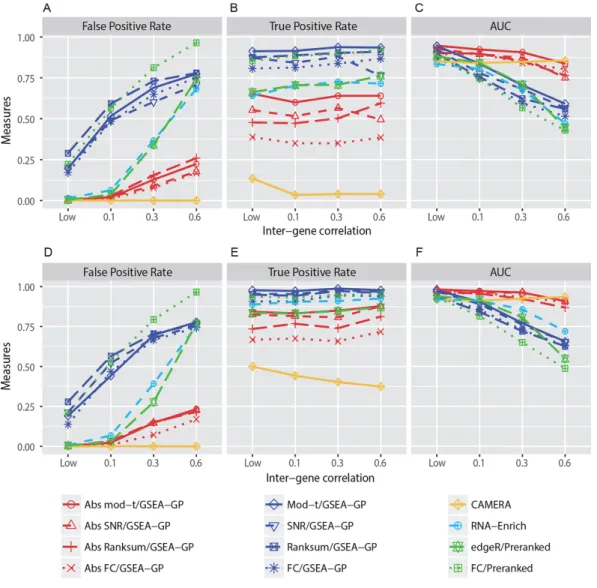
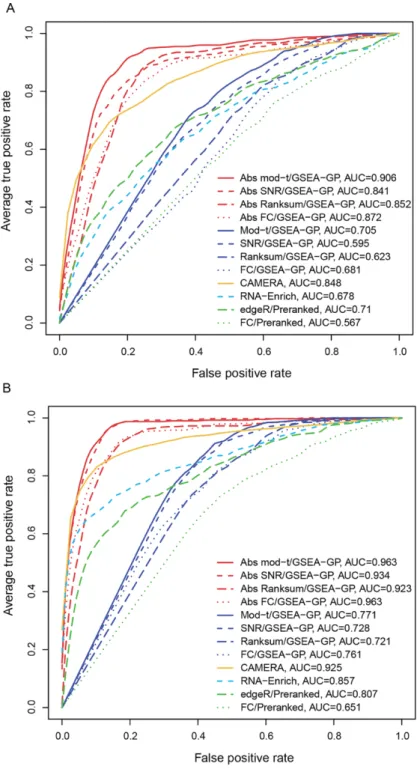
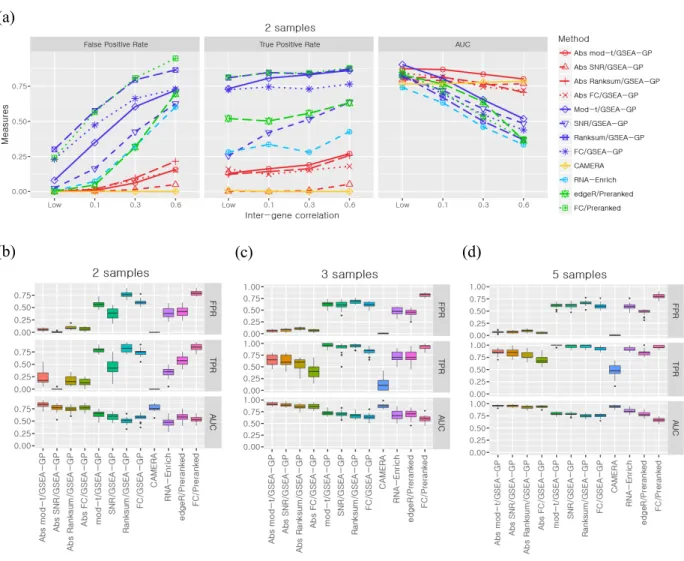
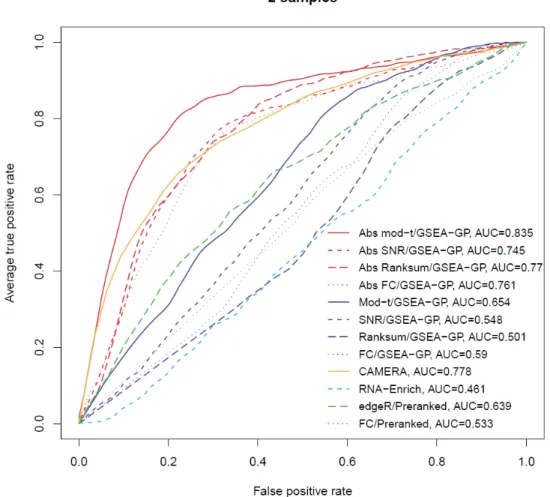
- Comparison of gene-permuting GSEA methods for simulated read count data
- Comparison of GSEA methods for RNA-seq data
- Effects of the absolute filtering on false positive control and biological relevance
- Discussion
- Supplementary information of Chapter II
However, GSEA-GP generates many false positive gene sets due to intergenic correlation in gene expression. Then, 20% of the gene sets (20 gene sets) in the above generated data were replaced with differentially expressed gene sets to compare the power (true positive rate) and overall discriminative abilities (ROC).
A powerful pathway enrichment and network analysis tool for GWAS summary
Abstract
Introduction
GSEA algorithms originally developed for pathway analysis of gene expression data, GSA-SNP 61 implemented a modified Z-test and two GSEA algorithms, Aligator 129 and Gowinda. Path-based methods of association analysis have then been developed in recent years for an independent null hypothesis. A new standalone C++ tool, GSA-SNP2, is presented here that accepts GWAS SNP p-values and performs powerful competitive pathway analysis as well as PPI network visualization in significant pathways.
Compared to the previous version61, GSA-SNP2 provides much improved type I error control by using the SNP count adjusted gene scores, while maintaining high statistical power. The performance of GSA-SNP2 was compared with that of six existing competitive pathway analysis methods and two recently developed standalone methods using simulated GWAS data and DIAGRAM consortium data (type II diabetes). Based on these results, the difference between the pathway analysis approaches for GWAS data, and the difference in gene correlation structures between GWAS and gene expression data and their effects on competitive pathway analysis were also discussed.
Materials and Methods
- Algorithm of GSA-SNP2
- Competitive pathway analysis tools
- Simulation study
Note that the removal of high-scoring genes is only for curve fitting and that they are all restored when calculating the fitted gene scores. In light of the random set model, the mean m does not depend on the attributes of the gene set, but the standard deviation σ* depends on the size of the gene set Ni. Some genes in the pathway are closely located on the genome or highly overlapping family genes, and some of them may belong to the same linkage disequilibrium (LD) block.
To prevent this possibility, the adjacent localized genes in a pathway are alternatively removed if they have high positive genotype correlations (>0.5) in the 1000 genome data. The gene effect of a gene g (TC) is defined as TC=(ãCa+ ⋯ + ãCÎ)/√— where ãCa, ⋯, ãCÎ are normalized additive genotypes of — causal SNPs in gene g. In this case, 100 background -SNPs randomly selected within the gene regions, and 10~40% of causal genes in a target pathway were randomly selected.
Results and Discussion
- Type I error rate simulation test
- Power simulation test
- Performance comparison using real data
- Comparison of competitive and self-contained pathway analysis results
- Comparison with the competitive pathway analysis for gene expression data
- Network visualization
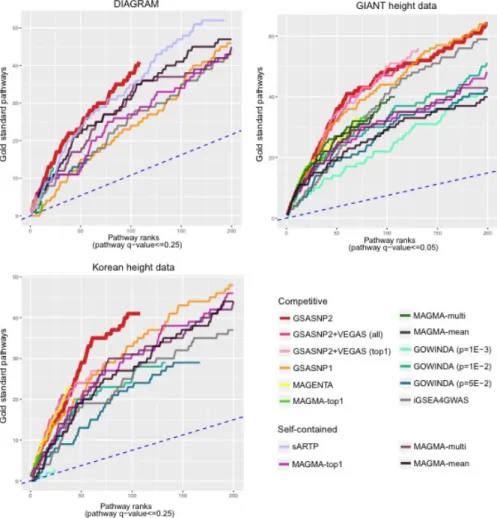
Of 183 significant pathways (FDR<0.01), 12 gold standard categories were found reported in the publications, such as skeletal system development and epigenetics138-139. Similar to the previous case, GSA-SNP2 exhibited the high power and the best gold standard pathway prioritization. In this case, the cumulative gold standard away counts were plotted to q-value <0.25 due to the reduced powers in overall methods.
Again, GSA-SNP2 showed high power and exceptional prioritization of gold standard pathways compared to other methods. For three public GWAS summary statistics data (DIAGRAM, GIANT height and Korean height data), the cumulative gold standard pathway count distribution of six competing and two independent pathway analysis methods were plotted. The blue dashed line indicates the expected distribution of the cumulative number of gold standard pathways.
Conclusion
Among them, TNF and RAB5A have been studied individually and both are known to regulate the insulin-responsive glucose transporter (GLUT a key protein that regulates the concentration of blood glucose by transporting it to muscle or fat cells. This has provided much denser interaction networks between the high score proteins than those for HIPPIE network, and the key T2D proteins TNF and PPARG were proposed as hub proteins Note that many of the interaction edges of STRING network were generated only from the literature that included GWAS papers, and need to be carefully analyzed becomes to avoid circular argument.
Supplementary information of Chapter III
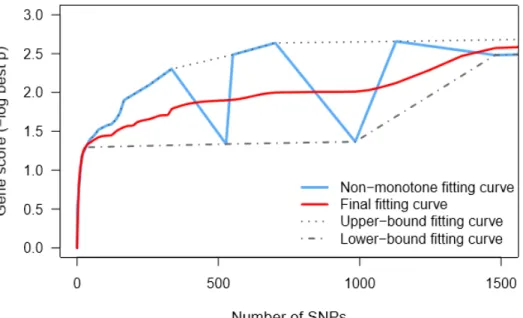
The result is that the new gupper breaks down to the level of the old gt'. With an assumption that gene scores tend to increase as the number of SNPs becomes larger, GSA-SNP2 uses the monotonic cubic spline interpolation to fit the binary data after excluding zero correlation region. To ease the situation, GSA-SNP2 proposes a dual cubic spline estimation method to automatically and adaptively estimate sparse binary data.
At each node, the average of the data inferred from the two curves is used as new data for the final cubic line estimate. Sample data instances (gk, nk) can be used as active nodes that feed into the bicubic estimation algorithm. The blue fitting curve, which is very fluctuating, is obtained when you directly apply the cubic line fitting to all data points (nodes) at the same time.
Biclustering analysis of transcriptome big data identifies condition-specific miRNA
Abstract
Introduction
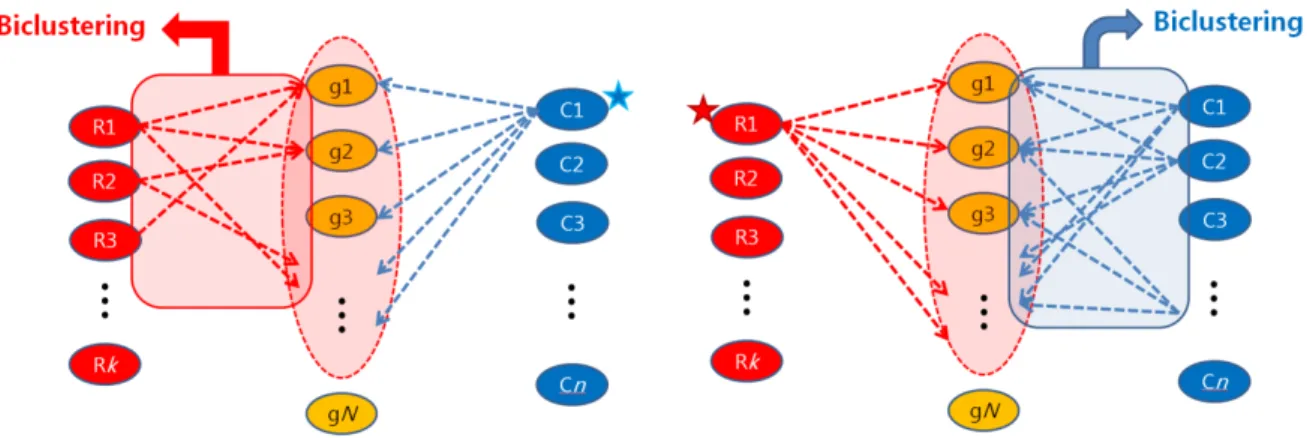
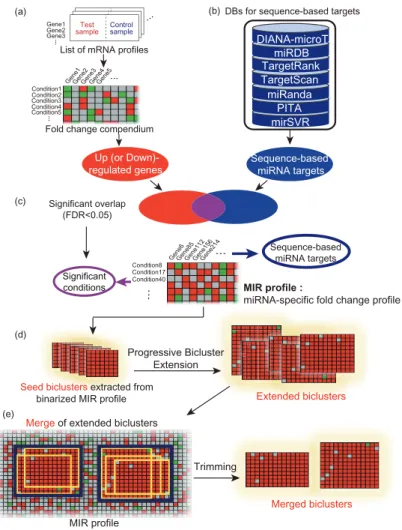
In this study, a novel approach was proposed to identify miRNA targets for a variety of cellular conditions by clustering a large collection of mRNA profiles to sequence-specific targets. For this purpose, I and three students (Hyeong Goo Kang, Jinhwan Kim, Seon-Young Hwang) collected 5,158 human microarray expression data sets with different test and control conditions from the Gene Expression Omnibus (GEO) database 188 and compiled the corresponding fold-change (FC) profiles representing 5,158 cell conditions. While the existing methods for miRNA regulatory modules biclustered miRNAs and mRNA targets under a given cell state (Figure 4.1a), another dimension that biclustered mRNA targets and cell conditions (i.e., FC profiles) for a given miRNA was interest, considered in this study (Figure 4.1b).
This approach is able to provide more reliable miRNA targets that are robustly regulated across different cellular conditions without using paired expression profiles. Typically, biclustering algorithms seek to identify a complete association (namely, biclique) between two sets of nodes (eg, set of target genes and set of cell conditions) 190-191. Furthermore, our predictions are available for 459 human miRNAs and a range of cellular conditions from our bicluster database, called BiMIR.
Materials and Methods
- Collection of expression fold-change data
- Sequence-specific miRNA targets
- miRNA target prediction using a Progressive Bicluster Extension (PBE) algorithm
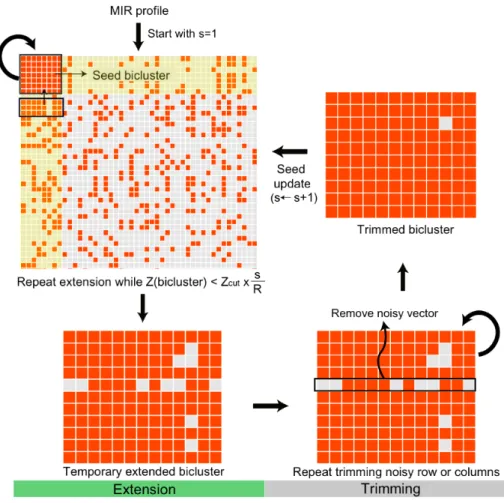
Then, LFC profiles are assigned to the background set based on the enrichment of up-regulated genes in the background set (hypergeometric test, FDR <5%). First, the bimax biclustering algorithm 191 is applied to the MIR profile to obtain a number of small biclusters completely filled with 1 (so-called seed biclusters). These biclusters are then 'progressively' extended using the PBE algorithm (extended biclusters, see the Progressive Bicluster Extension (PBE) algorithm in the supplementary information of Chapter IV, Figure S4.1); rows and columns with many ones are competitively added to the seed bicluster and then relatively noisy rows and columns are removed, and.
The expanded biclusters are then clustered using mean-linkage hierarchical clustering (pooled bicluster) to remove redundant results. Testing the three distance cutoffs (0.3, 0.5, and 0.7) for clustering, I found that the cutoff had almost no effect on the result, so the cutoff=0.5 was used. Up (down)-regulated biclusters imply the corresponding miRNA is down (up)-regulated in the captured test conditions.
Results
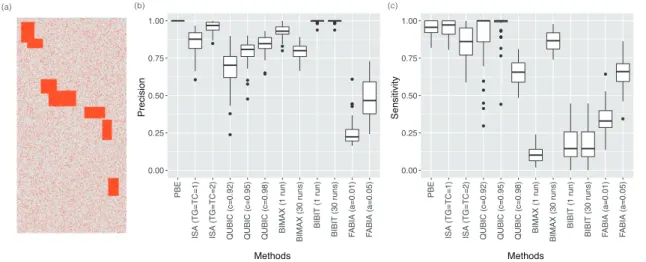
- Comparison with existing biclustering algorithms
- Accuracy of the biclustering target prediction
- Comparison with anticorrelation-based methods in cancer
- miRNAs targeting PI3K/Akt signaling in cancer
- BiMIR: a bicluster database for condition-specific miRNA targets
Therefore, I compared the biclustering method with seven anticorrelation-based methods (GenMiR++177, Pearson correlation, Spearman correlation, Lasso209-210, Elastic Net211, IDA212, and Tiresias213) in predicting cancer-specific miRNA targets. For the bicluster method, I merged the bicluster targets in order of the proportion of the specific cancer condition in each bicluster. For example, the true and false positive rates of bicluster targets in each pooling step were shown, while receiver operating characteristic (ROC) curves were shown for the anticorrelation-based methods (Figure 4.5).
Interestingly, in both cancer types, the bicluster targets were highly enriched in 'PI3K/Akt signaling pathway' (FDR = 1.3E-8 for breast cancer; FDR = 9.1E-8 for DLBCL). Figures 4.6a and S4.5a show the PI3K/Akt pathway highlighting the bicluster targets for breast cancer and DLBCL, respectively. Overall, by analyzing cancer biclusters, the key pathways (PI3K/Akt signaling, ECMs and focal adhesion) and five associated prognostic miRNAs (mir-29a, mir-29b and mir-29c in breast cancer; mir-34a and mir-145 in DLBCL) that suppress tumor progression (hazard ratios were identified.
Discussion
These mRNA fold-change data are different from the GTEx 221 transcriptome data in that the GTEx data represent transcript levels in normal tissues, whereas our fold-change data represent gene expression 'changes' for a variety of cellular conditions such as disease, chemical treatment, tissue and differentiation. Thus, these fold change data can also be used for clustering or regulatory network analysis for a specific set of genes or cellular conditions. While existing methods for identifying miRNA regulatory modules cluster multiple miRNAs and multiple target genes that represent co-regulatory networks, my current work is focused on prioritizing the most likely target genes of a single commonly detected miRNA in multiple cell conditions.
This approach can also be extended to address miRNA co-regulatory networks by overlaying biclusters for different miRNAs. I hope that this approach and data will contribute to unraveling the modular structure of complex regulatory networks.
Supplementary information of Chapter IV
The binarized biclusters showed higher density compared to that of continuous biclusters, but it was still sparser than that of PBE. All biclustering methods detected biclusters containing homogeneous ESC/iPSC vs. d) The densest ISA biclusters showed relatively small size (35 conditions and 37 targets with 95.6% density). It shows lower CpG methylation and higher gene expression level in pluripotent stem cell compared to somatic cell.
CDC25A NANOG regulates S-phase entry in human ES cells by directly binding two cell cycle genes CDK6 and CDC25A. IGF2BP1 IGF2BP1 is highly expressed in ES cells and plays an important role in the survival of human pluripotent stem cells. SERPINB9 Overexpressed in pooled human ES cells compared to huURNA 248, 274 SLC16A9 SLC16A9 is a downstream target of OCT4 and up-regulated in ES cells.
Discussion and conclusion
J.; Ferrer, A.; Conesa, A., Data quality-aware analysis of differential expression in RNA-seq with the NOISeq R/Bioc package. Y.; Wang, J., I-GSEA4GWAS v2: a web server for functional analysis of SNPs in trait-associated pathways identified from genome-wide association study. L.; Pachter, L., Differential gene and transcript expression analysis of RNA-seq experiments with TopHat and cufflinks (vol. 7, p. 562, 2012).
C.; Craddock, N., Gene ontology analysis of GWA study datasets provides insight into the biology of bipolar disorder. Bergmann, S.; Ihmels, J.; Barkai, N., Iterative signature algorithm for the analysis of large-scale gene expression data. M; Sharma, P.; Gupta, R.; Kumar, L.; Kulshreshtha, R.; Bhattacharya, A., Analysis of microRNA transcriptome by deep sequencing of peripheral blood small RNA libraries.