Metal-organic frameworks
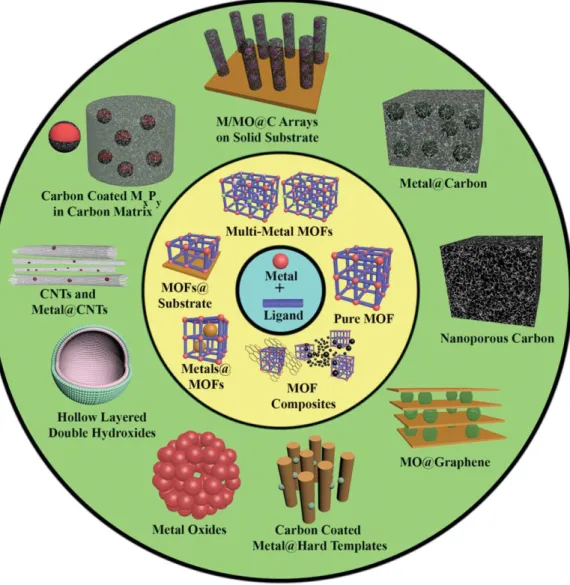
In the view of materials chemistry, MOFs composed of metal clusters and organic linkers are promising precursors for synthesizing metal/metal oxides, carbon and its hybrid materials. In recent decade, conversion reactions that transform MOF precursors into new materials have emerged as novel synthetic approaches.15-18 Furthermore, well-tailored nanomaterials derived from transformation of metal-organic frameworks have attracted attention due to widespread applications, including energy conversion and storage, 19 catalysis,20 gas sorption,21 and sensors.22.
Conversion of metal-organic frameworks
In this work, the use of a MOF as a template as well as a precursor followed by thermolysis in inert atmosphere has been investigated to synthesize well-tailored nanomaterials. MOFs possessing a high surface area and pore volumes enable access to a variety of molecules, including not only carbon precursors, but also metal complexes, 27 types of metal oxides,28 and polyoxometals.29 Introduction of foreign precursors into MOF followed by thermal decompositions enables us to control the content of carbon and metal-bound species. In fact, the MOF itself comprising inorganic moieties and organic coordinating ligands is fully qualified as a precursor for synthesizing metal/metal oxide and or carbon nanoporous materials.
Nanostructured materials via conversion of metal-organic frameworks
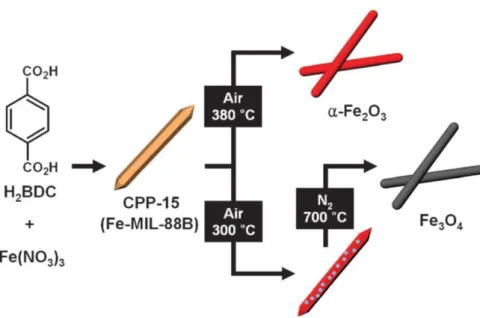
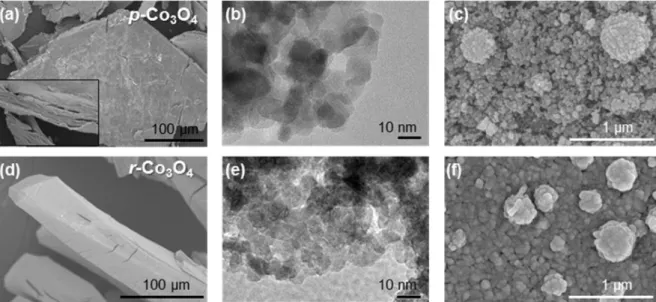
The effect of the calcination atmosphere can greatly influence the morphology of the resulting Co3O4 materials. The metal/metal oxide nanoparticles and carbon materials are complementary to each other and their combination can enable synergistic tunability and significant improvement of the potential functions of the resulting material.50,51 There are several reports regarding the synthesis of nanocomposites. Thus, after its pyrolysis under an inert atmosphere, the catalytically active Co3O4 nanoparticles were directly contacted with Cu foil, as shown in Figure 1.13.
Mechanisms of conversion of metal-organic frameworks
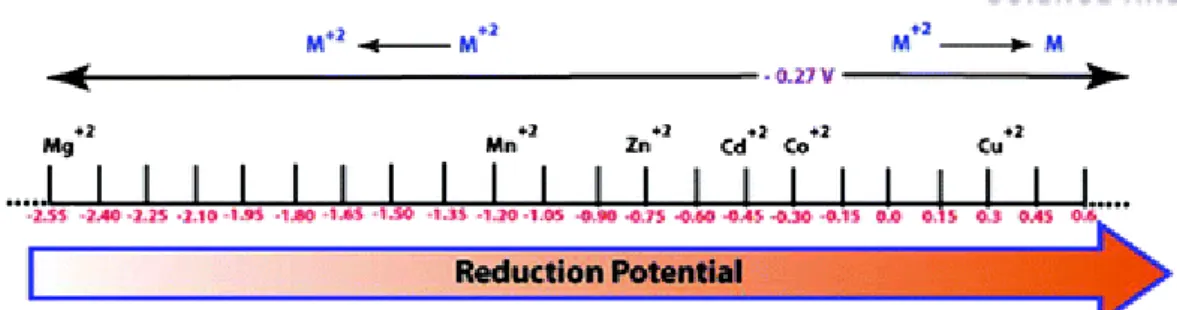
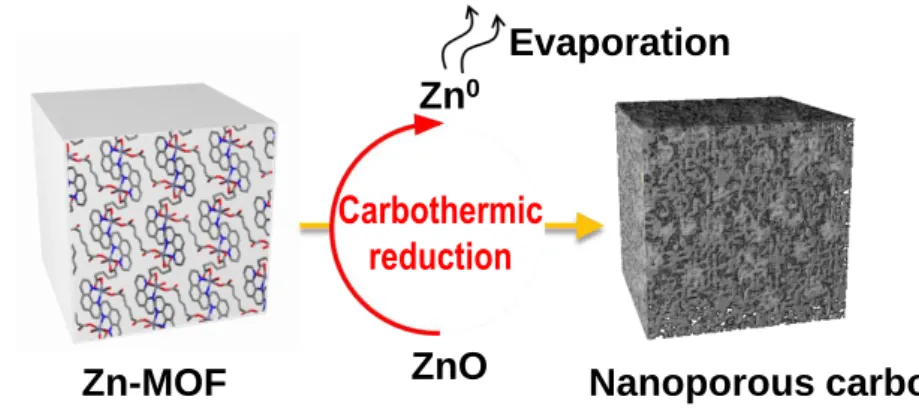
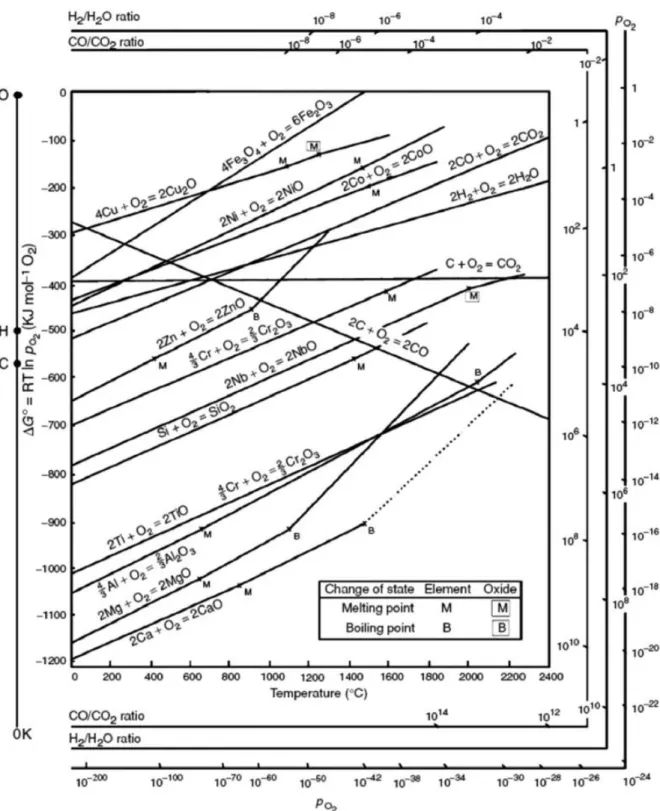
Along with the effect of the reduction potential of metal ions with MOF, the metal phase can be obtained from the reduction of carbon during thermal treatment, because carbon is an active reducing agent at high temperature. Thus, the competition of the Gibbs free energy (∆G) of the reactions between the reduction of the metal oxide and the oxidation of the carbon will be a critical factor in determining whether the carbothermic reduction will occur. The last parameter that governs the morphologies and particle sizes of metal or metal oxide nanoparticles as converted materials is the Tammann temperature of the metal species composed of the metal-organic framework, which is generally half the melting point of the metal itself.
Dissertation organization
Nanostructured metal oxides
Experimental section
Results and discussion
Conclusion
Three-dimensional mesoporous graphene
Experimental section
After cooling to room temperature, the solid product was collected by centrifugation at 7000 rpm and was washed several times with distilled water. The product was dried overnight in vacuo at room temperature to yield a black powder (3D mesoG, 0.99 g). For the mesoG/Ni composites obtained after the thermolysis of [Ni(EN)3](NO3)2, [Ni(adipate)], and [Ni(BDC)] were etched according to the following procedure to obtain pure 3D mesoG -materials to be obtained: 10 ml con.
The remaining solid was collected by centrifugation at 7000 rpm for 1 h, washed several times with distilled water, and finally dried in vacuo at room temperature overnight.
Results and discussion
From the amount of the resulting solid (NiO), the Ni content of mesoG/Ni was calculated to be 60.8 wt%. From the amount of the resulting solid (NiO), the Ni content of 3D mesoG was calculated to be 1.38 wt%. To identify the origin of the formation of the hollow shell and 3D graphene structure, variable temperature X-ray powder diffraction (VT-XRPD) experiments were performed during the treatment of [Ni2(EDTA)] (Figure 3.7a).
However, above 700 oC, some of the small nanoparticles started to aggregate to form larger Ni NPs (shown as red and blue dots, respectively), as deduced from the Debye-Scherrer equation with two deconvoluted reflection peaks ( 111). As the temperature increased, the shapes of the Ni NPs became more regular and crystalline and were smaller than 5 nm in diameter. Therefore, the size of the in situ Ni NPs dictates the inner diameter of the starved carbon.
In the TEM image of the solid treated at 700 oC (Figure 3.8), Ni NPs with diameters greater than 50 nm were observed in the presence of small Ni NPs with diameters of approx. This was due to the secondary agglomeration of the 4 nm Ni NPs that was initiated upon heating at temperatures above ~600 oC. Similarly, the surfaces of the large Ni NPs also act as catalysts to generate large carbon shells, as shown in Figure 3.2b.
To explore the structural and electronic properties of the 3D mesoG, Raman spectroscopy was performed (Figure 3.9a).
![Table 3.1 Elemental composition of [Ni 2 (EDTA)], mesoG/Ni, and 3D mesoG.](https://thumb-ap.123doks.com/thumbv2/123dokinfo/10524432.0/93.892.114.779.192.783/table-elemental-composition-ni-edta-mesog-ni-mesog.webp)
Conclusion
To evaluate the porosity of Ge/HPC-1, N2 adsorption-desorption measurement was performed (Figure 4.14d). During gas-phase CO oxidation, we found that Pd@ra-MOF transformed into mixed metal oxide-carbon composites (PdOx-NiOy/C). An HR-TEM image (Figure 4.20d, inset) clearly showed lattice edges of metallic Pd, indicating the single crystallinity of Pd NPs in Pd@ra-MOF.
To investigate the structural and compositional transformation of Pd@ra-MOF during a gas-phase CO oxidation reaction, the XRD patterns and TEM images of ra-MOF and as-synthesized Pd@ra-MOF were compared after the catalytic reactions (Figure 4.24 and 25). This was supported by XPS of ra-MOF, whose N content was determined to be almost zero after the CO oxidation reaction (Figure 4.26). Observation of the TEM image for Pd@ra-MOF before and after CO oxidation (Figure 4.25b) also revealed the formation of NiO and PdO NPs.
The NPs were well maintained after repeated CO oxidations, as shown in the TEM images (Figure 4.25b, right). Changes in the composition of Ni and Pd species in Pd@ra-MOF after the catalytic reaction were examined by XPS. Prior to the CO oxidation reaction, Pd@ra-MOF appropriately contained N-coordinated Ni(III) species (855.4 eV) as well as Ni(II) (854.7 eV), which were produced by the redox reaction with Pd(II ) ( Figure 4.27c).
However, after the CO oxidation reaction, Ni2O3 (855.9 eV) and NiO (854.1 eV) were generated by the thermal transformation of Ni(II/III) macrocycle molecules, similar to that of the as-prepared ra-MOF catalyst (Figure 4.27) d).
Metal/metal oxide-carbon composites
Experimental section
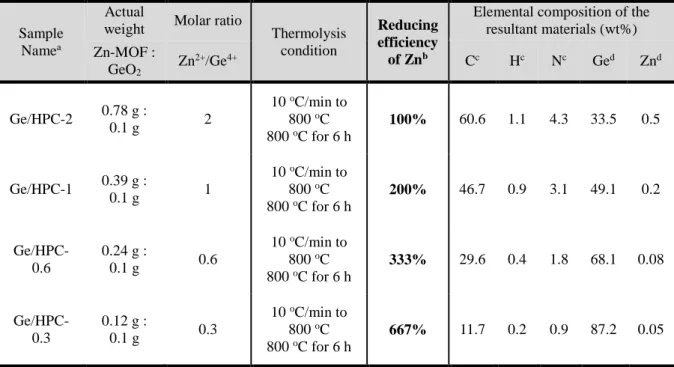
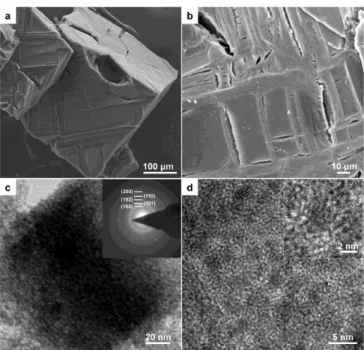
Raman spectroscopy measurement was performed using a micro-Raman system (WITec) with an excitation energy of 2.41 eV (532 nm). The chemical composition of Ge/HPC series was analyzed by inductively coupled plasma mass spectrometry (ICP-MS, Perkin Elmer, ELAN DRC-e). The morphologies of GeO2 and Ge/HPC-1 were characterized using field emission scanning electron microscopy (FESEM, Hitachi S-4800), performed at 10 kV.
Transmission electron microscopy (TEM) image and energy-dispersive X-ray spectroscopy (EDS) mapping were acquired on a JEOL JEM-2100 microscope. The specific surface area was determined in the relative pressure range of 0.05 to 0.3 of the Brunauer-Emmett-Teller (BET) plot, and the total pore volume was calculated from the amount adsorbed at a relative pressure of approximately 0.98-0 .99. After drying overnight under vacuum at room temperature, the white powder was dispersed in a MeOH/H2O mixture (200 mL, 1:1 v/v) with stirring.
The electrochemical properties of the Ge/HPC electrodes were evaluated using coin-type half-cells (2016R) at 25 oC. The Ge/HPC electrodes consisted of Ge active material, super-P carbon black, and poly(acrylic acid)/sodium carboxymethyl cellulose (1:1, w/w) as a binder in a weight ratio of 7:1.5:1.5. The mixture was stirred for 6 hours, forming pale purple microcrystals which were obtained by filtration, washed with methanol and dried in air.
The resulting light brown powder was isolated by filtration, washed with acetonitrile and dried in air.
Results and discussion
There are no specific peaks of metallic Pd in the XRD pattern of Pd@ra-MOF, indicating that small Pd NPs were too small to appear in the XRD pattern and were homogeneously distributed throughout the ra-MOF support. As determined by inductively coupled plasma (ICP) analysis, the loading amount of Pd metal in the ra-MOF was calculated to be 3.6 wt%. The catalytic properties of Pd@ra-MOF were investigated by using CO oxidation as a probe reaction, and the bare ra-MOF without Pd NPs was also tested for comparison.
Based on this result, we assumed the formation of new species from the Pd@ra-MOF material during the first run for the CO oxidation reaction. in Figure 4.23, three more reaction runs over Pd@ra-MOF gave the same results as the second run, indicating its long-term stability. The XRD pattern of the ra-MOF after the 5th run of the catalytic reactions (Figure 4.24a) was completely different from that of the immediately prepared ra-MOF (Figure 4.20a), which is characterized as a cubic phase of NiO (JCPDS 47). –1049). In general, the resulting material after the catalytic reaction for ra-MOF was a NiOx/C nanocomposite.
The NiO was obtained by the thermal transformation of ra-MOF (as explained above), and the PdO NPs were generated by the oxidation of metallic Pd NPs during the reaction. Before the Pd@ra-MOF underwent catalytic reaction, the small Pd0 clusters (337.7 eV), which strongly interacted with ligands of the ra-MOF scaffold, coexisted with unreduced Pd(NO3)2- species (338.3). eV) (Figure 4.27e). Interestingly, it should be noted that the binding energy of the latter was shifted to a lower energy level compared to that of Pd@ra-MOF before the catalytic reaction (Figure 4.27f) due to the larger size of the Pd NPs from ca.
The PdOx-NiOy/C catalyst after the fifth run showed a slightly higher BET surface area (35 m2/g) than that of Pd@ra-MOF.
![Figure 4.4 X-ray single crystal structures of a Zn-based MOF, [Zn(adipate)(phen)(H 2 O)] for (a) its 1- 1-D chain and (b) ac plane](https://thumb-ap.123doks.com/thumbv2/123dokinfo/10524432.0/128.892.217.755.138.406/figure-single-crystal-structures-based-adipate-chain-plane.webp)
Conclusion
A Two-Dimensional Redox-Active Coordination Polymer: Preparation of Silver and Gold Nanoparticles and Crystal Dynamics in Guest Removal. Flexible and redox-active coordination polymer: Control of network structure by pendant arms of a macrocyclic complex. Metallic Pd nanoparticles formed by Pd–O–Ce interaction: A rationale for sintering-induced activation for CO oxidation.
Gold catalysts prepared by coprecipitation for the low-temperature oxidation of hydrogen and carbon monoxide. CO oxidation catalyzed by supported gold: cooperation between gold and nanocrystalline rare earths forms reactive surface superoxide and peroxide species. Facile synthesis and characterization of nanostructured transition metal-ceria solid solutions (TMxCe1-xO2-δ, TM = Mn, Ni, Co or Fe) for CO oxidation.
An in-situ generated metal oxide catalyst during the CO oxidation reaction converted from palladium nanoparticles supported by a redox-active metal–organic framework.
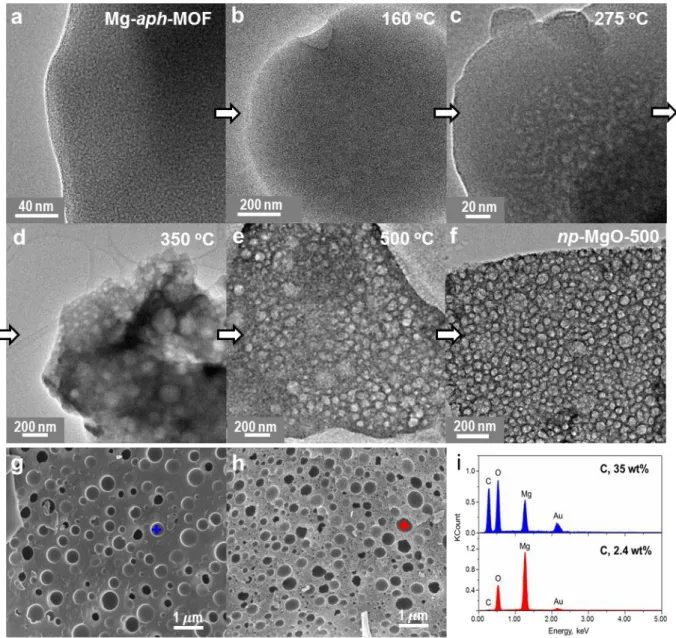
![Figure 2.24 TEM images of MgO, which were prepared by thermolysis of Mg-ar-MOF, [Mg 3 (bpdc) 3 (DMA) 4 ]](https://thumb-ap.123doks.com/thumbv2/123dokinfo/10524432.0/72.892.166.728.124.403/figure-tem-images-mgo-prepared-thermolysis-mof-bpdc.webp)
