प्रशांत मिश्रा, हरि उप्पारा, बिष्णुपद मंडल और ससिधर गुम्मा, MIL-53(Al) मेटल ऑर्गेनिक फ्रेमवर्क का उपयोग करके कार्बन डाइऑक्साइड का अवशोषण और पृथक्करण, इंडस्ट्रीज़। प्रशांत मिश्रा, हरि उप्पारा, बिष्णुपद मंडल और शशिधर गुम्मा, जिंक-आधारित धातु-कार्बनिक फ्रेमवर्क पर निचले अल्केन्स का अवशोषण, जे।
CONTENTS
STRUCTURAL TUNING OF FLEXIBLE MIL-53(Al) MOF
ADSORPTION CHARACTERISTICS OF
ADSORPTION CHARACTERISTICS OF
LIST OF TABLESLIST OF TABLESLIST OF TABLES
Mw Molecular weight of gas, g mol-1 n Number of metal atoms in a unit cell.
CHAPTER CHAPTER
INTRODUCTION
- Adsorption
- Types of Adsorption
- Adsorbents of Industrial Importance
- Important Factors to be Considered in Adsorbent Selection
- Novel Adsorbents
- Overview on CO 2 Emissions
- Different Pathways of CO 2 Separation
It is of great interest to study. the adsorption properties of microporous materials due to their potential for adsorptive storage, separations and catalysis applications. In addition, the adsorption properties also depend on the structural configuration (ie, the phase) of the flexible adsorbents.
LITERATURE SURVEY
Metal Organic Frameworks (MOFs)
- Design and Synthesis of MOFs
- Structural Transformation in MOFs
In many cases, it is impossible to control the formation of inorganic clusters during synthesis of MOFs [73]. reported the structural transformation of MIL-53 materials after adsorption of CO2 and H2O at room temperature.
Adsorption of Different Gases
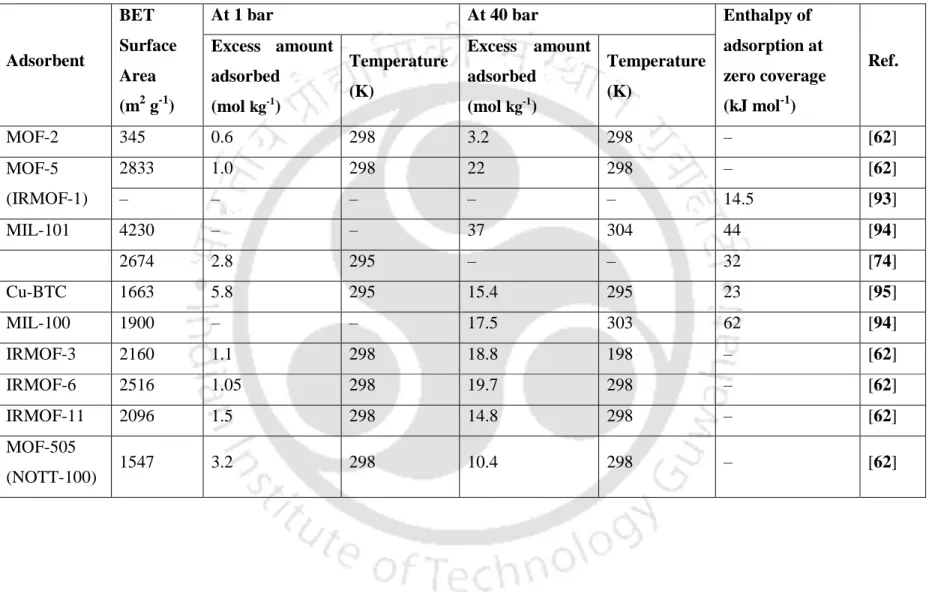
Some moderate surface area MOFs (M/DOBDC, Cu-BTC, etc.) exhibit high CO2 uptake at ambient conditions. In addition, these MOFs have also shown an unusually high volumetric loading for CH4 at ambient temperature, but gravimetric saturation uptakes of CH4 at ambient temperature on these MOFs would not be as high as on high surface area MOFs such as MOF-177, MOF- 200, MOF-205, MOF-210 etc.
Potential Applications of MOFs
- Gas Storage
67] tested MOF-177, Co(BDP), Cu-BTTri and Mg/DOBDC for hydrogen purification and CO2 capture before combustion. 159] compared the performance of UTSA-16 with that of Mg/DOBDC and many more adsorbents for the separation of CO2/CH4 and CO2/N2. However, after exposure of both adsorbents to moisture, the performance of Mg/DOBDC decreases.
Modification of MOF Structure
- Generation of Coordinatively Unsaturated Metal Sites in MOFs
If some of these positions can be "opened", the material will have coordinatively unsaturated (cus) metal sites. MIL-101 is one of the first synthesized MOFs known to have metal sites [52]. The sixth place is occupied by a molecule of water (solvent), which can be removed by heat treatment (at a higher temperature) under vacuum, as a result of which the metal sites in the framework become unsaturated.
Structural Properties of MOFs
71] performed the numerical simulations to obtain the adsorption isotherms of CO, CH4, N2 and H2 on Cu-BTC. They observed slightly higher CO2 absorption in Cu-BTC (MOF with moderate pore size and cus metal sites) than in Zn/DABCO (MOF with smaller pore size and no cus metal sites) at pressure low and ambient temperature. 95] compared the adsorption characteristics of Cu-BTC (moderate pore size and small exposed metal sites) and MIL-101 (larger pore size and exposed red metal sites).
Simulation Studies on MOFs
Stability of MOFs
Later, Walton and co-workers [189] improved the stability of Zn2(BDC)2(Dabco) for water exposure at up to 90% relative humidity by proper functionalization of the BDC ligand. In most studies, the performance of MOFs is evaluated and compared with other adsorbents. A limited amount of work is being done systematically investigating the adsorption properties of these materials and relating it to the physical properties of the adsorbate/adsorbent pair.
THEORY
Phase Rule for Adsorption
Equilibrium Adsorption Isotherm
Henry’s Constant
Models for Pure Gas Isotherms
- Langmuir Isotherm
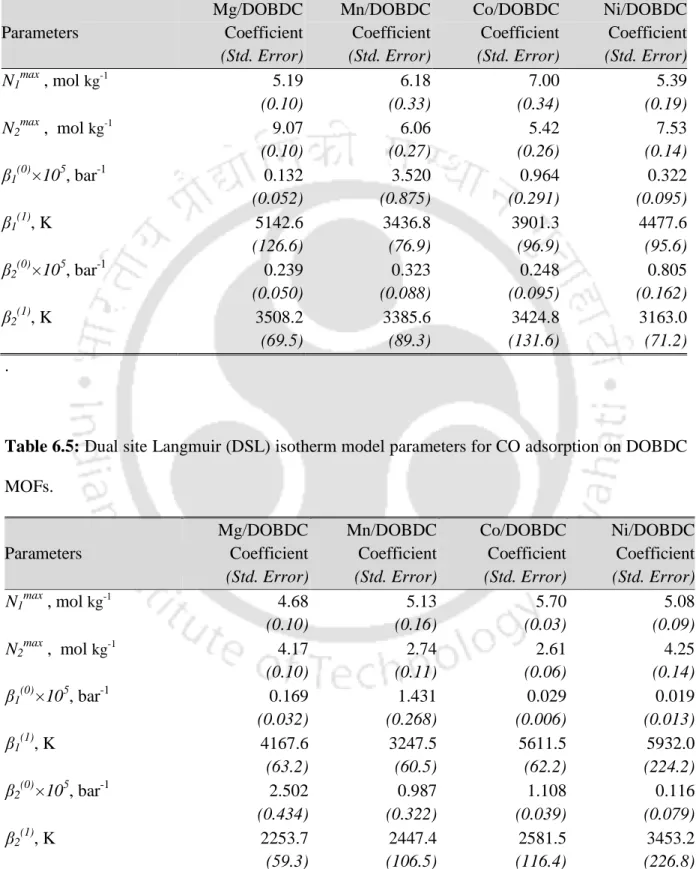
- Dual Site Langmuir (DSL) Isotherm
- Langmuir-virial Isotherm
The intersection [-ln(β)] of the virial domain plot can be directly used to obtain Henry's constant (β). Any step or bend in the virial domain plot indicates the heterogeneity of the adsorbent. Langmuir and virial models are thus combined in a Langmuir-virial model [193] (Eq. 3.13) to overcome the limitations in both cases.
Enthalpy of Adsorption
Spreading Pressure
Ideal Adsorbed Solution Theory (IAST)
With these phase equilibrium relations together with an equation for the total amount adsorbed (N), one can predict binary gas adsorption equilibria (i.e. finding a partial amount of adsorbed Ni for a given gas mixture of mole fraction yi at T and P) [198] .
Synthesis of MOFs Studied .1 Synthesis of MIL-53(Al)
- Synthesis of Mg/DOBDC
- Synthesis of Mn/DOBDC
- Synthesis of Co/DOBDC
- Synthesis of Ni/DOBDC
- Synthesis of Ni/DABCO
- Synthesis of Cu/DABCO
- Synthesis of Zn/DABCO
Samples were then cooled to room temperature followed by decantation of mother liquor from the yellowish crystals. Samples were then cooled to room temperature followed by decantation of the mother liquor from the brownish crystals. Sample was then cooled to room temperature, followed by decantation of the mother liquor from the violet crystals.
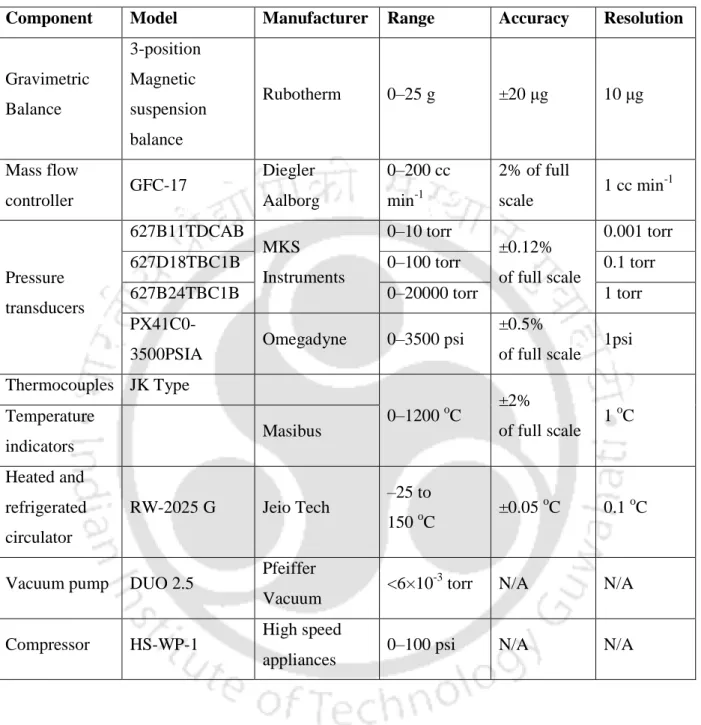
Characterization of MOFs Synthesized
- Calculation of Amount Adsorbed
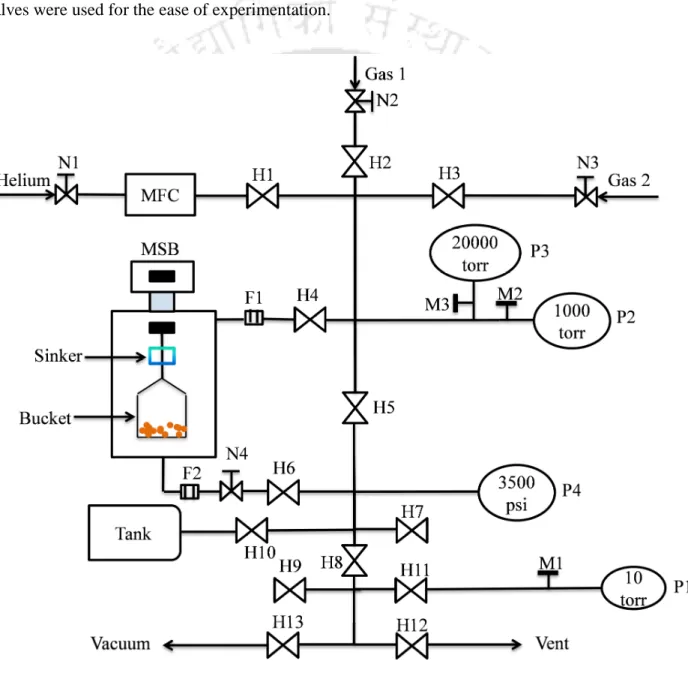
In addition to the aforementioned instruments, Swagelok fittings and stainless steel tubing (of 1/4" and 1/8") were used to connect the various sections in the experimental setup. Subsequent measurements for the isotherm were obtained by increasing the pressure in incremental doses. The impermeable solid volume of the drift-corrected adsorbent was obtained from helium measurements at 293 K in the pressure range of 0 - 26 bar, using the assumption of non-adsorbing helium.
Different Types of Amount Adsorbed
- Determination of Buoyancy Volume for Various Reference States
The gas molecules exist in the non-shaded "available" volume of the tank at the same conditions (temperature and pressure) as those in Figure 4.2 (a). The gas molecules exist in the total volume of the tank at the same conditions (temperature and pressure) as those in Figure 4.2 (a). Furthermore, the density of molecules in the tank at the reference state is the same as that of the mass density in case (a).
![Figure 4.2: (a) Equilibrium between Adsorbate and Adsorbent; (b) Reference state for Absolute Adsorption; (c) Reference state for Excess Adsorption; (d) Reference state for net Adsorption Framework [196]](https://thumb-ap.123doks.com/thumbv2/azpdfnet/10495963.0/103.892.185.710.232.540/equilibrium-adsorbate-adsorbent-reference-adsorption-reference-adsorption-adsorption.webp)
Conversion of Units
Thus, the absolute amount adsorbed at a given condition is the amount of gas present in the solid adsorbent, including that in the "pores". Nv =Nρc 4.12 where, Nv (mol L-1) is volumetric amount adsorbed, N is amount adsorbed in mol kg-1 and ρc (g cm-3) is crystal density of the adsorbent. In reality, the experimentally obtained value of volumetric uptake is lower than that obtained by Eq.
Experimental Conditions
Purity of Gases
Physical Properties of Gases Used
STRUCTURAL TUNING OF FLEXIBLE MIL-53(Al) MOF
Background
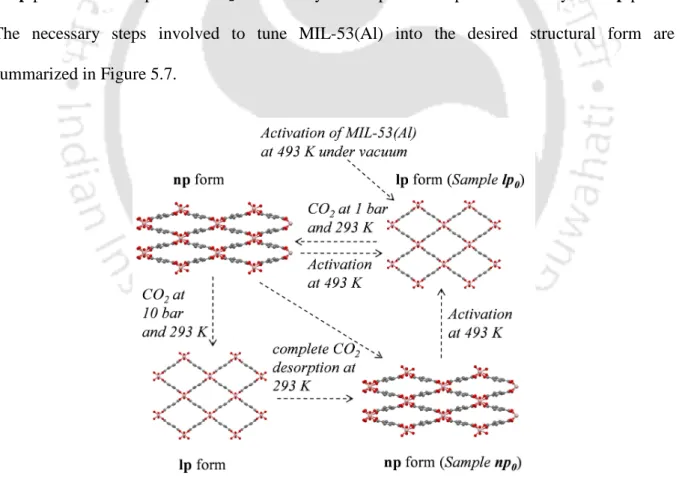
In their work on CO2 and CH4 cosorption measurements in MIL-53(Al), Ortiz et al. However, compared to the MIL-53 base material, the CO2 adsorption capacity of the hydrated form decreased significantly [170]. This chapter presents a technique to tune the structure of MIL-53(Al) into its np domain at subatmospheric pressure to significantly increase both CO2 capacity and selectivity.
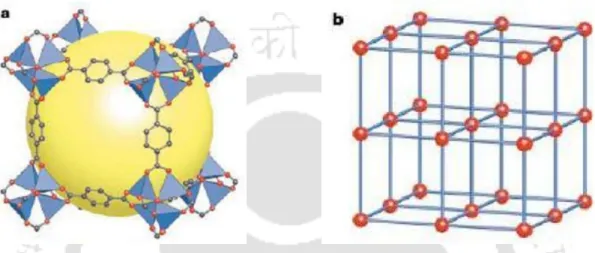
![Figure 5.1: Crystal structure of MIL-53(Al) (a) in lp domain (sample lp 0 ) and (b) in np domain (sample np 0 ) (O, red; C, grey; Al, pink) [41]](https://thumb-ap.123doks.com/thumbv2/azpdfnet/10495963.0/110.892.103.788.471.849/figure-crystal-structure-mil-domain-sample-domain-sample.webp)
Characterization of MIL-53(Al)
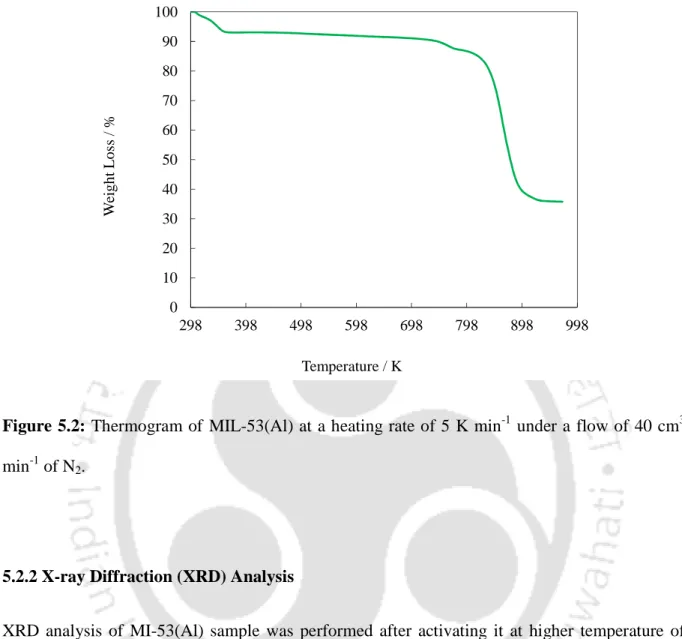
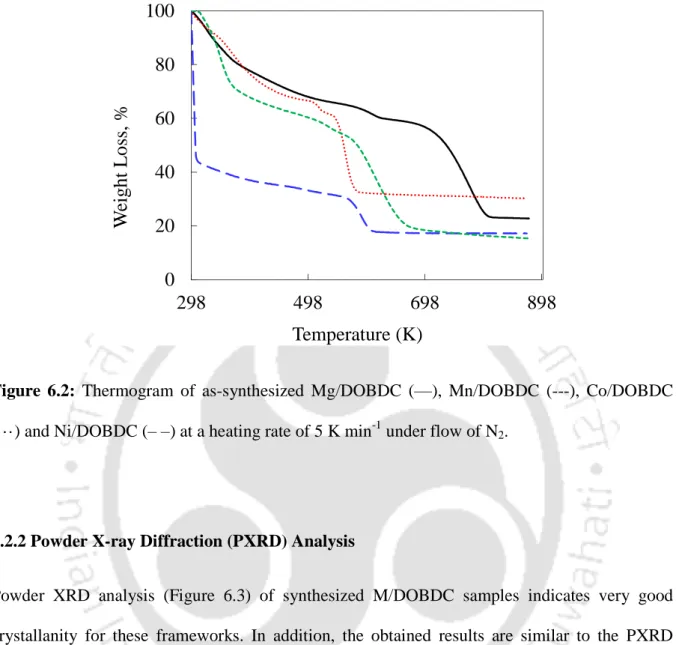
- Thermogravimetric Analysis (TGA)
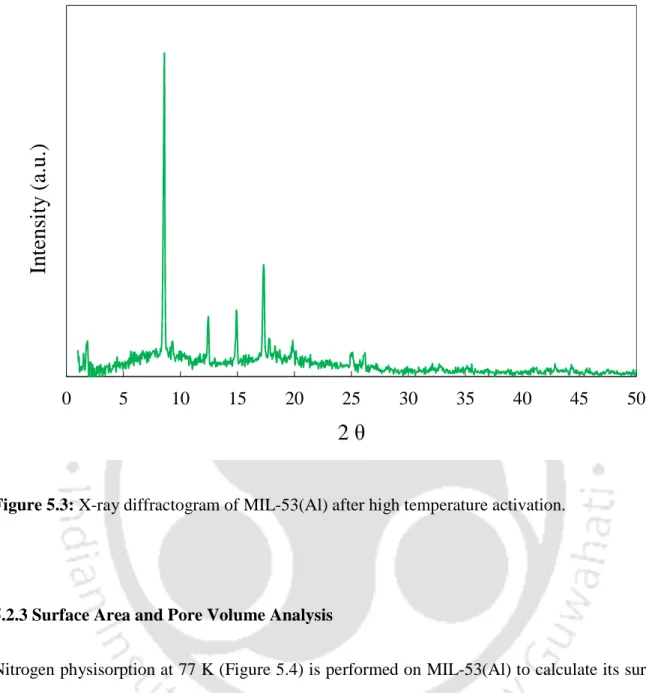
- X-ray Diffraction (XRD) Analysis
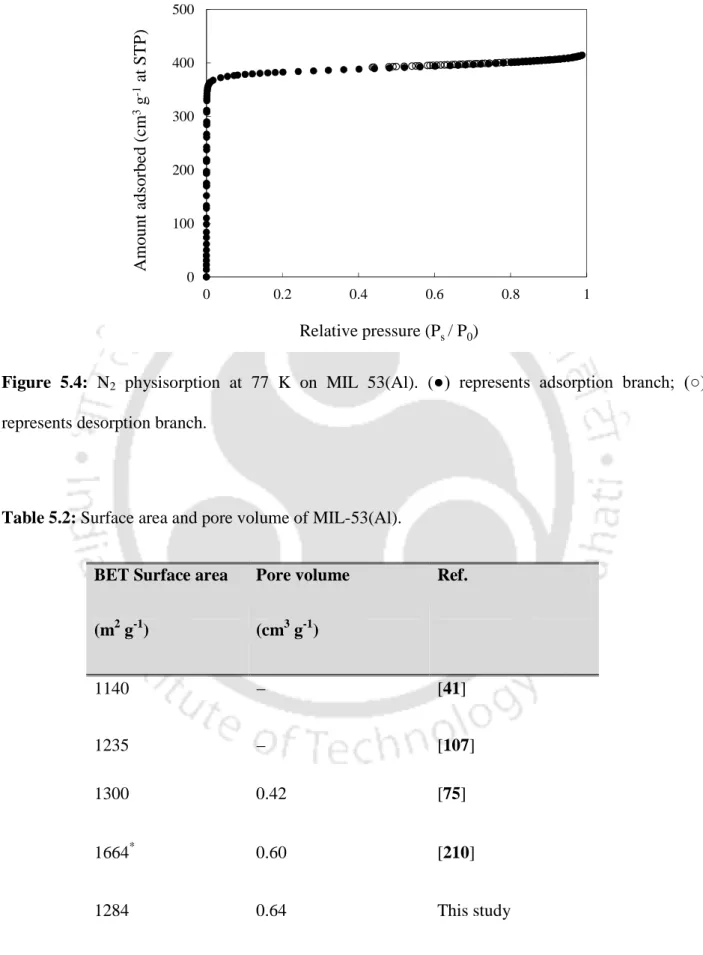
- Surface Area and Pore Volume Analysis
XRD analysis of the MI-53(Al) sample was carried out after its activation at a higher temperature of 493 K. The obtained Al) compound. Nitrogen physisorption at 77 K (Figure 5.4) is performed on MIL-53(Al) to calculate its surface area and pore volume.
CO 2 Isotherms of MIL-53(Al)
Identification of Different Phases of MIL-53(Al)
During desorption, as the pressure decreases, the sample will undergo a transformation back to the np structure. As expected, the initial weight of the sample is recovered (matching well with that of the lp0 sample in vacuo). However, we observed that the XRD pattern (Figure 5.6c) of the sample is similar to that of the np structure reported in the literature [41].
Adsorption Characteristics of Different Phases
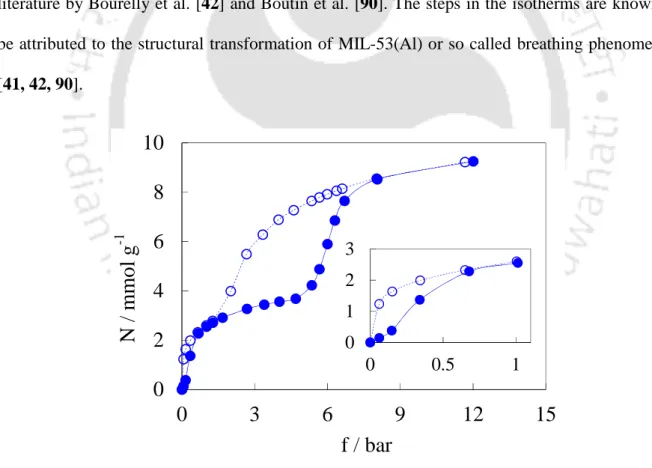
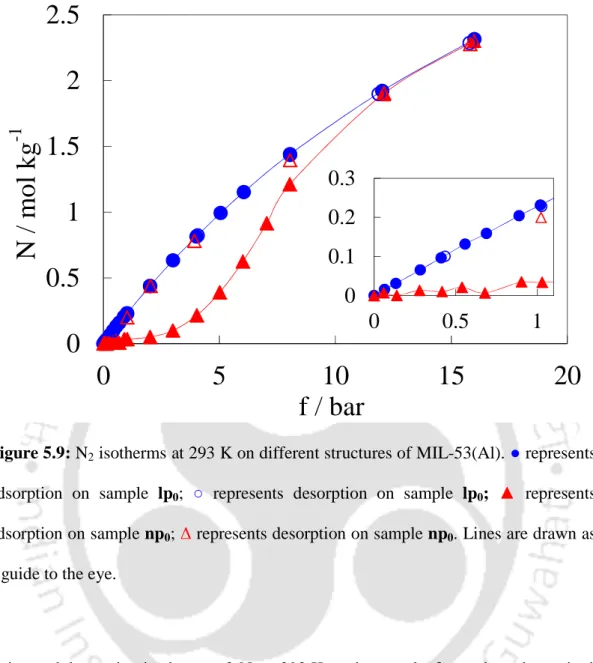
In addition, because the sample np0 is already in the np domain before adsorption, the first lp → np transition no longer occurs and the corresponding hysteresis disappears below 1 bar (closed and open triangles in Figure 5.8b overlap). At higher pressures, the increase in adsorption can be easily attributed to the np → lp transformation of the sample. The pressure range at which the transformation occurs thus appears to be related to the adsorption affinity of these gases on the sample.
Summary
ADSORPTION CHARACTERISTICS OF COORDINATIVELY UNSATURATED METAL SITES CONTAINING DOBDC MOFS
Background
These isostructural MOFs appear to be good candidates to study the effect of metal atom substitution (in the framework) on the adsorption properties; the presence of a large number of cus metal sites will pronounce the effect of metal atoms. It would be interesting to systematically investigate the effect of metal atom in the framework on adsorption of various gases with varying polarity over a wide range of temperature and pressure conditions. In addition, selectivities for various binary mixtures were also calculated using Ideal Adsorption Solution Theory (IAST) [198] to understand the effect of metal atom in the framework on this important thermodynamic property.
![Figure 6.1: Crystal structure of (a) Mg/DOBDC [169], (b) Co/DOBDC [166] and (c) Ni/DOBDC [167] MOFs (O, red; C, grey; Mg, yellow; Co, violet; Ni, sky blue)](https://thumb-ap.123doks.com/thumbv2/azpdfnet/10495963.0/132.892.107.767.451.1009/figure-crystal-structure-dobdc-dobdc-dobdc-yellow-violet.webp)
Characterization of Frameworks Synthesized
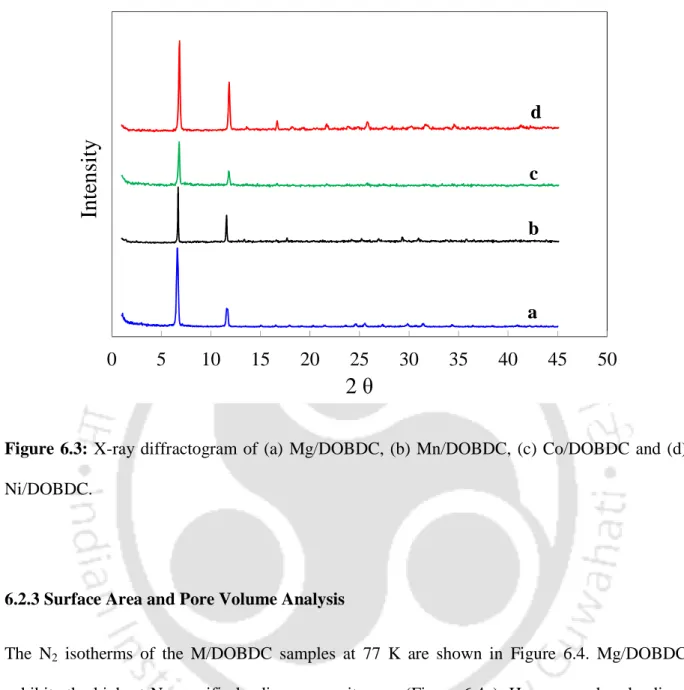
- Powder X-ray Diffraction (PXRD) Analysis
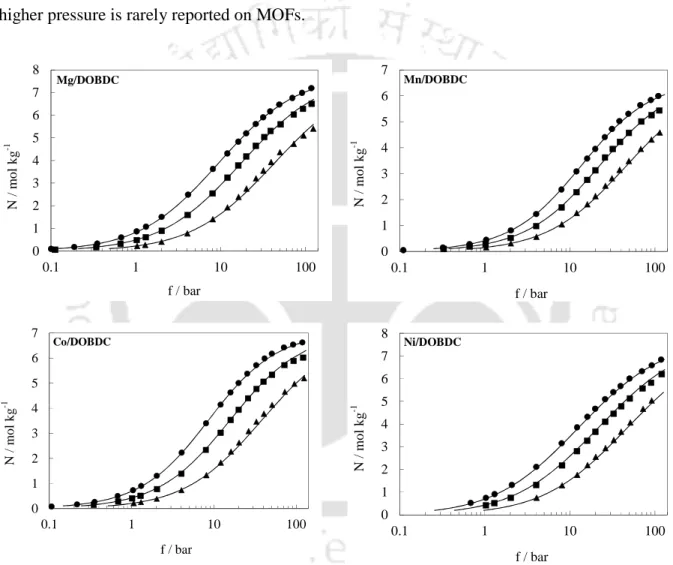
- Surface Area and Pore Volume Analysis
The N2 isotherms at 77 K were used to obtain surface area and pore volume for the frameworks. The surface area and pore volume of all the compounds are given in Table 6.3. It is interesting to note that both the surface area and pore volume of unit cells vary linearly with the 2nd ionization energy of metal atom in the framework (Figure 6.5).
Adsorption Isotherms
- CO 2 Isotherms
- CO Isotherms
- CH 4 Isotherms
- N 2 Isotherms
- C 2 H 6 Isotherms
- C 3 H 8 Isotherms
- Ar Isotherms
A virial domain plot is useful for analyzing the experimental data at low pressure, as mentioned in section 3.5.3. The graph of the viral domain of CO2 on Mg/DOBDC shows a clear bending at a load of ~8 mol kg-1, as shown in Figure 6.7. The virial domain plots of CO also show bending at a loading of approximately 6 - 7 mol kg-1, demonstrating heterogeneity for adsorption of CO on M/DOBDC frameworks.
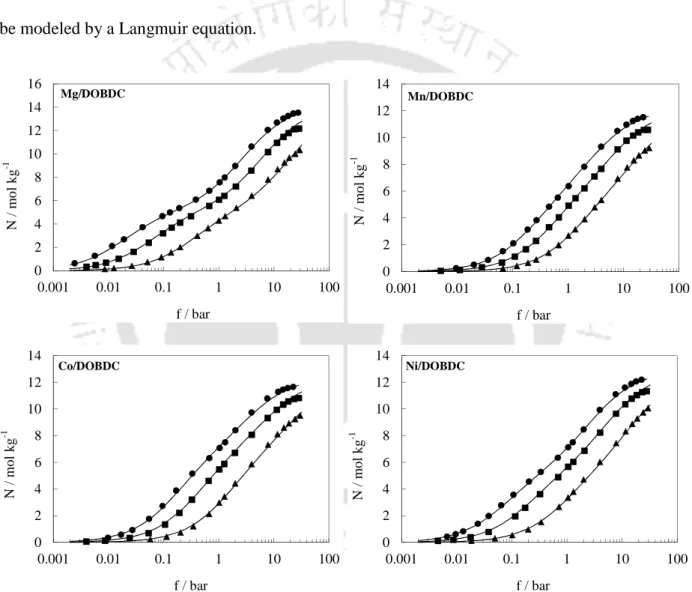
Isotherm Modeling
Second, the saturation uptake of a given gas increases with the increase in pore volume of the framework. For all gases, saturation uptake is highest on Ni/DOBDC followed by Co/DOBDC, Mn/DOBDC and Mg/DOBDC in that order. C3H8 deviates slightly from this order with a slightly higher saturation strain (~2.7%) for Co/DOBDC compared to Ni/DOBDC.
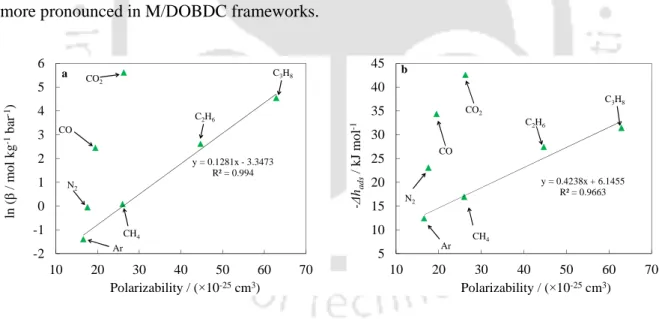
Effect of Physical Properties of the Adsorbate
- On Henry’s Constants and Adsorption Enthalpy
As already mentioned, the Henry's constant for CO2 is larger in Mg/DOBDC at all temperatures. At 352 K, the Henry's constant of C3H8 exceeded the Henry's constant of CO due to decreased electrostatic interactions between the cus metal face and CO molecules. With increasing temperature, the decrease in Henry's constant of polar gases (CO2 and CO) is more pronounced than that of non-polar gases (Ar, CH4).
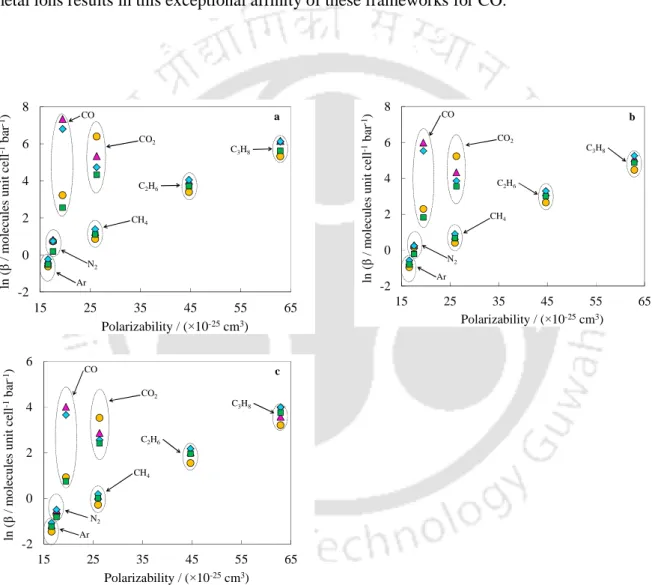
Effect of Metal Cation in the Framework
- On Henry’s Constants
- On Adsorption Isotherms at High Pressures
- On Enthalpy of adsorption
Pore volume / cell nm3 unit-1 b. b) Variation of Ar saturation uptake with pore volume of DOBDC MOFs. Pore volume / cell nm3 unit-1 b. b) Variation of C3H8 saturation uptake with pore volume of DOBDC MOFs. Pore volume / nm3 per unit cell-1 b. b) Variation of CO2 saturation uptake with pore volume of DOBDC MOFs.
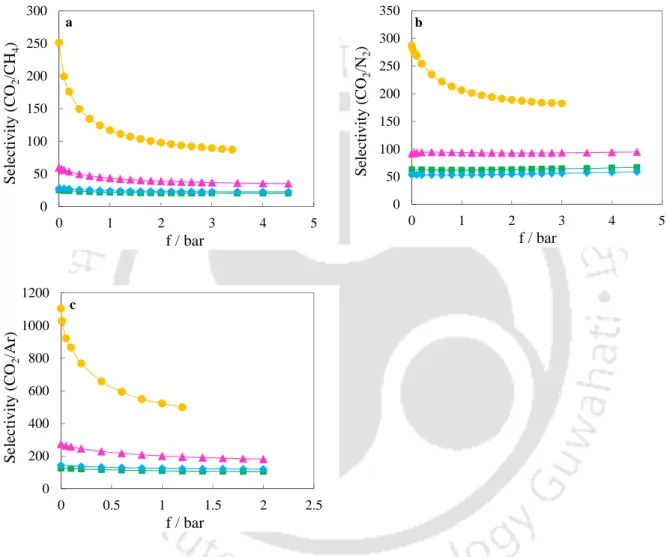
Prediction of Binary Selectivity using IAST
DOBDC compounds have been found to be selective for CO over CH4 and N2 (Figure 6.40) due to the presence of electrostatic interactions in case of CO adsorption. As in the case of CO2, the selectivity of CO over CH4 and N2 decreases with pressure due to reduced electrostatic interactions. For the Mg/DOBDC and Mn/DOBDC samples, the decrease in the selectivity of CO over CH4 and N2 with pressure is less pronounced than in the case of Ni/DOBDC and Co/DOBDC (which show exceptional Henry's constants for the adsorption of CO).
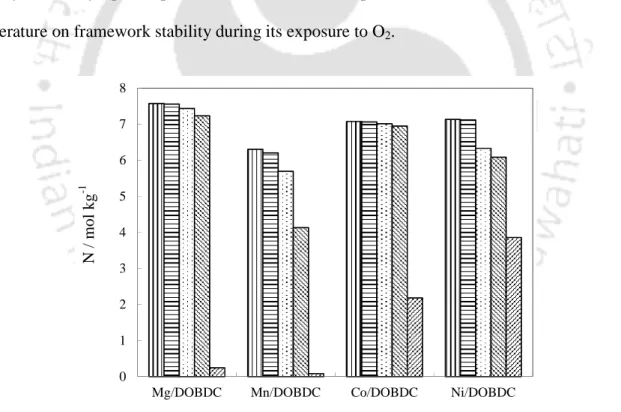
Stability of Frameworks upon Exposure to Different Adsorbates
Then the sample was exposed to O2 at 294 K and ~100 bar; then followed by another CO2 adsorption uptake measurement at 294 K and 1 bar. The O2 exposure was repeated at 315 and 352 K followed by CO2 adsorption uptake measurement at 294 K and 1 bar each time. The reduction in the measured CO2 uptake at 294 K and 1 bar is correlated to the effect of O2 on the framework stability.
Summary
ADSORPTION CHARACTERISTICS OF COORDINATIVELY SATURATED METAL SITES CONTAINING M/DABCO MOFS
Background
While small pore sizes in these MOFs are favorable for enhancing vertical interactions between the adsorbent and the adsorbate, the absence of cus metal centers results in negligible electrostatic interactions [71,. Comprehensive study of adsorption properties of these MOFs involving different adsorbates as well as a large temperature and pressure range will be beneficial to understand the adsorption behavior of MOFs with coordinatively saturated metal centers. While the previous literature suggests the absence of electrostatic interactions and low enthalpy values for adsorption on these MOFs, it will be interesting to systematically investigate and compare the adsorption properties of these MOFs with the coordinatively unsaturated metal site containing DOBDC MOFs studied in the previous chapter .
![Figure 7.1: Crystal structure of Zn/DABCO MOF (O, red; C, grey; H, white; N, violet; Zn, green) [55]](https://thumb-ap.123doks.com/thumbv2/azpdfnet/10495963.0/193.892.144.765.332.878/figure-crystal-structure-dabco-mof-white-violet-green.webp)
Characterization of Frameworks Synthesized
- Thermogravimetric Analysis (TGA)
- Surface Area and Pore Volume Analysis
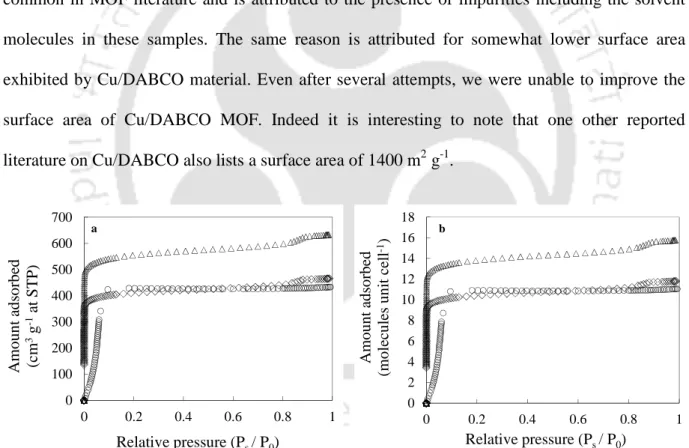
N2 physisorption isotherms at 77 K (Figure 7.3a) were used to calculate BET surface area and pore volume. Comparison of BET surface area and pore volume with existing literature is listed in Table 7.1. The same reason is attributed to the somewhat lower exposed surface area of the Cu/DABCO material.
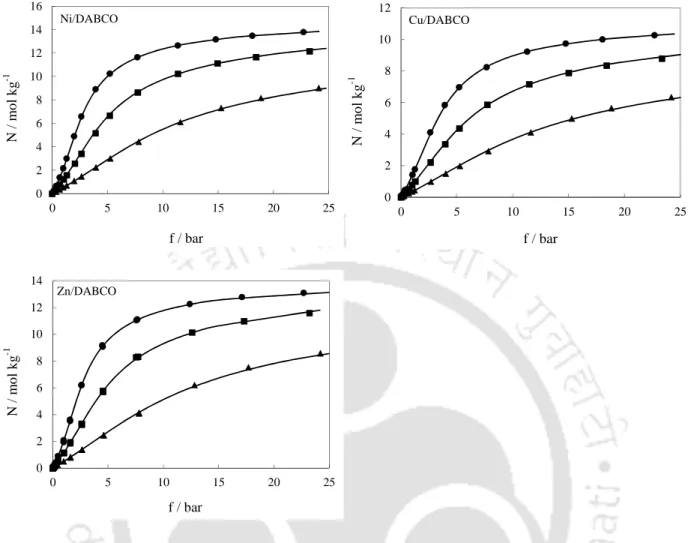
Adsorption Isotherms
- CO 2 Isotherms
- CH 4 Isotherms
Although both DABCO MOFs as well as IRMOF-1 do not have open metal sites, smaller pore diameter of DABCO MOFs (~7.6 Å) compared to that of IRMOF-1 (~14.5 Å) results in better adsorption uptake on DABCO MOFs at lower pressures. While the strain in the low pressure region is lower for the DABCO MOFs compared to CuBTC [95] as the pores gradually fill, this difference decreases as the pore volumes of these MOFs are comparable. On the other hand, the pore volume of MIL-101 [95] is significantly higher and therefore it exhibits a higher saturation capacity than DABCO MOFs (Figure 7.5).