Siti Rohaidah at MIMOS Berhad, for guiding me during the industrial internship, where I gained knowledge about Data Mining and the Intrusion Detection Systems which are the main reference and guidelines for this project. The research project is about to develop a performance measurement tool for Data Mining (OM) techniques in Intrusion Detection System (IDS). By applying the data mining technique, it can improve its accuracy as well as its efficiency in the process of intrusion detection, especially in a large and fast network.
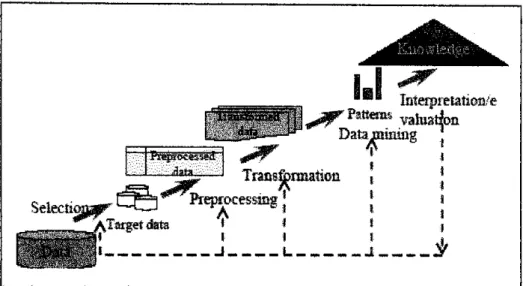
However, there are different types of techniques in OM that can be used to improve the intrusion detection process in IDS, such as K-mean clustering, Support Vector Machine (SVM), Self Organizing Maps (SOM), Neural Networks, etc. Therefore, a performance measurement is required to determine which OM technique is best to use, depending on the network environment and the type of IDS used. The performance measurement takes place in the last phase of the Knowledge Data Discovery (KDD) process, a step-by-step procedure in implementing the DM techniques.
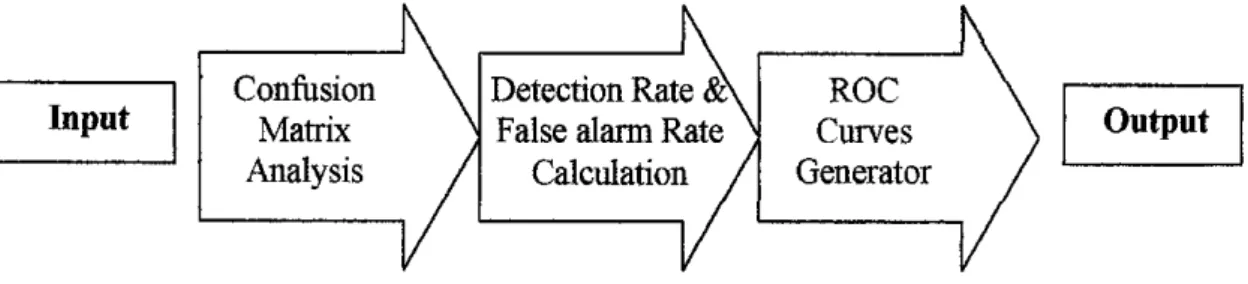
The final results are so important that they should be used in decision making on the implementation of the OM technique in IDS. The tool consists of three main modules: confusion matrix analysis, calculation of detection rates and false alarm rates, and generation of ROC curves as the final result.
Background ofStudy
Intrusion Detection system IDS
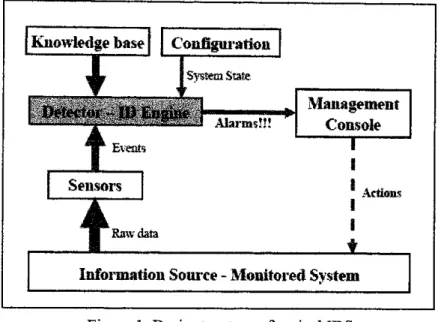
Normally, the basic mechanism for IDS is that when the attack occurs, the sensors detect an unusual pattern in the network traffic monitored by the monitoring system. The signature pattern is analyzed by the system and when the attack pattern is confirmed to be the attack, the system immediately triggers an alarm for further responsive action by the security unit. The IDS can be divided into two categories: the real-time IDS and the offline IDS.
However, offline IDS analyzes data after session information has already been collected (post analysis).
Why Data Mining
Data Mining in IDS Techniques
The pre-processing process is important at the beginning of the process to establish that the data used in the analysis is ready for mining as the selected data is likely to be incomplete, noisy or inconsistent. This is because not all the features in the data set are needed for the analysis. In this phase, the data sets, which are prepared earlier in the preprocessing process, are transferred to the database.
These are: Data Mining for the Abused Detection Model and Data Mining for the Anomaly Detection Model. The final results of the model generation will be evaluated and interpreted into meaningful information, which is the final product of the knowledge discovery process.
Performance Measure
The Developed System
PROBLEM STATEMENT
The intrusion detection in the IDS detects intrusions by examining these packets and marking them as attack or normal. Determining the best DM technique to use is by measuring the technique's performance in detecting known and unknown intrusions before implementing it in the real IDS. With it, a complete study was carried out on the development of a tool capable of measuring the performance of Data Mining (DM) techniques used in Intrusion Detection System (IDS).
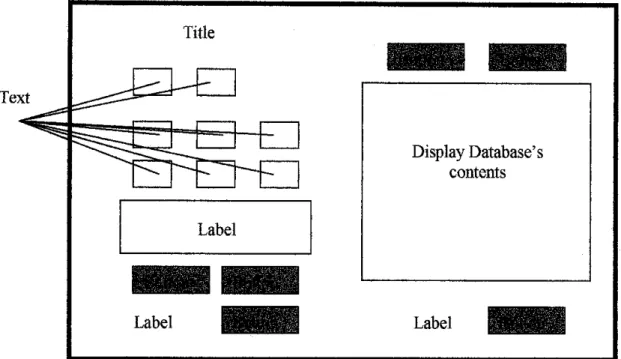
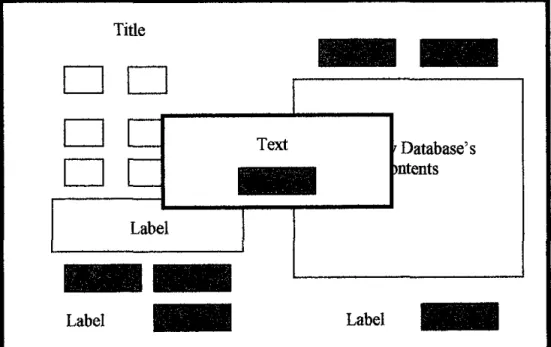
The system accepts the final results of the WEKA knowledge analysis tool which is in the form of confusion matrix and calculates it to generate visual presentation as its final result.
Problem Identification
Significant of the Project
OBJECTIVE AND SCOPE OF STUDY
The Relevancy of the Project
LITERATURE REVIEW AND THEORY
The Thread
Attack Type
A probe and scan attack, or Probe for short, is when an attacker uses a network service to gather information about a host, such as valid IP addresses, the services it provides, or the operating system used. R2L attack is when the attacker gains access to a machine as an unauthorized user (the attacker does not have an account on that machine) over a network and performs malicious operations. U2R on the other hand is when the attacker himself/herself has an authorized access or privileges on the local network, but performs irresponsible actions on the system.
Number of network connection involved
The single network attack on the other hand is a one-to-one attack between the attacker and a single host.
Source of Attack
- The Detection Rate & False Alarm Rate Calculator •••••.••••.•
- The Performance Measure
- The ROC Graph Generator •••••••.•
- Writing the ROC Graph Generator Script
- The Welcome Screen Interface Wizard •••.•••
- Help Document I User Manual
- FUTu-RE EXPECTATION
Knowledge representation Technique of visualization and representation of knowledge used to present. knowledge extracted from the user. But all these techniques used depend on the type of use or system in which Data Mining is to be applied. In this module the system will determine the False Positive and False Negative values based on the confusion matrix.
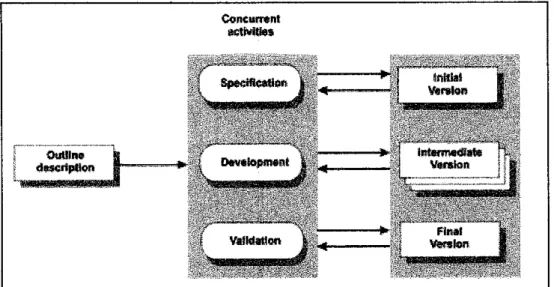
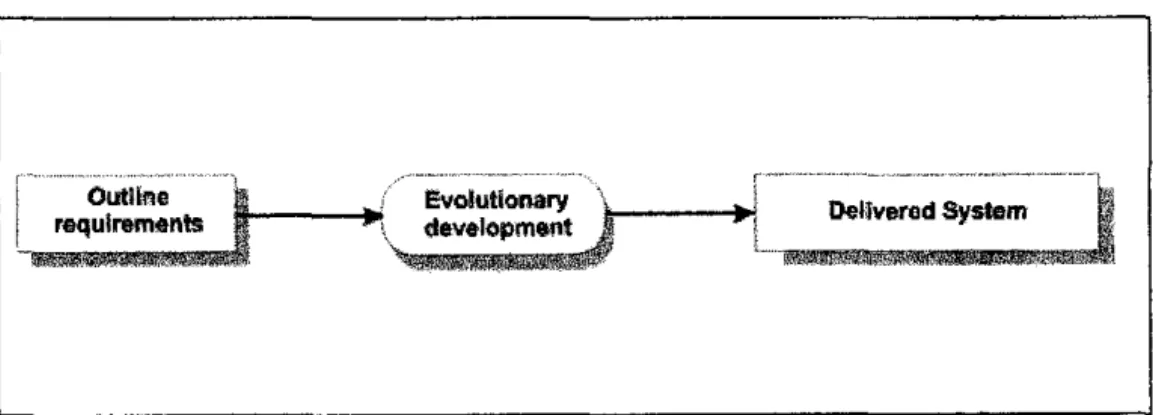
The ROC curve is the final result of the system in a visual and representable form. Their requests contribute to the development of the system due to new features added throughout the process. Therefore, it will be difficult for the project manager to monitor progress as the system evolves rapidly.
The system generates the ROC graph based on the detection rate data and false Alann rates in the database. Each time the system is changed, a number of types of tests are run on the prototype system. Also part of the system testing procedure where a version of the system may be released to users.
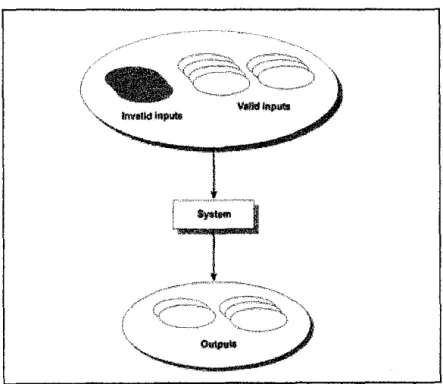
Basically, during the development process of the system, there are three moments when the prototype version is released; the initial version, the intermediate version and the final version. Testing involves concerns about both, demonstrating that the system meets its requirements and discovering problems and defects in the system. When the system encounters errors during user intervention, error messages appear depending on the detected invalid conditions.
The ROC generator is used to obtain the values of the confirmed detection rate and the false alarm rate in the system database and use it to generate the ROC plot. Although the system has met most of the main user requirements, the current system still has some limitations. The system on the other hand will capture the last record or work done by the user.
If one or more entries are registered in the system's database, the system will automatically guide the user to Another special feature that could be integrated into the system is the Report Generator feature. The system ensures the accuracy of the performance measure to determine the appropriate Data Mining technique that can be implemented in the IDS.
Although the system has covered the crucial stage (Interpretation and Evaluation) in KDD process, the accuracy of the results produced depends entirely on the inputs.
CONCLUSION •••.•.••.•