28
CHAPTER TWO
LITERATURE REVIEW
2.0 Introduction
This chapter comprises four sections that review the literature on currency exposure and corporate hedging practice. In line with the three initial objectives to approach deeper on currency exposure, Chapter 2 begins with discussing the symmetric, asymmetric, time- varying and multiscale exposure under three subsections. The discussions are presented in Section 2.2. This is followed by a discussion in Section 2.3 on the impact of corporate hedging practice towards currency exposure among the selected firms. The review provides empirical evidences and direction on the study of corporate hedging practice in the Malaysian economic setting.
2.1 Malaysian Trade
Volume of trade as a ratio of gross domestic products in Malaysia between 2013 to 2016 showed that the percentages of trade were more than 100 percent throughout the years.
The figures illustrated the high composition of trade in Malaysia and signified the mass trading activities in the country. In 2016, the main industries were food and beverages (3.8% of total trade), tobacco (0.6%), crude materials (2.9%), mineral fuels and lubricants (14.1%), animal and vegetable oils and fats (6.4%), chemicals (8.2%), manufactured goods (8.9%), machines and transport equipment (43.0%), miscellaneous manufactured articles
29
(11.3%), and miscellaneous transactions and commodities (0.6%). Meanwhile, Malaysia’s main trade partners were China (14.1% of total export), Singapore (13.9%), the US (9.6%), Hong Kong (6.8%), and Japan (6.7%). Even though China ranked first as Malaysia’s main trade partner, its currency needed to be excluded from this study in consideration of the pegging of Renminbi to the US dollar (Bacha et al., 2013). Pursuing the study with the Renminbi would cause multicollinearity problem and underestimate the real value of the currency exposure.
Comparing the trade balance of Malaysian as a developing country and the neighbouring Singapore in Figure 2.1, Malaysia’s trade balance was relatively higher than Singapore under most of the periods. As trade balance denoted the difference between the export and import levels of a country, positive trade balance was used to indicate greater export volume of a country compared to its import volume. Still, higher trade balance of Malaysia indicated more robust trading activities in Malaysia compared to Singapore. Thus, higher trade openness was assumed in Malaysia compared to Singapore. Such high market openness to international trade makes the country vulnerable to currency movement.
Henceforth, currency exposure in Malaysia was prevalent due to the significant trading activities in the country.
30
Source: World Bank Database Figure 2.1: Trade Balance of Malaysia and Singapore, 1995 - 2016
2.2 Foreign Currency Exposure
2.2.1 Theoretical Review of Foreign Currency Exposure
Generally, currency exposure is defined as the changes in stock returns and firm values which were resulted by changes in exchange rate (Adler & Dumas, 1984;
Allayannis & Ofek, 2001; Bacha et al., 2013). Any change in the exchange rate would affect a firm’s revenue or loss and eventually affected the value and stock return of the firm. Volatility of floating exchange rate was an important investment concern and formed a substantial component of currency exposure. Clark and Mefteh (2011) regarded exchange rate fluctuation as an important macroeconomic variable that significantly affected firm value. Currency exposure affected key indicators such as international trade volume (Chaudhry et al., 1993), export-import business orientation, hedging practice and specific time event. Nguyen et al. (2007) pointed the conventional conviction that exchange rate exposure was related to firm value by altering the future
-50 0 50 100 150 200 250
1995 1996 1997 1998 1999 2000 2001 2002 2003 2004 2005 2006 2007 2008 2009 2010 2011 2012 2013 2014 2015 2016
Trade balance (USD million)
Year
Trade Balance
Singapore Malaysia
31
cash flows and overseas asset values and ultimately affected trade payment and receivable.
Various mechanisms channelled the effect of currency movement towards the firm value. The firms’ trading position also played a significant role in moulding the effect of currency movement. Appreciation and depreciation of domestic currency will produce different effects towards the firms’ revenues in accordance to importing and exporting nature of the firms. Figure 2.2 illustrates the currency exposure as resulted by currency movement. Exporting firms were expected to experience higher revenues when domestic currency depreciated from point C to D. Lower value of domestic currencies directly caused the increase in value of foreign currency. Subsequently, the expected receivable amounts from the transaction would increase and prompted higher revenues for the exporting firms. On the other hand, appreciation of local currency at point A would produce more revenues for importing firms. As importing firms were expected to pay for the goods acquired through the trade, higher value of domestic currencies required the firms to fork out smaller payable amounts to pay for the traded goods. Meanwhile, the performance of exporter firms increased when the local currency depreciated at point D. Higher stock returns were expected for exporter firms in times of stronger local currency as the firms tended to enjoy greater receivables from their trades.
32
Source: Shapiro (2010) Figure 2.2: Relationship between Currency Changes and Firms Stock Returns
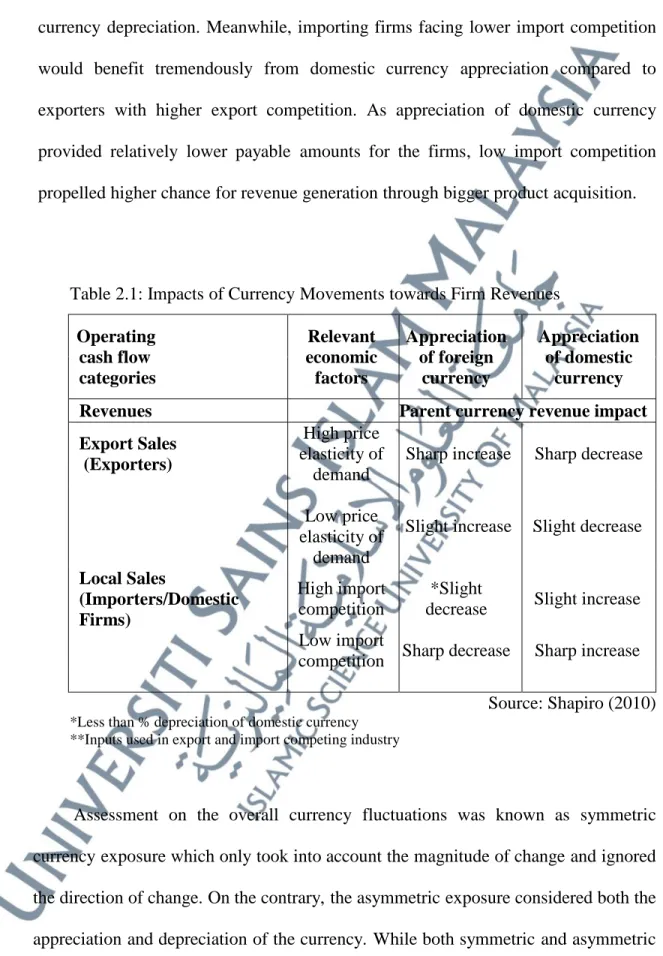
Further details on the effect of appreciation and depreciation of the local currency are included in Table 2.1 as discussed by Shapiro (2010). The table comprises four different degrees of currency movement. In contrary to exporting firms that enjoyed greater revenues during domestic currency depreciation, importing firms favoured appreciation of domestic currency. The degrees of revenue increment differed according to price elasticity and level of competition of the respective firms. High price elasticity of demand took place when the firms only concentrated on producing similar products rather than diversifying their products. Exporting firms with high price elasticity tended to experience a drastic increase in revenues when the domestic currency depreciated. However, revenues of exporting firms with bigger product variation and lower price elasticity only increased slightly in response to domestic
Domestic currency Appreciation
Exchange Rate Exposure Stock
Return s
Domestic Currency Depreciation
Net Exporters Net Importers
A D
B C
33
currency depreciation. Meanwhile, importing firms facing lower import competition would benefit tremendously from domestic currency appreciation compared to exporters with higher export competition. As appreciation of domestic currency provided relatively lower payable amounts for the firms, low import competition propelled higher chance for revenue generation through bigger product acquisition.
Table 2.1: Impacts of Currency Movements towards Firm Revenues Operating
cash flow categories
Relevant economic factors
Appreciation of foreign
currency
Appreciation of domestic
currency
Revenues Parent currency revenue impact
Export Sales (Exporters)
High price elasticity of
demand
Sharp increase Sharp decrease
Low price
elasticity of demand
Slight increase Slight decrease Local Sales
(Importers/Domestic Firms)
High import competition
*Slight
decrease Slight increase
Low import
competition Sharp decrease Sharp increase
Source: Shapiro (2010)
*Less than % depreciation of domestic currency
**Inputs used in export and import competing industry
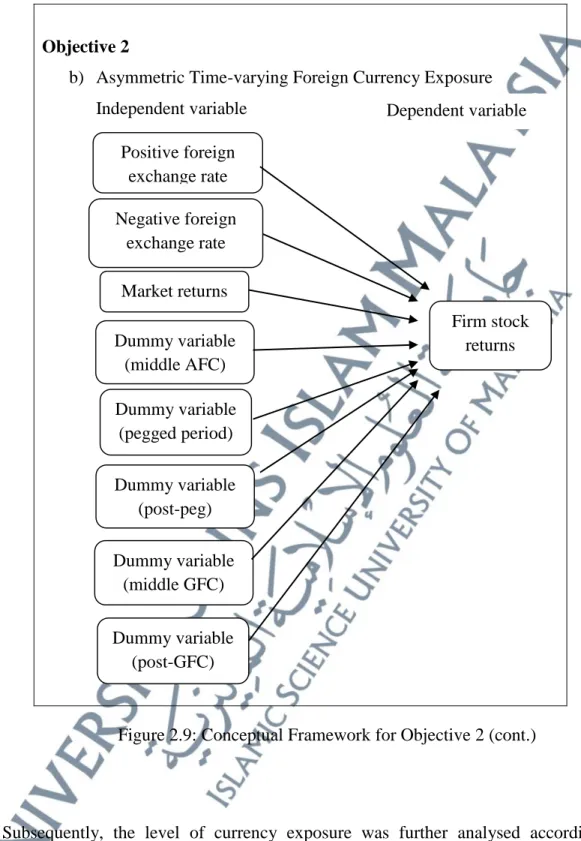
Assessment on the overall currency fluctuations was known as symmetric currency exposure which only took into account the magnitude of change and ignored the direction of change. On the contrary, the asymmetric exposure considered both the appreciation and depreciation of the currency. While both symmetric and asymmetric
34
measurements indicated proportional increment in the level of exposure with currency fluctuations, asymmetric approach scrutinised the appreciation and depreciation of the currency. In other words, asymmetric measurement argued that appreciation and depreciation of the currency value caused different effects towards the firm value.
Appreciation in foreign currency against local currency was favourable for exporter as the condition caused higher foreign receivables and lower cost, resulting in higher future profit. Meanwhile, currency depreciation was beneficial for net importer as lower value of foreign inputs would reduce the future payables. Simultaneously, the foreign sales were expected to be higher during local currency depreciation.
2.2.2 Incidences of Symmetric Foreign Currency Exposure
2.2.2.1 Incidences of Symmetric Foreign Currency Exposure in Developed Countries
Sizeable exchange rate exposure arose from the relationship between exchange rate movements and firms’ stock return. In line with the acknowledged importance and theoretical prediction of foreign currency exposure, numerous studies attempted to measure the magnitude of currency exposure in various markets (Bacha et al., 2013; Bartram & Bodnar, 2012; Dewenter et al., 2005; Muller & Verschoor, 2007; Parsley & Popper, 2006; Yip & Nguyen, 2012). The widespread studies on the topic and development of the international investment and trade illustrated the integral role of currency movement towards the cash flows of multinational companies.
35
However, studies on currency exposure were mostly dedicated to developed markets that were often characterised by high efficiency and better operational structure. This was in addition to the high hedging intensity in developed countries due to the advancement in the financial sector. Therefore, currency exposure in developed markets was found to be lower than those in emerging markets. The US and the UK markets were the most common sample studies (Allayannis & Ofek, 2001; Bartram et al., 2013; Bartrov, 1997; Bodnar & Marston, 2002; Bodnar & Wong, 2003; Belghitar et al., 2011; Di Iorio & Faff, 2000; Wong, 2010).
The study by Jorion (1990) was motivated by the movements in the US dollar and investigated the pricing of exchange rate risk in the US stock market. Testing the non-zero unconditional risk premia, the study found small and insignificant risk premia in the market. It was shown that 5% of the sample firms experiencing significant currency exposure would only earn 2% higher annual return compared to firms with no exposure. In this sense, the study confirmed that the exposure of the US common stocks to exchange rate movement was not systematically related to the expected returns.
Similar to Jorion (1990), Bodnar and Wong (2003) concentrated their study on 910 firms with data running from 1977 to 1996. The study applied two stages of exposure analysis. In the first stage, the study followed the total exposure model by Adler and Dumas (1984) which was argued as capable to take into account the effect
36
of exposure elasticity. In the second stage, the study incorporated the macroeconomic factors into the model as expressed by Allayannis and Ofek (2001). The macroeconomic factors were included based on the prediction that sensitivity of firm cash flows was dependent on the nature of the firms’ activities, denomination of its competition, and the level of competitiveness in the input and output markets. The study segregated the analysis into several investment horizons and found that 15% of the firms were significantly affected by currency exposure within 18 months of the study period. The exposure level increased to 20% when the period was extended to 60 months.
Meanwhile, Bergbrant et al. (2014) also estimated the currency exposure of the US market but resorted to use primary data. The study proposed competition as the first order-determinant for firms that were either directly or indirectly involved in international trading. The study found small and insignificant exposure level by employing the exposure model by Adler and Dumas (1984) on survey data by the World Business Environment Survey (WBES) of 2400 firms across 55 countries.
Utilisation of the survey data enabled the study to obtain the primary exposure data with minimal hedging interventions. The study found 76% of the sample firms were affected by exchange rate movement while exchange rate changes still affected 63%
of the domestic firms. The small exposure level reported in previous empirical studies was due to the hedging activities undertaken by the firms prior to the reporting.
Hence, the exposure level only represented the net exposure value that was left after undergoing all hedging activities.
37
On another front, Abdul Wahab (2017b) focussed on currency exposure of Malaysian firms in consideration of the country’s open economic practice. The study estimated currency exposure in the country from 1993 to 2016 for 106 non-financial firms by using the residual exposure model in its first stage analysis. In the residual model, macroeconomic factors were incorporated into the market index and enabled more accurate assessment on the level of currency exposure. Interestingly, the study tested the exposure against four currencies namely the US dollar, Great Britain Pound, the Euro and Japanese Yen. All four currencies were shown to exhibit significant exposure towards the Malaysian firms. Within expectation, the greatest degree of exposure came from the USD considering the US’ position as Malaysia’s main trading partner among the four countries.
Georgiadis and Zhu (2021) took the analysis on currency exposure to a new spectrum by investigating the potential behaviour of state-owned enterprises in response to currency exposure. Using data of 26 SOEs from 2000 to 2017, the responses were used to identify the potential trade-off between financial stability and macroeconomic stability. Estimation results from the Fixed Effects panel regression provided evidence that the SOEs were responsive to tightened base-country monetary policy in order to address immediate threats to financial stability.
38
2.2.2.2 Incidences of Symmetric Foreign Currency Exposure in Developing Countries
Meanwhile, more widespread exposure in emerging markets compared to developed countries was found by Parsley and Popper (2006). Seven Asian countries (Hong Kong, Japan, Taiwan, Thailand, Malaysia, Indonesia, and Singapore) in the study were exposed to the fluctuations of the US dollar, Euro and Japanese Yen. The exposure level was found to be persistent throughout the 12 years period (January 1990 to March 2002) even during the exchange rate peg. In the study, 50% of Malaysian sample firms were significantly affected by fluctuation by all currencies.
The high exposure levels were attributable to the high degree of openness in both capital and goods markets in the developing markets (Parsley & Popper, 2006).
Focusing on the Asian market, Muller and Verschoor (2007) listed four motivations to study currency exposure in the market. The first motivation factor was the open and active economies within the region. The second factor was the rapid growth and market capitalisation. The third factor was the different trading patterns between the regions and the US and Japan. Lastly, the fourth factor was the absence of any comprehensive previous empirical findings focusing on the markets. Data were analysed from January 1993 to January 2003 in which the study found 25% of 3634 sample firms were affected by the fluctuations in the US dollar. The movement in Japanese Yen also exerted high effect which affected 22.5% of the sample firms. Still on the Asian markets was the study by Lin (2011) which focussed on the asymmetric effects of India, Indonesia, Korea, the Philippines, Taiwan and Thailand. The sample
39
period extended from 1997 to 2010 to capture the effects of the Asian financial crisis and global financial crisis. High degree of asymmetric currency exposure was reported for the markets, with notable peaks during the two financial crises. As partially segmented markets, these countries received continuous government interventions to help stabilise their foreign exchange markets.
Another study on emerging market was by Molele and Mukuddem-Petersen (2020) that focussed on the relationship between the market return and foreign currency exposure in South Africa. Their study on 108 non-financial firms was primarily motivated by Jorion (1990) but extended to include the Fama-French three- factor model, Carhart four-factor model and Fama-French five-factor model.
Extending the model was relevant to take into account the idiosyncratic factors of partially segmented equity market such as the South African market. The study found more than 40% of the firms were significantly affected by all proxy currencies using the two-factor model. The figure was considerable high and relevant for an emerging market. However, the currency exposure level ranged between 6.5% to 12% under the Fama-French three-factor model, Carhart four-factor model, and Fama-French five-factor model. With this, the paper managed to justify that consideration of the idiosyncratic factors would provide more meaningful findings on the exposure level in the market.
40
A single country analysis by Bacha et al. (2013) specifically focused on the Malaysian market and highlighted the scarcity of prominent studies on the developing economy. The study used both OLS and GARCH (1,1) models and found that 71%
of the listed firms were significantly affected by currency exposure. The exposure level found in the study was higher than the levels in developed countries. Abdul Wahab et al. (2017) found high level of trading activities in Malaysia between 2015 to 2018 at 28.38% and 28.0%, respectively which motivated the study to investigate the hedging practice in Malaysia. Focusing on ASEAN-4 countries, Abdul Wahab et al. (2017) found noticeable impact of foreign currency derivative hedging practice in Malaysia and Indonesia during the Asian financial crisis. However, the study suggested that FCD practice was not suitable to mitigate long-term exposure. The findings made economic sense as advancement, and market uncertainties indicated that unforeseen long-term exposure cannot be easily hedged.
2.2.3 Theoretical Review of Asymmetric Foreign Currency Exposure
Another component of the currency exposure is the asymmetric exposure.
Asymmetric exposure is defined as the extent of currency exposure which corresponds to either the positive or negative movements of the currency. As exchange rate volatilities could force firms to adjust their international trade volume and increase their incentive to hedge, ascertaining the direction of currency movement is a crucial component of currency exposure analysis. Rather than constraining the effect to symmetric exposure, firm value can also be asymmetrically affected by the exchange
41
rate volatilities. In fact, researchers also argued that specification problem was the cause for the low currency exposure levels (Bartov & Bodnar, 1994).
2.2.3.1 Pricing-to-Market Theory
A number of theoretical models had been implied in the study of asymmetric currency exchange rate purporting to describe the actual corporate behaviour. The first theory was the pricing-to-market (PTM) theory where firms tended to maintain their prices in order to sustain their market share (Pick & Carter, 1994; Knetter, 1994;
Koutmos & Martin, 2003; Bowe & Saltvedt; 2004). PTM arose from the decision of the exporter to adjust their prices according to their destination-specific market when the exporter’s currency appreciates relative to the importer’s currency (Pick & Carter, 1994). The extent of which the exchange rate changes were reflected in export and import prices indicated price discrimination as exhibited during the prolonged appreciation of the US dollar in the mid˗1980s.
Knetter (1994) evaluated a few industries in Japan and Germany across different asymmetric currency cycles to observe any PTM behaviour of the sample industries. Findings from the study showed that any strategies to increase market share in foreign market could lead to higher level of PTM during domestic currency appreciation. It was concluded that firms were inclined to exercise higher level of PTM when the local currency appreciated considering the firms were spared from paying the entry cost upon entering the specific domestic market. However, the
42
tendency decreased when the local currency depreciated against foreign currency, thus exhibited asymmetries in the firms’ reaction to the exchange rate movements.
Slow adjustments of the price setting strategy to the exchange rate movements implied the potential asymmetric effect towards the future revenues (Bowe &
Saltvedt, 2004).
Another driving factor of the PTM was the exchange rate pass through as firms needed to absorb the effects from the changing currency exchange movement and inflation rate. Close association between the inflation rate and the currency movement resulted in potential benefit or adverse effect towards the firms (Nasir et al., 2019). With this, the firms were said to be asymmetrically affected by the pricing- to-market strategy put in place within the firm structures.
2.2.3.2 Hysteretic Behaviour Theory
Secondly, the asymmetric effect could also arise due to hysteretic behaviour of the firms. According to Ljungqvist (1994), hysteretic behaviour referred to the persistent effect on trade flows that was inflicted by temporary change in the exchange rate fluctuations. Hysteretic behaviour was mainly driven by a condition known as the irreversibility of investment, in which the firms needed to maintain high entry cost when entering a market compared to the cost enticed when the firms left the market (Baldwin, 1988; Koutmos & Martin, 2003; Tai, 2005).
43
Baldwin (1988) argued that the high entry cost caused the firm to be unable to leave the market despite the market conforming back to its previous equilibrium.
Hence, the firms found it more viable to maintain in the market and changed their prices according to the current currency movements. Different responses to currency appreciation and depreciation by these firms was known as asymmetric competitive effect which led to asymmetric exposure (Baldwin, 1988; Tai, 2005). In this regard, the firms were deemed as facing asymmetric currency exposure due to their hysteretic behaviour in response to the different directions of currency movements.
2.2.3.3 Asymmetric Hedging Theory
The third theoretical assumption was the asymmetric hedging which gave rise to the asymmetric effect of currency movements (Koutmos & Martin, 2003; Lin, 2011; Bahmani-Oskooee et al., 2020). Instead of hedging their exposure to the overall exchange rate, firms were also intrigued to hedge their exposure to certain market conditions that were detrimental to the firm value. Koutmos and Martin (2003) argued that firms were inclined to hedge from certain currency movement while leaving other movements remained unhedged. The asymmetric hedging would generate asymmetric impact on the cash flows for the firms. Derivatives such as currency options were often used to hedge the business operation from adverse exposure during undesirable market conditions while remain unhedged to favourable market movements. Analysis on the Korean firms by Bae et al. (2018) argued that the effectiveness of hedging activities depended on the direction of firm’s exchange rate
44
exposure in which the firms reduced positive exposure by selling the currency forwards and futures. On another note, negative exposure was reduced through exchange rate pass-through rather than involving any financial derivatives. Opting for selective hedging to reduce certain expected future condition induced asymmetric exposure to these firms than was often miss-specified as symmetric exposure and could lead to inappropriate risk management strategies.
2.2.4 Incidences of Asymmetric Foreign Currency Exposure
Bartov and Bodnar (1994) analysed 208 sample firms in the US from 1978 to 1989. The study showed the impact of a given exchange rate relied on the investment positions of the firms and the direction of currency movement during the period of analysis. Tai (2005) analysed the effect of asymmetric currency exposure on US bank stocks using the multivariate GARCH parameterisation and included the impact of exchange rate during periods of appreciation and depreciation. Conducted on 10 major US commercial banks between 1978 to 2001, the study found that more than 80 per cent of the sample were significantly and economically exposed to asymmetric exchange rate exposure. The findings were also consistent when tested under contemporaneous and lagged currency changes, suggesting robust empirical findings of the asymmetric exposure. Another prominent study on the asymmetric currency exposure was by Koutmos and Martin (2003). The study used data from four major economies which were the US, UK, Germany, and Japan. Results from the study showed 38.9% of the firms were exposed to symmetric exposure. The level increased
45
to 42.9% when asymmetric exposure was taken into consideration. The financial sector was the most affected sector. Based on the higher exposure level under the asymmetric analysis, the study suggested the existence misspecification problems in models that assumed symmetric exposure and neglected the effect of appreciation-depreciation cycles.
From the Asian perspective, five out of eight Asian countries studied by Fang et al. (2005) showed asymmetric exposure. The results confirmed their assumption of possible differences in exchange rate risk effect during the appreciation or depreciation of the currency. Explicitly on the Malaysian landscape, Bahmani-Oskooee and Aftab (2017) provided an analysis on the effects of asymmetric volatility of currency exposure towards the commodity trade flows between the US and Malaysia. The study managed to show significant effects of both the symmetric and asymmetric exchange rate movements on 17 exporting industries and 101 importing industries in the country for data running from 2001 until 2015.
Clark and Mefteh (2011) accentuated higher firms’ incentives to engage in risk management and underinvestment activities arising from the asymmetric behaviour of the currency movements. Sprcic and Sevic (2012) investigated whether returns of 176 largest non-financial firms in French were asymmetrically affected by currency movement in 2004. Confirming their hypothesis, 61% of the sample firms were significantly affected by asymmetric currency exposure compared to 22% exposure
46
level from symmetric analysis. While the symmetric exposure analysis was the mainstream model to measure currency exposure, discussions of these studies also highlighted the importance of incorporating asymmetric exposure into the analysis.
Inclusion of the asymmetric exposure would ascertain the direction of currency movement and provide better precision on the exposure level.
Misspecification issue was raised by Koutmos and Martin (2003) as 42.9% of their cases were found to be asymmetric during currency appreciations and depreciations. Three assumptions on the motivation behind the asymmetric response were offered in the study, namely the pricing-to-market, hysteretic behaviour, and asymmetric hedging. On the other hands, the asymmetric response of US firms was found to be due to the hysteric behaviour as the firms still responded to the lagged effect of currency movements. Based on these discussions, incorporation of symmetric and asymmetric aspects into the study of foreign currency exposure would bring out a lot of information pertaining the behaviour, preferences, and nature of the market.
2.2.5 Time-varying Foreign Currency Exposure
An important measurement consideration in examining foreign currency exposure is to address the potential effect of different financial events taking place in the market.
Several past studies documented the importance to include the time-variant factor into currency exposure analysis. Glen and Jorion (1993) highlighted the time-varying effect
47
towards expected return in the international market. The study argued that the change would cause structural changes in the symmetry and investment structure of the firms.
In addition to the extensive trading activities of the country, Malaysia was hit by two financial crises; the Asian financial crisis (AFC) in 1997 and global financial crisis (GFC) in 2008. The onset of the Asian financial crisis was marked by Thailand’s move to abandon its de facto peg to the US dollar. The currency attack during the Asian financial crisis badly affected the ASEAN countries especially Malaysia, leading to closer regional cooperation among its member in political, economic, and monetary aspects (Tan et al., 2009). For clearer overview of the financial timeline, a summary of the financial events took place in Malaysia between 1995 – 2016 is presented in Table 2.2 below.
Table 2.2: Financial Periods Timeline
Crisis Date Description
Middle AFC
July 1997 – June 1998 (Mizen & Tsoukas, 2012)
Announcement of managed- floating baht by the Bank of Thailand which triggered the Asian financial crisis.
Peg MYR
July 1998 – July 2005 (Muniandy & Uning, 2006)
Period after the Asian financial crisis where the ringgit was pegged to US dollar.
De-peg August 2005 – August 2008 Period after ringgit was unpegged from US dollar and before global financial crisis outbreak.
Middle GFC
September 2008 – March 2009
(Copestake, 2010; Chen et al., 2011)
The downturn of the US housing sector and evolved into a global financial crisis.
Post GFC
April 2009 – December 2016 (Bourkhis & Nabi, 2013)
Period after the global financial crisis.
48
In addition, Malaysia also experienced changes in exchange rate regimes as Malaysia abandoned its managed float regime in response to the AFC and adopted fixed exchange rate against US dollar. The ringgit was pegged to the US dollar at RM3.80 on September 1998. Pegging the Malaysian ringgit to the USD was meant to fend off the speculative attacks on ringgit during the crisis. However, the move was not favourable for importers as their payable amount will be fixed to the peg rate despite the possible lower value of the imported goods. In addition, the nature of the peg regime also led to devaluation of the ringgit and caused persistent significant exposure to the domestic firms (Bacha et al., 2013). The peg was only lifted in July 2005 (Muniandy & Uning, 2006). Trend of the MYR/USD over the years is shown in Figure 2.3. Increasing exchange rate between the two currencies illustrated the need for close evaluation on the exposure level arising from the exchange between the two currencies.
Source: Bloomberg Terminal Figure 2.3: Trend of the Exchange Rate of MYR/USD, 1995 - 2016.
0 1 2 3 4 5 6
1995 1996 1997 1998 1999 2000 2001 2002 2003 2004 2005 2006 2007 2008 2009 2010 2011 2012 2013 2014 2015 2016
MYR/USD
Year
Malaysian Ringgit Movement Against USD, 1995-2016
49
Fang et al. (2005) included time-varying factor to study the currency exposure in eight selected Asian firms. The study found that more than half of the countries experienced unstable variance processes, specifically immediately after the Asian financial crisis. The study concluded different export behaviour of risk-averse exporters during different degrees of foreign market volatility. Consequently, Benetrix et al.
(2015) observed substantial currency generated valuation effects during the global financial crisis between 2002 to 2012. The cross-country analysis showed higher exposure value during the global financial crisis compared to the pre-crisis period.
Hence, the study concluded that time-varying analysis provided better examination setting to understand the distribution of currency exposure.
Another study was also conducted by Yip and Nguyen (2012) during the onset of the global financial crisis (2006-2009). The study selected the Australian resources sector as the main single export sector. The study employed a two-stage analysis to encompass the time-variance factor namely the pre- and during-crisis dummy variable.
The effect of currency exposure was plausible during the financial crisis as the proportion of firms affected by the AUD/USD movement increased by 32.36% on the onset of the crisis. Only 13% of firms were affected before the crisis compared to the 45.36% during the crisis.
On the other front, Ye et al. (2014) studied the currency exposure level during the fixed exchange rate period for 1523 firms from 20 emerging countries between 1999 to 2010. The study rebutted the ‘fear of floating’ epidemic among the emerging market,
50
opposing the utilisation of fixed exchange rate regime to stabilise the exchange rate.
The emerging markets believed fixing their exchange rate could facilitate bilateral trade, reduce output cost associated with exchange rate, and reduce the inflation level.
These reasons gave rise to the fear of floating exchange rate. However, the study managed to prove almost half of the sample firms were still exposed to currency movements during the fixation of the exchange rate. The persistent effect was due to more widespread exposure inflicted by the non-floating exchange rate arrangements.
The pegged regime was also associated with weaker economic growth.
In addition to the significance of time-varying analysis, incorporation of both the asymmetric and time-variation effects into the analysis of currency exposure is deemed as appropriate. Dewenter et al. (2005) conducted event study method with precaution of the asymmetric behaviour of the exchange rate movements. The study examined the currency exposure among the US multinational firms and avoided many problems encountered in previous works by considering the bilateral decline in the Mexican peso and Thai baht. Even though the study managed to showcase contemporaneous relation between stock prices and exchange rates in both markets, the exposure level was still small despite the methodological variations. Dewenter et al. (2005) attributed the low exposure result to the efficient hedging practice and insufficient information to respond to currency movements.
Meanwhile, an in-depth study by Bacha et al. (2013) on 158 Malaysian firms according to policy switches affirmed the time-variant nature of currency exposure in
51
Malaysia market. The study assessed the exposure level from both the overall and firm- level. Switching to the hard peg regime caused the sample firms to be significantly affected by the US dollar movement. The significant results were due to the nature of the peg as the ringgit was on a de facto peg to the US dollar which depreciated the ringgit once its value was recovered prior the crisis.
Abdul Wahab et al. (2017) further supported the relevancy of time-varying. The study found prevalent impact of foreign currency exposure for non-hedged firms during the Asian financial crisis. Consistently, the effect of currency exposure was also significant during the global financial crisis despite falling lower than during the Asian financial crisis. The relatively lower effect of global financial crisis was accredited to the strong economic fundamentals and domestic demand in Malaysia. In addition, the country was not involved with any of the Subprime Collateralized Debt Obligation (CDO) instruments and the US asset-backed securities.
Malaysia is located very close to Thailand which was the epicentre of the Asian financial crisis. However, the global financial crisis in 2008 was centred in the US because of the US subprime crisis. Hence, Malaysia was located ‘outside’ of the epicentre of the crisis. Even though the impact of global financial crisis was lower than the effect during the Asian financial crisis, the Asian countries were still affected by the crisis. The open economic policies practised around the regions made these Asian countries vulnerable to the spill over effects from the crisis and any speculative attacks.
Moreover, the Asian countries were heavily involved in trade activities with the US
52
which is the origin of the crisis, with most of the countries tended to be price takers (Bacha et al., 2013). As price takers are often traded in foreign denominated currencies, weakening of the US dollar during the crisis prompted loss for the Asian countries including Malaysia. Observation of these past findings stresses that currency exposure is event specific whereby the exposure level is higher during specific event or crisis.
Henceforth, further investigation on the level of currency exposure should incorporate time-variance factor.
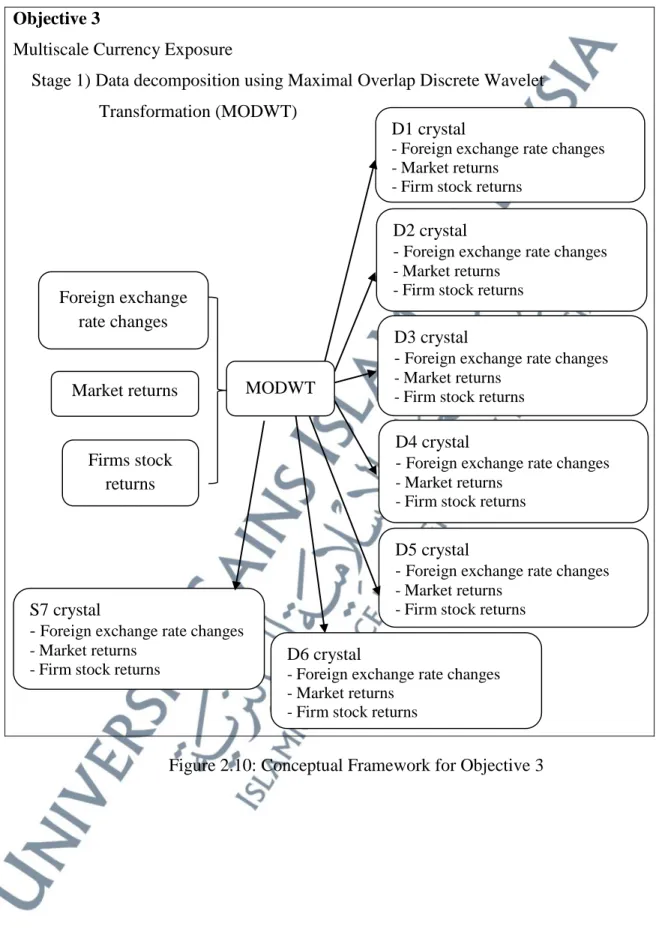
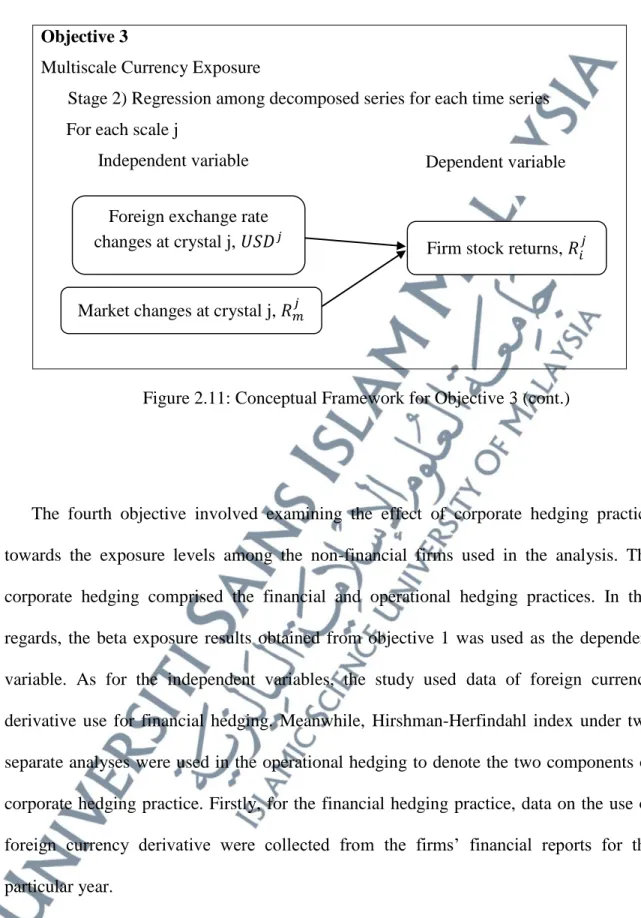
2.2.6 Multiscale Foreign Currency Exposure
In continuation of the time-variant currency exposure, the study also considered the variation in time and frequency domains. Absence of sufficient methodology has hindered past researchers from succinctly measure the exposure with respect to varying time-scales. In contrary to time-varying analysis, multiscale analysis enabled the study to control the length of time period and frequency of the data. The time crystal can be shortened to 2 - 4 days or lengthened to 256 days. On the other hand, time-varying analysis controlled the length of study period based on the intended financial events.
Analysis of currency exposure across multiple time scales would accommodate the vast preferences among the investors. The varying investment horizons and scales among the investors produced unique linkages between stock market and foreign exchange market across different frequencies (Dar et al., 2014). These qualities, together with the recent development in the methodological field, warranted for a better measurement on the currency exposure across different time-scale. Restricting to single time domain would provide bias estimation as interesting time series exhibit complicated patterns
53
over time such as trends, abrupt regime changes, and burst of variability (In & Kim, 2013). However, no study was conducted to measure multiscale currency exposure in developing market despite the relatively higher exchange rate exposure in the market especially Malaysia (Bacha et al., 2013; Muller & Verschoor, 2007; Parsley & Popper, 2006).
One of the hindrances was the lack of appropriate analytical tool to decompose data into more than two time-scales (Masih et al., 2010). Closer study on a multiscale analysis was by Jafry et al. (2020), in which the study compared the dependence structures of five-minutes returns (high frequency data) and daily returns (low frequency data). The five-minutes return series was chosen as the best data set and justified that high frequency data contain more information about the stock market and capable to provide more accurate representation of the market.
On the other hand, regressing high frequency data using the OLS model would only cause spurious regression for non-stationary time-series (Dar et al., 2019). The measurement was made feasible through the introduction of the wavelet analysis. The main advantage of using the wavelet analysis was its ability to decompose the financial data into several time scales and horizons (In & Kim, 2013). Decomposing the financial data into multiple time intervals was advantageous to cater the wide investment spectrums in the market. Some investment strategies opted for more scrutinised and shorter-termed investment instead of the standard monthly periodical analysis.
54
So far, several studies have adopted wavelet technique in exploring financial and economic relationship. Masih et al. (2010) studied the stock markets of seven Gulf Cooperation Council (GCC) countries and provided evidence of the multi-horizon nature of systematic risk. The GCC countries are Kuwait, Muscat, Bahrain, Saudi Arabia, Doha, Qatar, Abu Dhabi, and Dubai. According to Masih et al. (2010), multiscale measurement was absence in the past due to inadequate analytical tool. It was until the introduction of Wavelet analysis method that studies began to look into different investment scales. Motivated by the thin and infrequent trading in the countries, the study attributed multiscale systematic risk due to multi trading strategies and horizons by the investors. The diverse investment strategies were prompted by the characteristics of the market such as infrequent trading, high transaction cost, illiquidity, under development, and dependency on individual investors. Using the Wavelet method, Masih et al. (2010) found that average systematic risk beta coefficient in all Gulf Corporation Council (GCC) showed multiscale tendency.
The multiscale tendency was similar with the finding by Gherman et al. (2012).
The study provided evidence of better financial market prediction by using the wavelet transformation. Hence, it was indeed important to understand the multi-horizon nature as it enabled better understanding on volatilities and correlations between asset returns over time (Saiti et al., 2014). The multi-horizon exposure was in line with investors’
interest towards the level of exposure for various holding periods, particularly short- term period. Similarly, Alvarez-Ramirez (2002) argued that simple and straight random processes fail to describe the dynamics of the economic and financial system. The
55
findings prompted the study to opt for multifactorial study on dollar-Mexican peso exchange rate.
Sensitivity to exposure level arose from the non-proportionate return interval changes between the security and the market. According to Handa et al. (1989), increment in return interval prompted higher beta value for high-risk securities.
Meanwhile, lower beta values were recorded for low-risk securities. The study associated high-risk securities with small firms and low-risk securities with big firms.
Therefore, the beta values across the scales were bound to the risk nature of the securities and the magnitude of the operating firms. In other words, the relationship between stock returns and exchange rates dynamically changed throughout different scales and frequencies.
In order to sufficiently cater the varying time scales nature of the financial market traders, the conventional time-domain approach needed to include other frequency forms (Dar et al., 2014). Dar et al. (2014) showed the traditional ordinary least square (OLS) estimation in their study only provided results that were similar to the findings from the 5th quantile median function rather than encompassing the overall findings.
OLS regression by Handa et al. (1989) also failed to provide any evidence of beta sensitivity to lengthened return interval. Failure to capture the effect of the longer return interval may be due to the information loss regarding the beta dynamics across different intervals (Masih et al., 2010). This gap highlighted the practicality of the wavelet
56
through its ability to decompose data for different time scales without losing any information. Since the base scales included any non-stationary components, the data also did not require to be differenced or detrended (Masih et al., 2010).
Wavelet analysis was considered as an enhancement of the traditional Fourier transforms. The fundamental idea of the Fourier analysis proposed the ability to approximate any deterministic function of the frequency through the infinite sum of trigonometric function (In & Kim, 2013). In addition, wavelet analysis expanded the functions trough translation and dilation of the fixed function known as mother wavelet.
In the analysis, Haar and Daubechies mother wavelets were considered as superior measurements for financial time series as they were capable to capture the economic and financial time series characteristics (Gherman et al., 2012).
Another form of wavelet transformation was the Morelet wavelet transformation.
Junior et al. (2019) utilised the Morelet wavelet transformation to explore the co- movement of returns of four major currencies in Ghana. The study was successful to indicate the presence of interconnection between the US dollar, Euro, pound, and Yen, as well as the interdependencies with time-varying and heterogeneous over different time scales. Mariani et al. (2020) used two wavelet transformations which are the Dynamic Fourier Transform and the Wavelet Transform. Utilisation of the wavelet transformations enabled the study to observe the market volatility up to minute- frequency. Thus, efficiency of the wavelet methodologies to detect any multiscale
57
characteristics existing within the market spectrum was capable to point out potential financial irregularities in the market was proven.
In addition to its multiscale property, the localisation of wavelet in time and frequency also permitted closer connection between the function and their respective coefficients. These characteristics enabled wavelet to possess two methodological benefits which include the flexibility to handle very irregular data series and the ability to isolate the contaminated noise in the data (Donoho et al., 1995; Gherman et al., 2012;
Ramsey, 1999). Consideration of the time scale aspect was crucial as economic and financial variables simultaneously operated on varying time scales and their relationship may differ across these time scales (Handa et al., 1989). Delayed adjustment to any new information and infrequent trading were also regarded as the reasons leading to the multiscale bias. These conditions would lead to autocorrelation problem in the stock returns and eventually prompted biased beta estimation (Gujarati, 2003).
Bjornson et al. (1999) further stressed the argument which stated that the beta tended to be sensitive towards different time scales due to different frequencies of the beta for macroeconomic risks. Hence, numerous studies had used wavelet analysis to test various economic and financial aspects such as linear and non-linear Granger causality between spot and future oil prices (Alzahrani et al., 2014), systematic risk beta at different time scales (Masih et al., 2010), intraday seasonality extraction that is free
58
of model selection parameters (Gencay et al., 2001), property of foreign exchange volatility (Gencay et al., 2001b), time and scale dependencies of intraday Asian currency spot exchange rate (Karuppiah & Los, 2005), and orthogonal decomposition of economic variables by time scales (Ramsey & Lampart, 1998). However, this study is the first to conduct wavelet analysis on the Malaysian market with special attention on the exchange rate exposure.
2.2.7 Meta-analysis of Foreign Currency Exposure
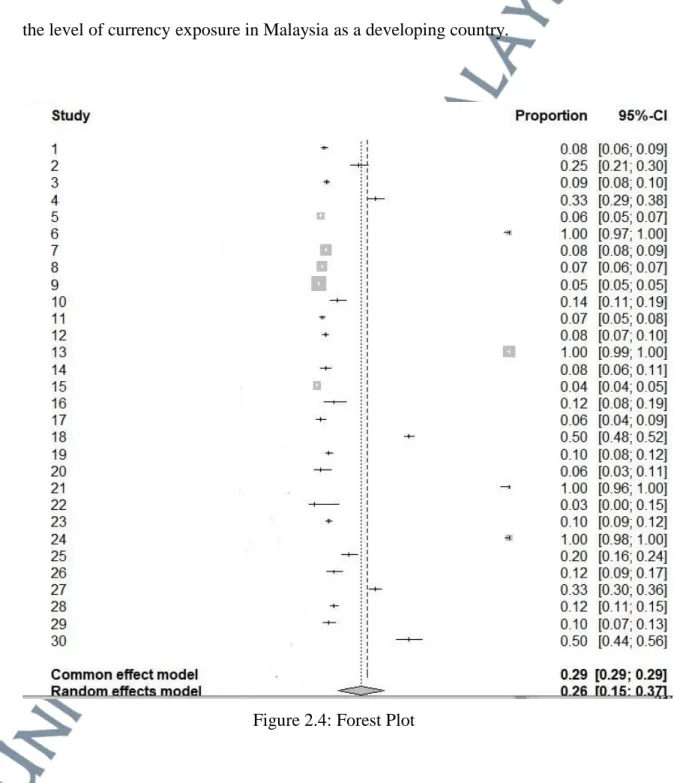
The study conducted a meta-analysis on the currency exposure literature to integrate the findings. Meta-analyses summarised the literature results on particular topics, provided an overall overview of the subject matter, and allowed an analysis of the factors that may influence the results. In other words, the method uncovered a synchronous pattern of empirical data from the current literature. Out of the 59 literature discussed in Section 2.2.1 until Section 2.2.5, the study eventually included 30 literatures in the meta-analysis. The literatures were selected based on their findings on the effect of foreign currency exposure to firm values. The analysed period spread from 1990 to 2021. The number of firms was 7276 with a total of 75704 firm-year observations.
Table 2.3 shows the result of the pooled sample size estimate. From the table, the inverse variance (IV) pooled Cohen’s d (𝜏2) showed that the true variation in the effect size of the point estimate. In other words, the value denoted the estimated amount of systematic differences in the effects across studies. As the-between-study variance (𝜏2)
59
of the summary proportion was 0.1838 (95% CI=0.0643,0.1833) and the 𝐼2 was 99.99%
(95% CI=99.9670, 99.9884), the positive value indicated the higher incidences of currency exposure in developing countries. Additionally, the heterogeneity test was indicated by the Q-statistics of 251010.5909 (p-value<0.0001) which also suggested high heterogeneity in the effect size. Presence of heterogeneity in the study indicated that other moderators could also be of effect towards the firm value.
Table 2.3: Pooled Effect Size Estimates
Indicator Estimates
Between study variance (𝜏2) 0.1838
95% CI (0.0643, 0.1833)
Heterogeneity test
Chi square statistic 251010.5909
p-value (Chi square) 0.0000
I squared (variation in Cohen’s d attributable to heterogeneity)
99.99%
Test significance of Cohen’s d
z-stat 3.3072
p-value (z-stat) 0.0009
In addition to the pooled size estimates, forest plot was depicted in Figure 2.4 to provide graphical distribution of Cohen’s d where the left-hand side distribution illustrates the effect of currency exposure on developing market. In the figure, the vertical lines that intersected the horizontal line indicated the relevant point of estimate values for the summary proportion. Boxes in the graph referred to the point estimates of each study effect, with bigger box size pointed to shorter horizontal line and better
60
precision of the study. As the distribution was concentrated on the left-hand side of the graph, the incidences of currency exposure were deemed as more frequent in developing countries. These findings thus supported the study’s objectives to explore the level of currency exposure in Malaysia as a developing country.
Figure 2.4: Forest Plot
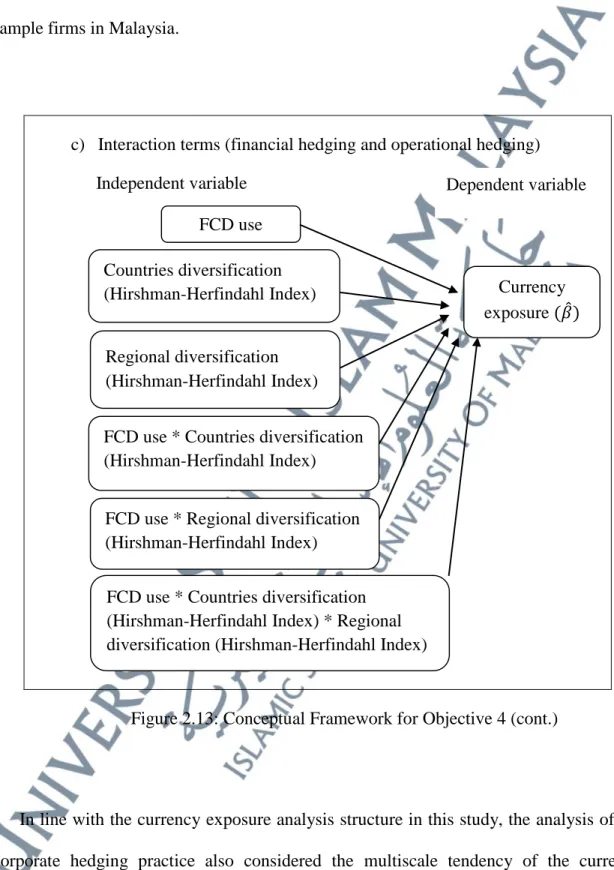
61 2.3 Corporate Hedging Practice
2.3.1 Theoretical Review of Hedging
Discussions on the effectiveness of hedging practice had been long debated by scholars. In this regard, this study outlines a few theoretical discussions involving the hedging practice.
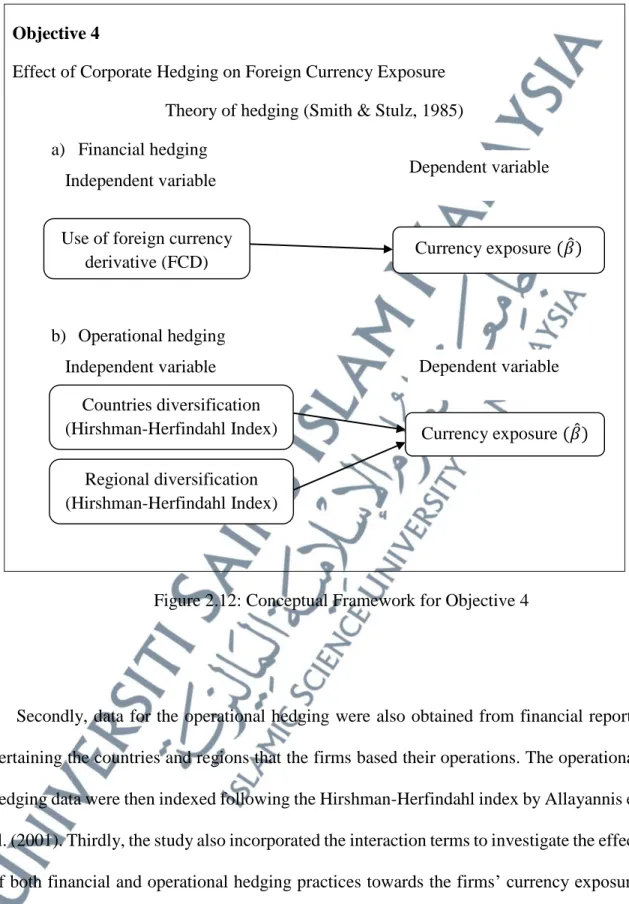
2.3.1.1 Theory of Hedging
According to the theory of hedging (Smith & Stulz, 1985), hedging minimises the exposure by eliminating any probable claim that may affect the company’s cash flow. Reducing unwanted noise in the cash flow is relevant with the maximisation of shareholder’s wealth principle. The arrival of numerous hedging tools and derivatives in the market has marked hedging as a signal of modern and advanced corporate investment management (Atilgan et al., 2013).
Despite the importance of foreign currency hedging in influencing foreign currency exposure, limited number of studies have been devoted to study the effectiveness of hedging activities. Specifically, for Malaysian firms, the scarcity is inclusive of both the financial and operational hedging in reducing the firms’
sensitivity to foreign currency exposure.
In the absence of market imperfections, hedging activities are connoted as not affecting the company value (Modigliani & Miller, 1958). However, hedging theories that were based on market imperfections postulated that hedging could
62
increase firm value through higher tax benefits and lower financial distress, underinvestment, and agency costs (Smith & Stulz, 1985; Bessembinder, 1991;
Froot et al., 1993). Similarly, Boyer and Marin (2013) stressed the significance of hedging to lower the firm’s risk of financial distress, volatility of the equity implied assets, and potential debt. In overall, currency hedging was said to effectively lower the potential risk that may arise from currency exposure and eventually increased the stock returns. The negative sign and the significance of beta on the regressions were often used to imply the effectiveness of hedging practice.
Smith and Stulz (1985) developed the positive hedging theory by treating hedging as a part of firm’s financial decision. They argued that derivatives mitigated the volatility of firm cash flows and reduced the expected payment of taxes, costs of financial distress, and agency costs. Reducing the cash flow volatility benefited the firm in several theoretical aspects. Smith and Stulz (1985) suggested that hedging could lower the cost of financial distress if the financial distress imposed some cost on the firms. Smoothening the firm off balance sheet enabled better control of firm risk and shielded from any uncertainties. Hence, the hedging provided both risk minimisation and firm-value maximisation benefits (Chong et al., 2014).
63 Managerial Risk Aversion
Hedging could also lower agency cost through reduction in potential cost of debt and risk-shifting while increasing the contractual relation between shareholders. Bessembinder (1991) found that hedging increased value by reducing agency costs. In tem of Malaysian market, managerial ownership leads to higher usage of derivatives (Ameer, 2010). Ameer (2010) recorded a significant relationship between managerial ownership and derivatives usage as the managers tried to reduce the risk affecting the return on their investment in the firms.
Hedging also reduced cash flow uncertainties and information asymmetry between managers and shareholders. Companies with a mixture of high institutional ownership and tighter financial constraints were more likely to hedge currency exposure using derivatives. Smooth cash flow also enabled maintenance of sufficient internal fund and hindered the firms from running into costly external financing in the market. Leland (1998) agreed that hedging resulted greater tax reductions for companies by increasing their debt capacity.
Additionally, hedging provided value-enhancing benefit due to the lower expected tax liabilities hence enabled maximisation of shareholder value.
Convexity of the tax function for a company lowered the expected taxes by reducing the variability of taxable income (Nance et al., 1993; Smith & Stulz, 1985). As long as the cost of hedging was not too large, the expected post-tax firm value increased in response to the lower variability of pre-tax firm value (Sprcic &
64
Sevic, 2012). As external funds were costlier than internal funds, hedging enabled the supply of sufficient internal funds for investment and avoided unnecessary external financing. In essence of managerial control, hedging was used to show the managers’ strategies in maximising firm value as well as their own personal wealth position (Sprcic & Sevic, 2012). The hedging practice would also communicate good managerial skills existing within the firms.
2.3.1.2 Hedging Techniques
There are a few hedging techniques employed by firms to hedge their exposure in consideration of the appreciation and depreciation of the currency. The hedging techniques managed to provide numerous advantages including the ability to forecast the market more accurately. A classic hedging practice that had been implemented by firms was natural hedging. Natural hedging involved risk management strategies that sought to mitigate risk by matching investments that were negatively correlated. In term of currency exposure hedging, firms would match the revenues and costs that they incurred through several mechanisms such as employing multi-currency loans and close observation on the movements of interest rates and exchange rates. Over time, firms had advanced to include other forms of hedging practices.
65
In-depth studies on hedging by Dӧhring (2008) and Liang et al. (2020) categorised hedging practices under a few specific groups such as financial hedging (such as exchange rate derivatives), operational hedging (operational setup), and financial instruments. Liang et al. (2020) clarified the significant benefit of hedging as coming from financial hedging while operational hedging did not help to lower the firms’ exposure. In other word, the study suggested the use of derivative to significantly protect the firm cash flow. Derivative was a good investment tool to hedge and mitigate currency exposure as it protected any transaction from unexpected currency movement (Spano, 2004). Additionally, the study argued the need to closely monitor the currency that was linked to the specific hedging strategy because every currency moved in their own pattern.
Wahab et al. (2017) specified hedging strategy into two types namely financial and operational hedging. Firstly, financial hedging could be segmented into two parts which were foreign currency derivative and money market hedging. The firms might adopt the foreign currency derivative such as forward, future and option contracts. Purchasing futures or forward contract could be done to hedge payables while selling the futures or forward contracts was appropriate to hedge receivables. Otherwise, the firms may opt to use money market hedge. In order to hedge payables, the firms may borrow its home currency and convert the proceeds into the foreign currency with potential future needs. Borrowing in the foreign currency to be received and converting the receivables into domestic currency was appropriate for firms to hedge their receivables. Another potential hedging
66
technique is the options contract. In this case, purchasing call options would hedge the payables while put options hedged the receivables. The options contract provided flexibility to exercise if the actual currency movements differed significantly from prediction. However, premium paid to acquire the options levelled out the flexibility offered by the contract.
On the other hand, operational hedging involves the process of protecting the underlying foreign transaction through operational activities within the firm’s framework such as foreign subsidiaries, competitiveness management, and business diversifications (Wahab et al., 2017). Effectiveness of hedging practices were assessed by observing their effects towards the firms’ currency exposure level. These hedging strategies were considered as effective if the exposure level decreased when the hedging practice was put in place. The relationship is the basic foundation of the analyse on the effectiveness of both financial and operational hedging towards the sample firms in this study.
2.3.1.3 Advantages and Disadvantages of Hedging
While the main objective of hedging was to increase financial stability and reduce the risk of financial distress, the debate on the effectiveness of hedging had been unresolved. Firms generally practised the hedging to protect their firm value by increasing financial stability and reducing the risk of financial distress. One of the advantages of hedging included the ability of the hedging tools to lock the
67
profit. Smith and Stulz (1985) recorded higher firm performance through the protection against profits volatility, expected tax liability, commodity price changes, inflation, currency exchange rate changes, and interest rate changes. With this, hedging also enabled the traders to increase their firm leverage and lowered the potential of financial distress (Leland, 1998). Bessembinder (1991) highlighted the benefit of hedging to lower underinvestment cost that was caused by agency cost and costly external financing. Additionally, hedging also saved time as it did not require constant monitoring or adjustment according to daily market volatility.
With the risks being controlled, the managers found it easier to construct any business planning.
Utilisation of certain hedging tools such as options for complex trading activities also enabled the trader to maximise the potential returns. Apart from the direct advantages of hedging, such risk management strategy further provided other distinct benefits in the form of signalling element. Having hedging practice in place signalled stable stock prices of the firms due to its ability to meet the hedging cost. Secondly, it also communicated the firm’s risk management and strategy appetites to the shareholders. After all, hedging was beneficial for the firms as some of the hedging derivatives incurred lesser cost compared to an insurance policy.
68
On the other hand, hedging could also inflict adverse effects on the practising firms. Satisfying managerial self-interest could cause bias in the hedging practise as the managers would opt for hedging technique that benefitted the individual rather than for the overall firms’ wellbeing (Hagelin et al., 2007). In addition, hedging could also become ineffective if it was used for speculative purpose instead of protection purpose (Bachiller et al., 2020). Using hedging instruments for speculative purpose would actually expose the firms to higher exposure if the strategy failed to provide the expected profit. The cost from conducting the hedging would actually eat up the profit amount.
As hedging involved utilisation of various derivative tools and investment strategies, the hedging practice would also turn out to be ineffective (Hagelin &
Pramborg, 2004). Like all investment strategies, complexity of hedging required good trading skills and experience among the investment managers. Inherent complexity arising from the derivatives contracts would eventually shift the firm into unintended risk exposures.
Hedging also provided minimal benefit when the market was performing well.
Under good market condition, risk variables such as commodity prices, foreign exchange rates and interest rates would be very dynamic. Thus, the risk management process should also be dynamic which may become burdensome for the managers to actively manage. Inability to pace up with the dynamic changes
69
meant not all risks were transferred through the hedging activities. Additional to the issue of dynamic monitoring, hedging activities were also bumped by poor communication existing among the firm’s managers. In this regard, poor communication referred to the ineffective dissemination of hedging strategy and the potential consequences from such problem. The managements were required to actively communicate their notion to the decision maker so as to lower the chances of miscommunication. Regular communication on the risk goals and warning signs of risks would establish a strong internal risk culture within the firm and minimise any potential loss from the specific investment decision.
On another note, Bae et al. (2018) argued that the effectiveness of hedging depended on the underlying conditions that occurred prior to the hedging implementation. Firms with positive forecasted exposure tended to reduce their hedging activities while firms that expected negative exposure increased their hedging intensity. Additionally, effectiveness of hedging was also shown to be affected by the conditions in the product market prior to engaging with the hedging activities. Hence, it was important for analysis on hedging practice to also take into account the conditions of the firms and market. Meta-analysis by Bachiller et al.
(2020) also attempted to draw the possibility of country driven factor towards the effectiveness of the hedging practice. Consideration of 51 past studies proved that hedging practice held the economic advantages for all firms especially from the developed countries. With this, in-depth study focusing on Malaysian market
70
would provide meaningful insight into the effectiveness and depth of the current hedging practice implemented by the sample firms. Such findings would be beneficial in modelling better and improved risk management strategies specifically customised to the Malaysian firms.
2.3.2 Incidences of Hedging Practice
Over time, hedging was regarded as a signal of modern and advanced corporate investment management due to its flexibility and non-stringent regulation (Atilgan et al., 2013). However, there were some disputes regarding the effectiveness of hedging practice. Arguments on the benefits of hedging were mostly based on the ability of the practice to offset the exposure arising from firms’ daily operations. Hedging also enabled non-financial firms to focus on their main activities without having to frequently scrutinise their exposure level. On the contrary, hedging could turn out to be detrimental under a few circumstances. Opting for a hedging position without considering the existing competitive pressure and the whole picture of the industry would give adverse effect towards the firms. Hence, it was crucial for firms to keep updated with ample information pertaining the hedging practice.
Hedging technique had been revolutionised to become more innovative and complex compared to its previous traditional implementation channels, namely the operational and financial hedging (Ameer, 2010). The improvement was due to the extensive literature committed to find the best strategical hedging technique for profit
71
maximisation purpose. According to Chaudhry et al. (2014), hedging increased firm values by reducing the opportunistic behaviour among investors. Otherwise, investors hedged their activities to shield themselves from unexpected risks, protected their wealth and provided compensation elements linked to firm values (Smith & Stulz, 1985). The arguments also concluded that firms’ hedging practice may mitigate potential underinvestment issues.
Mixed