The current amount of methane hydrate reserves in the world is greater than the total reserves of oil and natural gas combined. Currently, there has been no study testing the effectiveness of a mathematical model using data from different research articles focusing on the same area of interest. Therefore, the aim of this paper is to select different mathematical models that simulate the dissociation of methane hydrates in porous media with pressure reduction and finally to verify the effectiveness of the selected mathematical model by testing it with data from different research articles of the same scope. study.
Since the calculated mass formation rate follows the downward trend of the predicted mass formation rate, it is concluded that the Kim et al. 1987) is the most effective mathematical model for predicting the dissociation of methane hydrates in porous media. In order to improve the quality of the project, the mathematical model should be validated with several research articles that provide the necessary information. I would also like to thank the rest of the Petroleum Engineering Department for their support and assistance as my project progressed.
INTRODUCTION
- Background of Study
- Problem Statement
- Significance of Project
- Objectives and Scope of Study
- Relevancy and Feasibility of the Project
In most studies, the reliability of their mathematical models is tested by comparing theoretical data with experimental data. Currently, there has not been a study in which the efficiency of the mathematical model has been tested using data from different research papers focusing on the same area of interest. The mathematical model helps to manage methane production from its hydrate reservoir by predicting how much of the gas can be extracted over time.
Therefore, this project is important to validate the effectiveness of the chosen mathematical model. To verify the effectiveness of the chosen mathematical model by testing it with data from different research papers with the same scope of study. With ample time given and specific focus on the project, planning and changes can be done properly to achieve the project's goals.
LITERATURE REVIEW AND THEORY
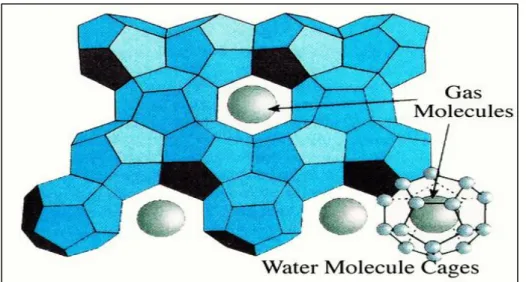
- Introduction to Methane Hydrates
- Mathematical Models
- Types of Simulator Used
- Initial Reservoir Conditions
- Experimental Data
- Outcome of the Research
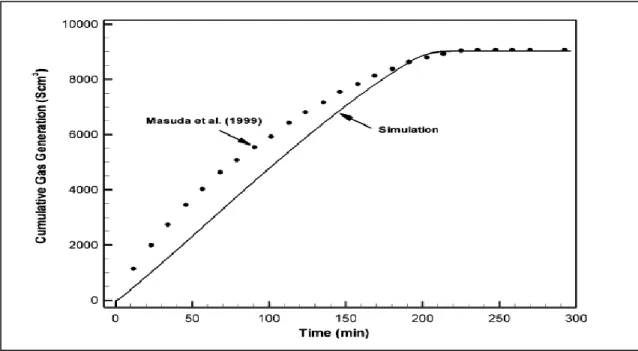
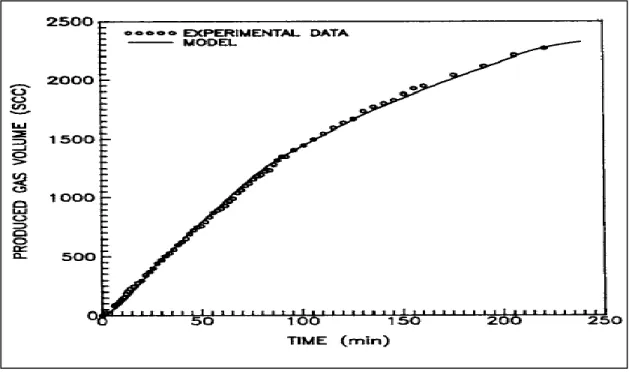
Similar to Youslf et al. 1991), the mathematical model of Nazridoust and Ahmadi (2007) was generated from the mathematical model developed by Kim et al. The theoretical result was then compared with the experimental data of Masuda et al. 1999), and it shows that the modeling data did not differ much from the experimental data. The study also built on the experimental data of Masuda et al. 1999), and the simulation shows great similarity with the experimental data.
This research focuses on the calculation of hydrate decomposition investigation radius using analytical formula and simulation (numerical). 7) The surface area of the hydrate particles is expressed as a function of the number of moles of methane in the hydrates. Nazridoust and Ahmadi (2007) GambitTM preprocessor Liang et al. 2010) Shahbazi and Pooladi-Dalvish 2D-asymmetric method. The initial thermal condition of the outlet valve pressure was similar to the ambient temperature.
At the onset of hydrate dissociation in the core sample, the temperatures in all points of the core sample for both simulation and experimental data drop to a minimum before rising again and approaching the ambient temperature. In a separate case study, the relationship between radius of investigation and square root of time was linear when the initial temperature and pressure of the reservoir were close to equilibrium. In other studies, the condition of the porosity is not clearly stated and is therefore assumed to be homogeneous throughout the core.
All the studies agreed that the process of hydrate dissociation occurs at the front rather than the whole volume. On the other hand, Nazridoust and Ahmadi (2007) and Liang et al. 2010 ) compared their simulation data with Masuda et al. 1999) experimental data using identical values of parameters. For example, simulation data by Youslf et al. 1991) that obtained a satisfactory match with the experimental data.
The slight discrepancy may be attributed to the lack of some experiment data (Liang et al., 2010).
METHODOLOGY AND PROJECT WORK
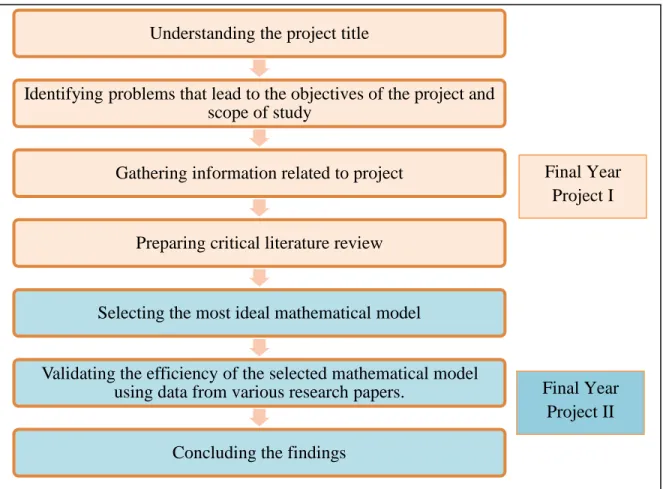
- Research Methodology
- Project Activities
- Calculations Procedure
- Software Used
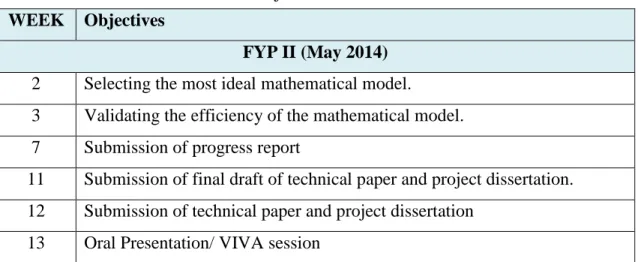
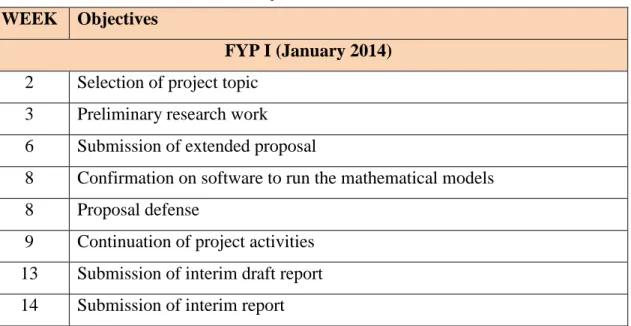
- Project Key Milestone for FYP I and FYP II
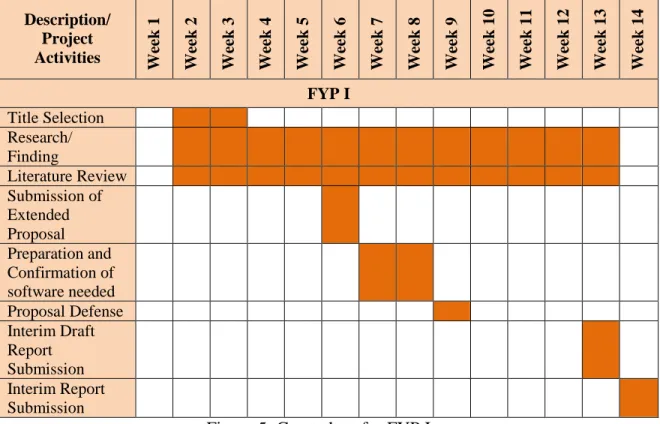
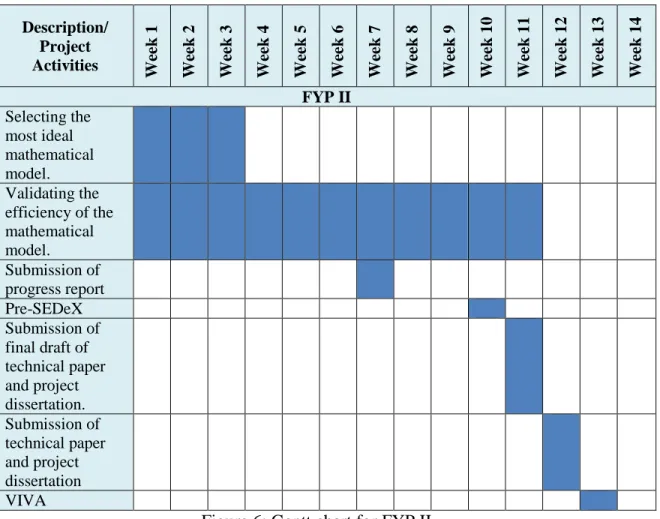
- Gantt Charts for FYP I and FYP II
This stage includes discussion with the supervisor, Ms. Mazlin, to get a clearer picture of the expected things to be done in the next two semesters. Identifying the problem related to the project is critical as it gives a clearer direction to the final outcome of the project. The scope of the study is clearly defined to ensure that the workflow runs smoothly within the specified time frame.
This report is important as it ensures that the project is moving in the direction that the project's goals will ultimately be achieved. This phase is the most crucial, which is to choose the most ideal mathematical model to be used until the end of the project. Some of the data is not available in the research papers and hence many assumptions are made at this stage which are mostly responsible for the significant percentage errors in the calculations.
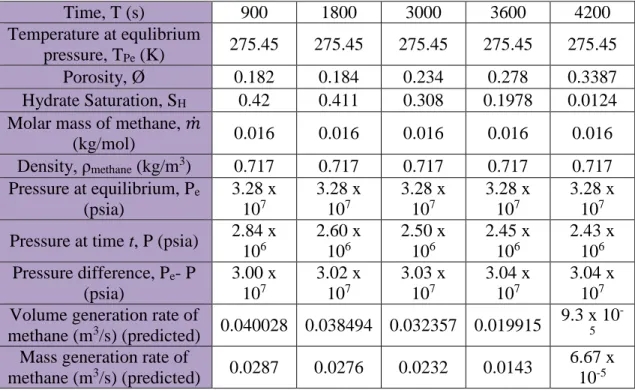
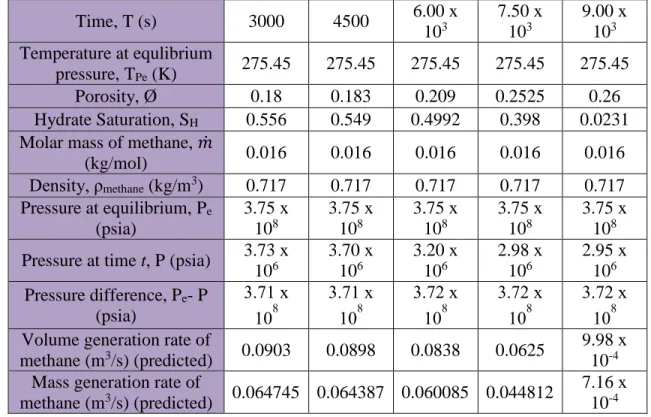
At the end of the project findings, recommendations for improving the project will be included along with whether or not the project objectives were achieved. Nazridoust and Ahmadi (2007) further defined their mathematical model to calculate the mass generation rate of gas and water per unit volume of the porous medium by hydrate dissociation. Like ∅, P, Sh, and T, theoretical methane mass generation rates at different times along the pressure drop during hydrate dissociation are determined from a plot of volume generation rate versus time.
The volume generation rate is converted to the mass production rate by multiplying it by the standard state methane density. Calculate the mass generation rate at various times along the pressure drop region during the dissociation process using equations 8 through 12. Compare the results with the theoretical (predicted/expected) mass generation rate with the calculated generation rate at measure over time.
To check how much the theoretical mass generation rate differs from the calculated mass generation rate, another similar plot is shown where the values of the theoretical mass generation rate are used on the x-axis.
RESULTS AND DISCUSSION
- The Most Ideal Mathematical Model
- Dissociation Rate Constant, k B
- Total Surface Area of Hydrates per Unit Volume, A HS
- Mass Generation Rate of Methane versus Time
According to Kumar et al. 2013), is found with history matching experimental and simulation results. According to Kumar et al. 2010), for hydrate saturations less than 35%, the habit of hydrate formation is assumed to be grain encrustation. For example, to calculate the total surface area of hydrates per unit volume for Nazridoust and Ahmadi (2007) at time = 3000 s,.
The error percentage is calculated to check the difference in value between the calculated and predicted methane mass generation rate at a given time. The difference between the value of the calculated and predicted rate of mass formation can also be displayed graphically. For the predicted graph line, the values of each x and y coordinate use the value of the predicted mass generation rate itself.
Regarding the calculated graph line, the value for x-coordinate is the value of the predicted mass generation rate at a similar time of occurrence, while the y-coordinate is the value of the calculated mass generation rate. This is consistent with the decreasing pattern of the mass generation rate of methane during the hydrate dissociation. It is also important to note that the calculated mass generation rate shows a similar decreasing pattern to that of the predicted mass generation rate.
The difference between the values of calculated and predicted mass generation rate can also be represented in another form of graph. For the predicted graph line, the values of each x and y coordinate use the value of the predicted mass generation rate itself. Regarding the calculated graph line, the value for x-coordinate is the value of the predicted mass generation rate at a similar time of occurrence, while the y-coordinate is the value of the calculated mass generation rate.
According to Kumar et al. 2010), for hydrate saturations less than 35%, the habit of hydrate formation is assumed to be grain encrustation. It is very important to note that only Kumar et al. 2010) conducted their own experiment and came to their own results. Despite the large percentage of error, the application of Kim et al. 1987) mathematical model shows a promising result, as all measured mass formation rates show similar.
CONCLUSION AND RECOMMENDATION
Conclusion
Recommendations
The error could have been largely minimized if more information had been given in the research papers and fewer assumptions had been made in calculations. Even so, because the calculated results follow a similar pattern to that of the predicted data, Kim et al. 1987) mathematical model may be the most efficient model to predict the dissociation of methane hydrates in porous media. Retrieved February 11, 2014, from http://www.greeningofoil.com/post/Methane-hydrate-a-future- clean-energy-source.aspx.
Retrieved February 11, 2014 from http://www.nationaljournal.com/energy/is-methane-hydrate-the-energy-source-of-the-future-20131224. Retrieved February 11, 2014 from http://noc.ac.uk/science-technology/earth-ocean-system/seafloor/hydrate-dissociation. SS gas hydrate: numerical analysis of the rate determinants of depressurization induced gas production from methane hydrate nuclei.
Investigation of the variation of the surface area of gas hydrates during dissociation by depressurization in porous media. Experimental determination of permeability in the presence of hydrates and its effect on the dissociation properties of gas hydrates in porous media. An introduction to natural gas hydrate/clathrate: the major organic carbon reserve of the earth.