CO2 Capture Using Amino Acid Salt Solution
by
Muhammad Izzat Bin Ridzuan 16934
Dissertation submitted in partial fulfilment of the requirements for the
Bachelor of Engineering (Hons) (Chemical Engineering)
MAY 2015
Universiti Teknologi PETRONAS 32610 Bandar Seri Iskandar Perak Darul Ridzuan
ii
CERTIFICATION OF APPROVAL
CO2 Capture Using Amino Acid Salt Solution
by
Muhammad Izzat Bin Ridzuan 16934
A project dissertation submitted to the Chemical Engineering Programme Universiti Teknologi PETRONAS in partial fulfilment of the requirement for the
BACHELOR OF ENGINEERING (Hons) (CHEMICAL ENGINEERING)
Approved by,
____________________
(Dr Muhammad Ayoub)
UNIVERSITI TEKNOLOGI PETRONAS BANDAR SERI ISKANDAR, PERAK
May 2015
iii
CERTIFICATION OF ORIGINALITY
This is to certify that I am responsible for the work submitted in this project, that the original work is my own except specified in the references and acknowledgement, and that the original work contained herein have not been undertaken or done by unspecified sources or persons.
________________________________
MUHAMMAD IZZAT BIN RIDZUAN
iv
ABSTRACT
The concern of climate change and global warming has consecutively risen to progress research fields pledging to find the possible solutions. Increasing use of fossil fuels leads to an increase in CO2 emission and has become a major task to be deal with. For industrial applications, aqueous solutions of amines are extensively used as chemical absorbent or solvent. However, amine reaction with CO2 results in stable carbamate formation, which in turn leads to high energy usage for regeneration and promote additional corrosion problems. To overcome these restrictions, this study proposes a methodology to analyze the performance of new solvent namely amino acid salt solution. Evaluation of solvent performance in terms of CO2 loading and designing of acid gas removal system, requires pressure solubility data and design properties like density, pH value and refractive index.
v
ACKNOWLEDGEMENT
I would like to express my deepest gratitude to the Chemical Engineering Department of Universiti Teknologi PETRONAS (UTP) for giving me a chance to carry out this significant Final Year Project (FYP). The knowledge gained throughout these four years will be put together and test by research and solving the problem given in this project.
A very special note of appreciations to my supervisor, Dr Muhammad Ayoub, whom always willing to assist and provide me with outstanding support throughout the project development. His excellent guidance and support brought a great impact upon the completion of the project.
I would also like to thank all lecturers from Universiti Teknologi PETRONAS (UTP) who had given me guidance throughout the period of the project. Last but not least, my earnest gratitude goes to my beloved family and friends for providing me continuous support throughout this project.
vi
TABLE OF CONTENTS
CERTIFICATION OF APPROVAL ii
CERTIFICATION OF ORIGINALITY iii
ABSTRACT iv
ACKNOWLEDGEMENT v
TABLE OF CONTENTS vi
LIST OF FIGURES vii
LIST OF TABLES vii
CHAPTER 1: INTRODUCTION 1
1.1 Background of Study 1
1.2 Problem Statement 5
1.3 Research Objectives 6
1.4 Scope of the study 6
CHAPTER 2: LITERATURE REVIEW 7
CHAPTER 3: METHODOLOGY 14
3.1 Materials 14
3.2 Solubility Measurements 15
3.3 Thermophysical Properties of Amino Acid Salt Solvents 19
3.4 Process Flow of the Research Project 21
3.5 Gantt Chart of FYP I 22
3.6 Gantt Chart of FYP II 23
3.7 Key Milestones 24
CHAPTER 4: RESULTS AND DISCUSSION 25
4.1 Thermophysical Properties of Amino Acid Salt Solution 25
4.2 Solubility Testing 29
CHAPTER 5: CONCLUSION AND RECOMMENDATION 34
REFERENCES 35
vii LIST OF FIGURES
FIGURE 1 Amount of CO2 present in the atmosphere from 1850 and following ... 1
FIGURE 2 Global Greenhouse Gas Emission... 2
FIGURE 3 Non-sterically hindered amines ... 11
FIGURE 4 Sterically hindered amines ... 13
FIGURE 5 High pressure gas solubility equipment ... 15
FIGURE 6 High pressure gas solubility unit... 16
FIGURE 7 Main control unit ... 16
FIGURE 8 Schematic diagram for high pressure gas solubility cell ... 17
FIGURE 9 Methodology flow chart ... 21
FIGURE 10 Graph of solubility testing at 30 oC ... 30
FIGURE 11 Graph of solubility testing at 40 oC ... 31
FIGURE 12 Graph of solubility testing at 50 oC ... 32
FIGURE 13 Solubility of L-prolinate salt solution ... 33
LIST OF TABLES TABLE 1 Density of 10% of sodium glycinate, 2% of piperazine, 88% of water ... 25
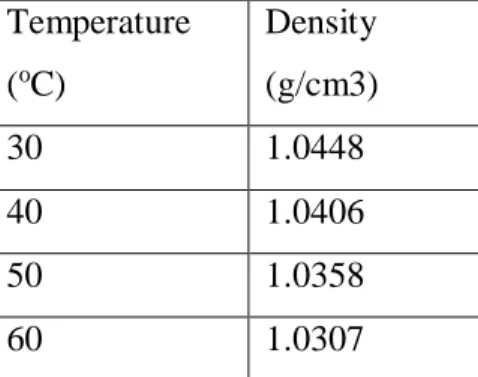
TABLE 2 Density of 10% of sodium glycinate, 5% of piperazine, 85% of water ... 25
TABLE 3 Density of 20% of sodium glycinate, 2% of piperazine, 78% of water ... 26
TABLE 4 Density of 20% of sodium glycinate, 5% of piperazine, 75% of water ... 26
TABLE 5 Density of 30% of sodium glycinate, 2% of piperazine, 68% of water ... 26
TABLE 6 Density of 30% of sodium glycinate, 5% of piperazine, 65% of water ... 27
TABLE 7 pH value testing result ... 27
TABLE 8 Refractive index testing result ... 28
TABLE 9 Solubility testing at 30 oC ... 30
TABLE 10 Solubility testing at 40 oC ... 31
TABLE 11 Solubility testing at 50 oC ... 32
1
CHAPTER 1 INTRODUCTION 1.1 Background of Study
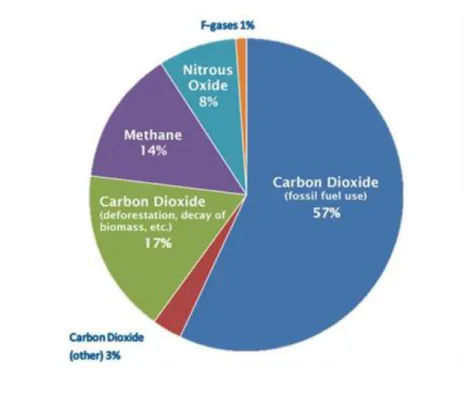
The increment of global CO2 emission has arisen multiple concerns related to environmental issues. The amount of CO2 present in the atmosphere have increase significantly and will show tremendous uprising if no proper action to be taken to deal with this issue [1]. This issue is related to extensive use of the fossil fuel but somehow, it is common as fossil fuel plays major role in compromising the current energy demand and consumption.
FIGURE 1 Amount of CO2 present in the atmosphere from 1850 and following
2
FIGURE 2 Global Greenhouse Gas Emission
Carbon capture and storage (CCS) schemes embody a group of technologies for the capture of CO2 from power plants, followed by compression, transport, and permanent storage [2]. It will also enhance other important plans like improving energy efficiency, shifting to low carbon concentrated fuels and more use of renewable resources which will counterpart the reduction of CO2 emissions. A main concern is that the deployment of CCS schemes is a complicated problem that requires joint vision and worldwide collaborative efforts.
There are three identified areas for successful CO2 emissions reduction in industries;
separation from flue gases at power plants, fuel gas (syngas), and sour natural gas.
CO2 is the by-product of ammonia and hydrogen production process. Higher presence of CO2 in natural gas decrease the octane number or heating value and also due to its acidic nature it creates corrosion problems in pipelines during the transmission and while processing it in the equipment’s [3]. Besides, the burning of natural gas further leads to increase in CO2 emissions into the atmosphere.
There are many technologies which can be used for CO2 capturing: adsorption (both physical and chemical), cryogenics separation, membranes separation and absorption.
3
Nonetheless, each method has its own limitations, advantages and disadvantages which are conferred as mentioned:
Adsorption is the adhesion of molecules from a gas, liquid or dissolved solid (solute) to the surface in which a film of absorbate is formed on the surface of the absorbent [4]. Some of common adsorbents used for CO2 capture are activated carbon, metallic oxides and zeolites. The removal of CO2 gas via adsorption contains two steps: (1) adsorption of gas in the adsorbents to achieve equilibrium, (2) regeneration of adsorbents for the reuse. The regeneration of absorbents is usually done by the implementation of heat commonly called Temperature Swing absorption (TSA) or by reducing the system pressure called as Pressure Swing adsorption, (PSA). However these adsorption systems are not suitable for industrial separation of CO2. At such scale, the most available adsorbents have low adsorption capacity and low selectivity towards CO2 since the flue gases generally consists of low CO2 concentrations.
In cryogenic separation, CO2 is separated from other gases by lowering the temperature and increasing the pressure to equilibrium conditions [5]. CO2 reaches its triple point at 5.18 bar pressure and -56.6ºC temperature, below these conditions no liquefaction can occur. Above these critical conditions, CO2 can be separated partially but if required in purer form then the process is preceded by distillation step. In industry, this process is generally used for streams that have high CO2 concentrations (commonly > 90%) but cannot be used for dilute or moderate streams. Since this process allows thorough manufacture of liquid CO2 via natural gas sweetening, which is easy to transport as there is no need for latter compression. The biggest disadvantage of this process is that the bulk of energy is wasted in the refrigeration of the process, mainly in the diluted gas streams. And also to circumvent the obstruction, other components like water vapour need to be removed first from the stream before cooling the gas. Moreover, an additional separation is required at sweetening stage due to presence of almost 10% hydrocarbons along with CO2 which in turns increase the extra cost and contribute to overall high installation costs.
For membranes separation, membranes act as thin hurdles which allow only selected gases to pass through. There are different types of separation membranes such as polymeric membranes, permeable inorganic membranes and zeolites [4]. As of now there are no industrial applications of membrane for the capturing of CO2 gas from
4
flue streams at large scale due to the presence of NOx, SOx and fly ash but can be used for small scale and off-shore application due to compact size. Also this process is generally used for hydrogen gas recovery in ammonia manufacture, natural gas dehydration as well as acid gas removal from natural gas. This process does have a few advantages like the system is lightweight, compact and requires low maintenance because the system doesn’t have any moving parts in the unit [6]. However, high capital cost and low performance of membrane systems for bulk CO2 removal restricts use of membranes. To achieve effective separation, multiple stages of the membranes or recycle streams are needed to be used in the system, this results in further complication and more energy consumption and costs. Much progress is needed over membranes so that it can be made commercially viable.
There are two types of absorption: physical absorption and chemical absorption. In physical absorption, a liquid solvent absorbs a gas mixture or a part of it. The dissolved gas develops weak interaction with solvent which helps in the recovery of solvents through desorption. It usually happens at high CO2 concentrated streams because the major energy demand emerges from the flue gas pressurization. That’s why physical absorption is not feasible for commercial purpose where CO2 partial pressures are much lower. Typical examples of physical absorption include ammonia in water and hydrocarbons in oil.
In chemical absorption, the flue stream is treated with a selected solvent (amines) which form weakly bonded transition compound and then the solvent can be regenerated using the application of heat. The efficiency of this process is relatively high [7]. Chemical absorption is used instead of physical absorption for many technological processes, like the absorption of CO2 using alkanolamines like monoethanolamine (MEA), diethanolamine (DEA), methyldiethanolamine (MDEA), 2-amino-2-methyl-1-propanol (AMP), blends of amines piperazine (PZ), Lipophilic amine solvents like dipropylamine (DPA) & n,n-dimethylcyclohexylamine (DMCA) and their blends [8].
A typical amine gas treating unit involves two stages; absorber unit and regeneration unit. In absorption unit, the upcoming flue gas stream comes into contact with the down-flowing amine solution which absorbs the acidic gas (mainly CO2). Now the CO2 rich amine solution is pumped to the regeneration unit, where the solvent is
5
extracted with the application of heat and the lean amine solution is then again recycled back to the absorber unit for reuse.
However the regeneration of loaded solvent requires high amount of energy and causes corrosion problem and also oxidative degradation is a big concern. Therefore, new solvents with improved characteristics of lower heat of regeneration, high CO2 loading capacity and fast reaction kinetics needed to be explored [9]. To handle these problems an unique solvent is needed to be discovered.
1.2 Problem Statement
The availability of the data for the amino acid salt solution, especially in related to thermodynamic equilibrium solubility at any pressure and temperature conditions is not readily available and no valid measure was made to evaluate the performance of the selected system in terms of their CO2 loading for the initial range of pressure and temperature. It is because of the absence of pressure solubility data for the amino acid salt solution, which is needed to be derived in order to design effective CO2 high pressure separation systems. In addition to this, the important thermophysical properties data like density, viscosity, refractive index and thermal stability in designing acid gas removal system are not accessible. Therefore, measuring the design properties at the same temperature and pressure and possibly applying an appropriate thermodynamic model to represent the high pressure equilibrium solubility data will indicate an important significant.
6 1.3 Research Objectives
Following are the objectives of this proposed work:
- To assess the solvent performance in terms of CO2 loading for wide variety of temperature and pressure conditions for industrial applications and to get optimized mixture concentration for effective CO2 series.
- To measure the thermophysical properties that includes density, pH value, and refractive index.
- To compare the thermodynamic solubility data of the given solvents with the conventional alkanolamines.
1.4 Scope of the study
In this work, we will study several amino acid salt solutions, obtained and derived from the possible amino acid used: glycine, in order to assess their potential application for effective CO2 removal and capture. For this purpose, equilibrium solubility experiments will be performed to evaluate the solvents performance in terms of their CO2 loading capability. Solubility experiments will be performed at industrially basis absorption temperature range of 303.15 - 343.15K and pressure will be diverse from 1-20 bar in order to see the starting variation in CO2 loading and capacity. Solubility results will be validated and compared with the solubility results of conventional alkanolamines [10]. Thermophysical properties are important in designing of acid gas removal system which includes density, pH value, refractive index, viscosity and thermal stability will be experimentally measured using highly accurate equipment and empirical correlation will be developed [11]. This information assembly using the above mentioned tools and modelling work can be further used to improve an alternate process for CO2 removal which can contribute to reduce the greenhouse gases emissions in a considerably enhanced approach.
7
CHAPTER 2
LITERATURE REVIEW
Typically primary and secondary based amine solvents form carbamates upon reaction with CO2. The rate of hydrolysis of these carbamates into bicarbonates depends upon the stability of the carbamate. Carbamate formation is main and fast reaction during absorption, makes this step the most decisive in finding the CO2 absorption capacity as well as the CO2 regeneration energy requirement [12]. The CO2 loading capacity of tertiary amine is higher than that of primary and secondary amines because only a small part of carbamate molecules is hydrolysed into hydrogen carbonates. However, tertiary amines have relatively low reactivity towards CO2. The tertiary amines react according to base catalysed reactions with the existence of water avoid the formation of carbamate. Thus, minor amounts of primary and secondary amines are mixed together into tertiary amines in boosting the CO2 absorption rates. To simplify, there are some of disadvantages deal with the conventional alkanolamines used as absorbents listed:
Low capacity
Low absorption rate
High regeneration cost
Degradation
Corrosion
A new proposed solvent, which is the amino acid salt solution, is subjected to have more advantages as compare to the conventional alkanolamine [13]. The features are:
Fast reaction kinetics
High achievable cyclic loading
Good stability towards oxygen
Favorable binding energy.
8
Once CO2 loading exceeds certain value, the solid precipitate is formed from the amino acid salt solution [14]. This precipitate is made up of either neutral amino acid molecule or bicarbonate salt. This condition cause the chemical reaction equilibria shifted along with the result, letting the equilibrium CO2 pressure to remain constant as the loading keep on increasing. This implied that the driving force for the absorption can be moderated and maintained at higher level with respect to higher loading, improving the absorber performance. Besides, higher loading resulted in reduced energy consumption during regeneration. This founding lead to the design of specific absorption process based on precipitating amino acid [15].
In the process, the amino acid salts are used for the absorption of the CO2 [16]. These salts obtained through neutralization of amino acid with base, for example, potassium hydroxide. As pure amino acid (HOOC-R-NH2) is dissolved in water, the related equilibria derived:
2 3
3 OOC R NH OOC R NH
NH R HOOC
H
H
(1)In the solution, the neutral molecule exists in dipole, due to the carboxylic group losing a proton while amine group is protonated. When amino acid reacts with potassium hydroxide, a proton is removed from –NH3+ group resulted in formation of potassium salt:
O H NH R OOC K
KOH NH
R
OOC 3 2 2
(2)
Potassium salt is the active components, reacts with CO2 like usual amine thru NH2
group, increasing the solubility due to the neutralization.
Later, the neutralized potassium salts of amino acids will react as following the same way of usual reaction between amines and CO2; via formation of carbamate and bicarbonate.
Carbamate formation for primary and secondary amine equation is:
2 3
2 2 OOC R NH OOC R NH COO OOC R NH
CO (3)
9 Carbamate hydrolysis equation is:
OOCRNHCOO H2O OOCRNH2 HCO3 (4) Bicarbonate formation for tertiary amines and sterically hindered secondary amines equation:
2 2 3 3
2 OOC R NH H O OOC R NH HCO
CO (5)
For carbamate hydrolysis, the reaction did not involve primary amine, so the major CO2 absorption will be in the form of carbamate [11]. For each CO2 molecule absorbed, it will form one molecule of carbamate and one protonated amine molecule.
This indicates that two amino acid salts are needed in absorption of one molecule of CO2.
There are three major factors that influence the basicity of amine molecule. Each of the factors influences the basicity in different way. Every alkyl group has a tendency to release electrons, which increases the electronegativity and stabilize the positively charged nitrogen atom. So, on increasing the alkyl group will further increase the base strength of the amine molecule. Consequently, in gas phase the overall base strength of amine molecule is affected mainly by electronegativity of the central nitrogen atom which is in order of: R3N > R2NH > RNH2 > NH3. But in case of aqueous solution, other factors like solubilisation and steric effect also play role in influencing the basic strength of the amine molecule. Therefore, the aqueous solution basicity in aliphatic amines is in order of: R2NH > RNH2 > R3N > NH3. Studies show that inductive effect caused by alkyl groups decreases upon rapidly increasing the distance from the central nitrogen atom [17]. Now we know that on increasing the electron density of the nitrogen atom will further increase the basic strength of the amine molecule.
Therefore, in order to increase the electron density an electron donor group should be attached near the nitrogen atom.
In aqueous solution of amines, ammonium ion (protonated amine) and hydroxyl ion (strongest base) is formed. Due to hydrogen bonding upon amine-water mixing, more hydrogen atom will get attached to nitrogen atoms resulting in increasing the solubility in water. Most of the amine molecules are randomly distributed, so their interaction with water form intermolecular hydrogen bonding interaction which is weak (13-42
10
kJ/mol) compare to a single covalent bond (210-420 kJ/mol), but are approximately ten times stronger than Vander waal forces [18]. On increasing the alkyl chain group size, the aqueous solubility decreases. The alkyl group having linear chain has the lowest solubility in comparison to branched chain and cyclic structure alkyl substituent because as the sphericity of the molecule increases, its hydrophobic character decreases.
Steric effect will play its role alongside solubilisation effect to effect the base strength of the amine molecules. Amines having large alkyl groups hinder the attachment of nitrogen atom to the proton, which in turn decrease the base strength as well as rate of absorption.
Non-sterically hindered amines Ammonia
Methylamine
Monoethanolamine (MEA)
Diethanolamine (DEA)
Propylamine (PA)
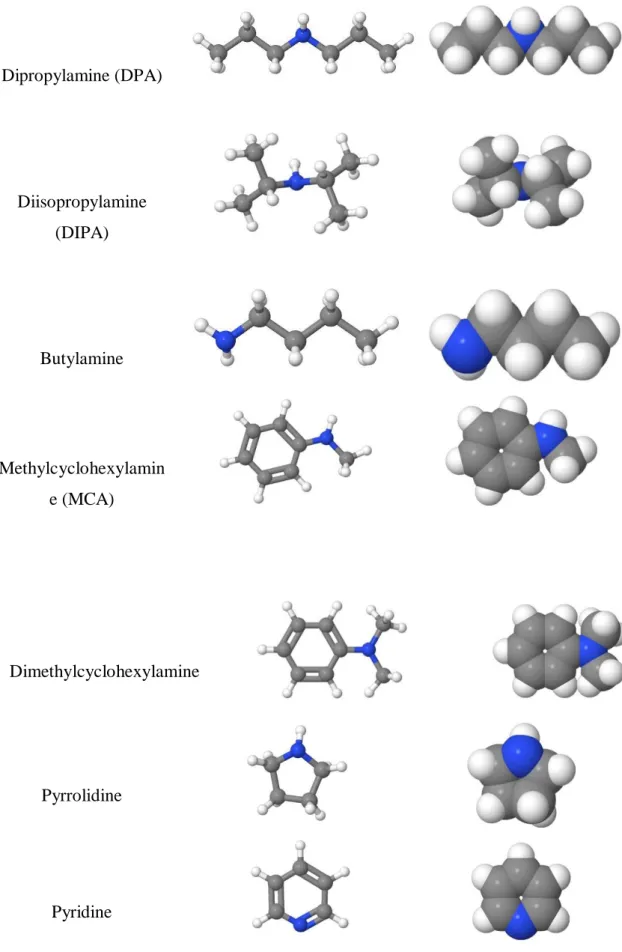
11 Dipropylamine (DPA)
Diisopropylamine (DIPA)
Butylamine
Methylcyclohexylamin e (MCA)
Dimethylcyclohexylamine
Pyrrolidine
Pyridine
FIGURE 3 Non-sterically hindered amines
12
Sterically hindered amines
Isobutylamine
Sec-butylamine
Di-sec-butylamine (DSBA)
2-amino-2- hydroxymethyl- 1,3-propanediol
(AHPD)
2-Amino-2- methyl-1-propanol
(AMP)
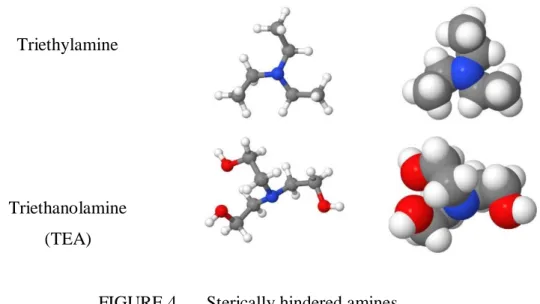
13 Triethylamine
Triethanolamine (TEA)
FIGURE 4 Sterically hindered amines
The influence of steric effect is more visible in secondary and tertiary amines due to alkyl group hindrance. In secondary amines, the pKb values are lower than primary and tertiary amines, which is mainly due to inductive effect rather than the solubility and steric effect. But in case of tertiary amines, the union of both solubility and steric effect is dominant in determine the base strength of the amines [19].
Several concepts have been investigated to circumvent the high energy demand, e.g.
the usage of sterically hindered amines such as 2-amino-2-methyl-1 propanol (AMP), the first sterically hindered amine was discovered 24 years ago, which has a rate lower than its corresponding primary amine, ethanolamine, due to its steric effect but is still very encouraging and is still being investigated today [20]. Low carbamate stability due to its steric effect results in lower energy consumption for regeneration.
14 CHAPTER 3 METHODOLOGY
In this proposed work, we will use several solvents, gases and equipment to analyze the performance and characterization of the solvents [21]. The equipment used follows some principle and operation which is discussed in the following section.
3.1 Materials
We will use several solvents in this research work for CO2 absorption process. Amino acid that used as solvents is glycine. All these solvents are ordered from Merck Sdn Bhd, Malaysia with a purity of 99% each and will be used without any further purification. The base used will be Sodium Hydroxide in pellet form, obtained from the Chemical Engineering Department Laboratory. The aqueous solutions of the above mentioned amino acids and base will be prepared on weight percentage using an analytical balance (model AS120S, Mettler Toledo) with a precision of ± 0.0001g and we considered the solution to be equimolar. The weight percentage of the solution used is 10%, 20% and 30%. For each of the solution prepared, 2% and 5% weight percentage of piperazine will be added. The aqueous solutions will be prepared using the distilled water, and measurements for each sample will be performed in duplicate.
The basis of the solution is 100 gram for each of the solution prepared. Average values will be used in reporting. The purified gases such as carbon dioxide and nitrogen with a purity of 99.99% both respectively are also obtained from the laboratory. There are also other equipment that we will used for the calculation of pressure solubility data and to measure the thermophysical properties. The details of equipment are as follows.
15 3.2 Solubility Measurements
The solubility of a gas is a thermodynamic property in which solvent and gas are brought in contact with each other under specific operating conditions of pressure and temperature which results in absorption of gas in the solvent [21]. This absorbed amount of the gas in the solvent is termed as gas loading. The solubility of gas in aqueous solutions of amino acid salt solutions will be measured in a high pressure solubility cell and the method of measuring the solubility is deliberated:
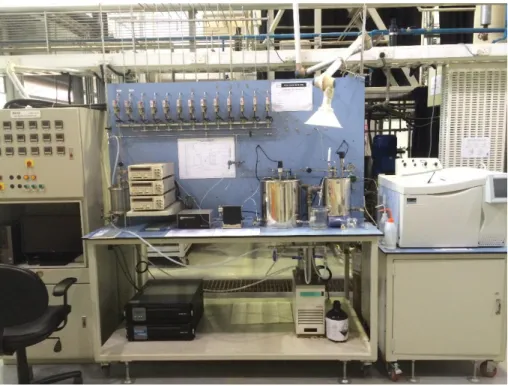
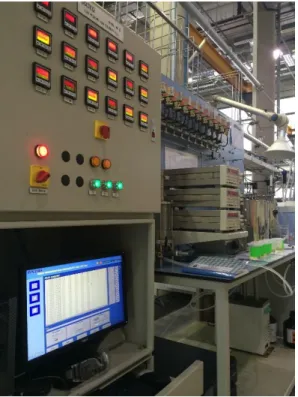
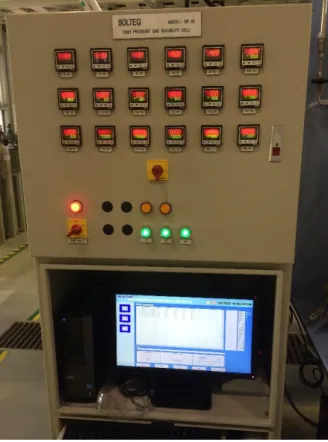
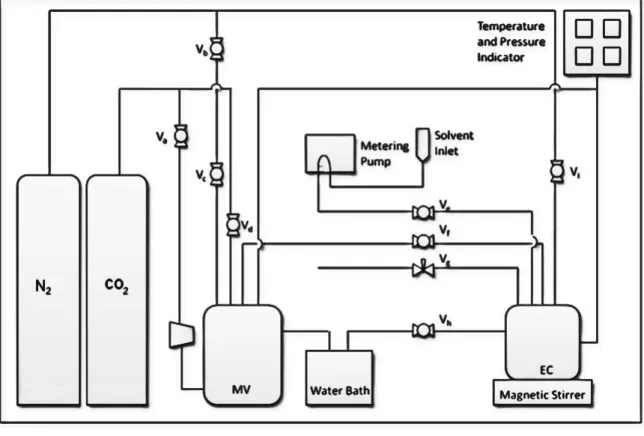
The high pressure solubility cell SOLTEQ Model: BP22 was fabricated and installed by Solution Engineering Sdn Bhd, Malaysia as shown in Figure 7, Figure 8 and Figure 9. This high pressure solubility cell is proficient of measuring pressure up to 100 bars and temperature up to 353.15K. The cell comprises of three main units, namely (i) Gas supply unit, (ii) Gas solubility cell and (iii) data acquisition and logging system for data log and online monitoring of experiment.
FIGURE 5 High pressure gas solubility equipment
16
FIGURE 6 High pressure gas solubility unit
FIGURE 7 Main control unit
17
FIGURE 8 Schematic diagram for high pressure gas solubility cell where,
MV: Mixing Vessel
EC: Equilibrium Cell / Solubility Vessel Va: Air Valve (at the back)
Vb: Vent Valve (at the back) Vc: N2 to MV Valve
Vd: CO2 to MV Valve Ve: Solvent to EC valve Vf: MV to EC valve Vg: Sample Outlet Valve Vh: Water Valve
Vi: N2 to EC valve
18
The solubility measurements of gas will be conducted in a high pressure solubility cell. The set up involves two vessels, first mixing vessel (3L) in which gas pressure is raised up to 6000kPa and other one is equilibrium cell (50mL) where solubility measurements are to be done. Initially both vessels are purged with nitrogen and then the mixing vessel is pressurized from 50kPa to 6000kPa so as to avoid any contamination in the vessels. The pressure of the system is measured using digital pressure indicator (Druck DPI 150) with a precision of ± 1.0kPa for a range of 0kPa to 10,000kPa. The temperature of the system is maintained by thermostat water bath Julabo with an uncertainty of ± 0.1ºC and the inside temperature of the mixing vessel and equilibrium cell is measured by Yokogawa (7653) digital thermometer with an accuracy of ± 0.01ºC. Originally vacuum is created inside equilibrium cell and 5 mL of aqueous solution is fed using metering pump. The temperature of the cell is then adjusted to the required value and pressure is noted. At this point, solvent exists under its own vapor pressure Pv. The CO2 is then transferred from mixing vessel to equilibrium cell with the stirrer on. The moles of CO2 transferred can be calculated using pressure drop, volume of vessel and temperature by the following equation:
2 2 1 1
2 z
P z P RT n V
a T CO
(6) Here VT is the volume of the gas container i.e. mixing vessel, z1 and z2 are the compressibility factors for pressure’s P1 and P2, R is the real gas constant and Ta is the ambient temperature. The compressibility factors can be calculated using Peng Robinson equation of state (EOS). After almost 2-3hrs, when there is no change in pressure drop in the solubility cell, then we can assume that thermodynamic equilibrium has been achieved. Pressure value recorded at this time is termed equilibrium pressure (PCO2). It can also be calculated by the following equation:
V T
CO P P
P
2 (7)
Here PT represents the total pressure and PV represents vapor pressure of solutions.
The remaining moles of CO2 in the gas phase ng can be calculated by equilibrium pressure (PCO2), temperature and overhead gas volume by using the following equation:
19 RT Z
P n V
CO CO g gCO
2
2 2
(8) The solubility is then calculated as volume of CO2, assuming the solution is equimolar, using the gas equation:
P
VCO2 RT (9)
3.3 Thermophysical Properties of Amino Acid Salt Solvents
The thermophysical properties are important in designing of absorption columns.
These properties, which include density, refractive index, viscosity and thermal stability of aqueous solutions of amino acid salt, can be measured experimentally over a wide range of operating conditions [22]. There are some equipment that can be used to measure the above mentioned properties which follow basic principle and procedure. In the following sections, we will discuss about the methods which are used in measuring the respective properties.
The density of the aqueous solutions of the amino acid salt is measured using a density meter (model DMA 5000, Anton Paar, Austria) at temperatures from 303.15 to 353.15 K with a built in platinum resistance thermometer having an uncertainty of ± 0.01 K.
The apparatus is calibrated by measuring the density of distilled water at regular intervals according to the supplier instructions and is compared with the water density bibliography given in the manual. The method adopted for the measurement of density of all the samples are explained in the following steps.
For cleaning and drying of measuring cell, a suitable solvent (volatile, capable to dissolve residue) i.e., acetone in this case, is injected several times in the measuring cell to avoid any contamination from the residues left behind by earlier samples. Later, dry air is blown through the measuring cell using a built in air pump for approx. 5 minutes (as recommended in the manual).
20
Later, for measurement setting, the procedure of accurate density measurement is totally dependent on the measurement settings which includes equilibrium mode, viscosity correction and temperature scan steps. The settings for density measurement of all samples is adjusted to work at medium equilibrium mode with automatic viscosity correction method of <700 mPa.s and 5K step increment of temperature within the initial and final temperature range.
The predefined quantity of the sample (approx. 2 mL) is filled in a syringe and slowly injected in U-tube measuring cell (0.7 mL) ensuring that there is no bubble in the cell by viewing through the optical glass window. The preset method is activated to start the density measurement and simultaneously recording the data in the equipment memory.
The refractive index of the corresponding aqueous solutions of amino acid salt is measured using a digital refractometer (Atago, RX-5000 alpha). This refractometer cover a wide range of temperature from 298.15 K to 333.15 K and temperature is controlled within ± 0.05 K. The refractometer is calibrated before every sample measurement using distilled water and checked with pure liquids of known refractive indices. The reported values will be the average of five measurements.
The pH value of each aqueous solution of amino acid salt solution is measure using pH meter. pH meter is operated at room temperature and calibrated using distilled water before each sample is tested. The reported values will be average of three times measurements.
Previously we have discussed the proposed methods to experimentally measure thermodynamic properties and pressure solubility data. The comparison of the data for selected amino acid salt solutions with the conventional amines which are currently being used for CO2 absorption is studied [14].
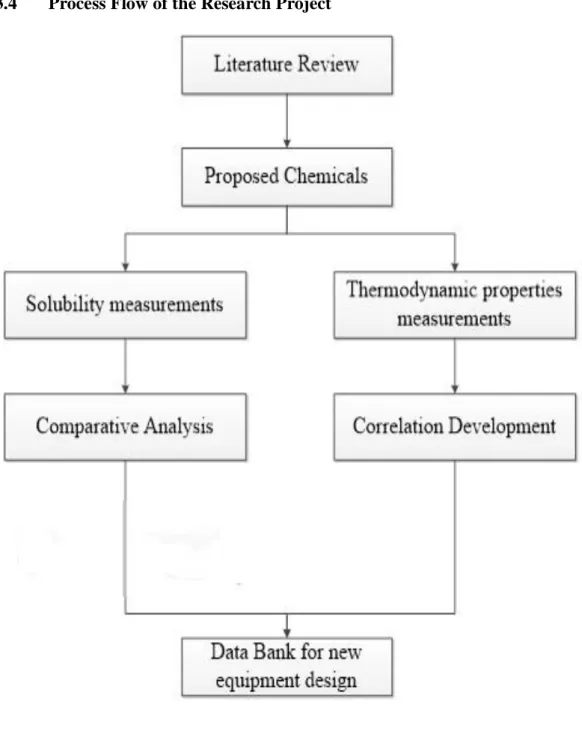
21 3.4 Process Flow of the Research Project
FIGURE 9 Methodology flow chart
22 3.5 Gantt Chart of FYP I
Week
Date
1 2 3 4 5 6 7 8 9 10 11 12 13 14
14/1 4/3 18/3 1/4 8/4
Selection of Final Year Project title X
Preliminary research work: Perform literature review related to the research project.
Prepare the methodology of the experimental work.
Identify the chemicals and equipment to be used in the project
Submission of Extended Proposal to the SV and Coordinator.
X Prepare the presentation slide for Project Proposal Defence.
Project Proposal Defence X
Chemicals acquisition.
Interim report writing.
Submission of Draft Interim Report to SV. X
Submission of Final Interim Report (after correction). X
23 3.6 Gantt Chart of FYP II
Week
Date
1 2 3 4 5 6 7 8 9 10 11 12 13 14
Chemical acquisation.
Sample preparation.
Sample testing and analysis.
Submission of progress report. X
Pre-SEDEX X
Submission of Draft Final Report. X
Submission of Dissertation (soft bound) X
Submission of Technical Paper. X
Viva X
Submission of Project Dissertation (hard bound) X
24 3.7 Key Milestones
FYP Date Start Date End Period Milestones
20/1/2015 20/1/2015 1 day Selected the title for the research project.
30/1/2015 27/1/2015 4 week
Completed writing the extended proposal report and submitted to the supervisor to be reviewed.
FYP I 2/3/2015 4/3/2015 3 days
Made correction to the extended proposal report and submitted to the supervisor to be evaluated.
3/3/2015 18/3/2015 2 weeks
Completed and presented Proposal Defence.
2/3/2015 20/4/2015 7 weeks
Completed preliminary experimental work:
1. Chemical acquisition 2. Solvent preparation 3. Sample analysis
11/3/2015 8/4/2015 4 weeks
Completed the interim report writing.
FYP II
18/5/201 14/6/2015 4 weeks Chemical acquisition.
15/6/2015 21/6/2015 1 weeks Preparation of sample, sodium glycinate.
22/6/2015 26/7/2015 5 weeks Sample testing and analysis.
27/7/2015 21/8/2015 4 weeks Completion and submission of project dissertation.
25 CHAPTER 4
RESULTS AND DISCUSSION
4.1 Thermophysical Properties of Amino Acid Salt Solution For this part the results obtained are as followed:
TABLE 1 Density of 10% of sodium glycinate, 2% of piperazine, 88% of water Temperature
(oC)
Density (g/cm3)
30 1.0429
40 1.0387
50 1.0341
60 1.0289
TABLE 2 Density of 10% of sodium glycinate, 5% of piperazine, 85% of water Temperature
(oC)
Density (g/cm3)
30 1.0448
40 1.0406
50 1.0358
60 1.0307
26
TABLE 3 Density of 20% of sodium glycinate, 2% of piperazine, 78% of water Temperature
(oC)
Density (g/cm3)
30 1.0897
40 1.0849
50 1.0799
60 1.0744
TABLE 4 Density of 20% of sodium glycinate, 5% of piperazine, 75% of water Temperature
(oC)
Density (g/cm3)
30 1.0919
40 1.087
50 1.0819
60 1.0764
TABLE 5 Density of 30% of sodium glycinate, 2% of piperazine, 68% of water Temperature
(oC)
Density (g/cm3)
30 1.1395
40 1.1344
50 1.1288
60 1.1231
27
TABLE 6 Density of 30% of sodium glycinate, 5% of piperazine, 65% of water Temperature
(oC)
Density (g/cm3)
30 1.1403
40 1.135
50 1.1294
60 1.1235
It is found that the density of the solution is higher as the composition increases, but decreases when the temperature increases. This is due to the presence of both amino acid and amine in the solution that will induced the greater density as compare to unique solution.
TABLE 7 pH value testing result
Sample pH value
10% of sodium glycinate, 2% of piperazine, 88% of water
12.14
10% of sodium glycinate, 5% of piperazine, 85% of water
12.47
20% of sodium glycinate, 2% of piperazine, 78% of water
12.01
20% of sodium glycinate, 5% of piperazine, 75% of water
12.12
30% of sodium glycinate, 2% of piperazine, 68% of water
11.97
28
30% of sodium glycinate, 5% of piperazine, 65% of water
12.09
As observed, it is found that the pH value of the proposed solution is lesser as the composition of the solution increases. This is due to the fact that the presence of piperazine, which is amine, has slightly acidic properties that will affect the pH value of the solution.
TABLE 8 Refractive index testing result
Sample RI value
10% of sodium glycinate, 2% of piperazine, 88% of water
1.3523
10% of sodium glycinate, 5% of piperazine, 85% of water
1.3565
20% of sodium glycinate, 2% of piperazine, 78% of water
1.3648
20% of sodium glycinate, 5% of piperazine, 75% of water
1.3709
30% of sodium glycinate, 2% of piperazine, 68% of water
1.3797
30% of sodium glycinate, 5% of piperazine, 65% of water
1.3853
29
Refractive index of the proposed solution is greater at the composition of 30% of sodium glycinate. The presence of the mixture of both amino acid and amine will affect the RI value as observed.
4.2 Solubility Testing
In this part the solubility data will be used to validate the data obtained from the thermophysical properties testing and be compared to the data for the alkanolamines available. The sample is tested under the following condition:
Tested pressure: 5 bar, 10 bar, 15 bar Tested temperature: 30 oC, 40 oC, 50 oC
30 The results are as followed:
TABLE 9 Solubility testing at 30 oC Pressure
(bar)
Volume (Litre) 10%NG-
2%Pz
10%NG- 5%Pz
20%NG- 2%Pz
20%NG- 5%Pz
30%NG- 2%Pz
30%NG- 5%Pz
5 9544 773 867 325 369 356
10 540 409 313 392 374 263
15 516 540 294 205 311 291
FIGURE 10 Graph of solubility testing at 30 oC
0 100 200 300 400 500 600 700 800 900 1000
0 5 10 15 20
Volume (Litre)
Pressure (bar)
Graph of carbon dioxide absorbed(Litre) at different pressure(bar) with fixed temperature at 30oC
10% sodium glycinate + 2%
piperazine
10% sodium glycinate + 5%
piperazine
20% sodium glycinate + 2%
piperazine
20% sodium glycinate + 5%
piperazine
30% sodium glycinate + 2%
piperazine
30% sodium glycinate + 5%
piperazine
31
TABLE 10 Solubility testing at 40 oC Pressure
(bar)
Volume (Litre) 10%NG-
2%Pz
10%NG- 5%Pz
20%NG- 2%Pz
20%NG- 5%Pz
30%NG- 2%Pz
30%NG- 5%Pz
5 939 623 558 330 252 336
10 643 569 287 382 340 216
15 569 680 548 485 387 225
FIGURE 11 Graph of solubility testing at 40 oC
0 100 200 300 400 500 600 700 800 900 1000
0 5 10 15 20
Volume (Litre)
Pressure (bar)
Graph of carbon dioxide absorbed(Litre) at different pressure(bar) with fixed temperature at 40oC
10% sodium glycinate + 2%
piperazine
10% sodium glycinate + 5%
piperazine
20% sodium glycinate + 2%
piperazine
20% sodium glycinate + 5%
piperazine
30% sodium glycinate + 2%
piperazine
30% sodium glycinate + 5%
piperazine
32
TABLE 11 Solubility testing at 50 oC Pressure
(bar)
Volume (Litre) 10%NG-
2%Pz
10%NG- 5%Pz
20%NG- 2%Pz
20%NG- 5%Pz
30%NG- 2%Pz
30%NG- 5%Pz
5 555 636 643 277 363 284
10 513 643 513 336 452 261
15 415 754 545 509 321 330
FIGURE 12 Graph of solubility testing at 50 oC
From the solubility testing done, it is observed that the variation of different temperature and pressure gives different variation of the absorption or loading capacity. At 30oC, it is observed that the solution does not induce any positive loading capacity as desorption of CO2 is happening at the moment. At 40oC and 50oC, some positive loading capacity is observed at certain composition of the solution used.
Generally, it can be induced that the variation of different composition of the mixture give different loading capacity as the parameters: temperature and pressure are increased. This irregular trend observed is due to the presence of both amino acid and
0 100 200 300 400 500 600 700 800 900 1000
0 5 10 15 20
Volume (Litre)
Pressure (bar)
Graph of carbon dioxide absorbed(Litre) at different pressure(bar) with fixed temperature at 50oC
10% sodium glycinate + 2%
piperazine
10% sodium glycinate + 5%
piperazine
20% sodium glycinate + 2%
piperazine
20% sodium glycinate + 5%
piperazine
30% sodium glycinate + 2%
piperazine
30% sodium glycinate + 5%
piperazine
33
amine that has different reliability in performing absorption as proposed in the literature review research. The intrinsic properties of both chemicals are contradictory but at certain extent, it inhibit positive outcome.
FIGURE 13 Solubility of L-prolinate salt solution
As shown in the figure above, it is observed that for the available conventional amino salt solution, the loading capacity measured in term of CO2 solubility is decreasing as the temperature increases. Hence, it is deduced that the blend of the proposed solution has significant impact at certain condition in boosting the loading capacity of CO2.
34 CHAPTER 5
CONCLUSION AND RECOMMENDATION
It can be concluded that different composition of amino acid salt solution will give different loading capacity of CO2. This is due to the sensitivity of the solution at different composition to tolerate the different variation of the temperature and pressure.
In the experiment work done, the best condition, at composition of 10% sodium glycinate, 5% piperazine give the best loading capacity of the CO2. To compare with the pure amino acid salt solution, the loading capacity will decrease as the temperature increases. The proposed solution has optimum loading capacity upon specific operating condition as this result show its significant over the available amino acid salt solution.
Some consideration or recommendations that can be emphasized are:
Using the base consists of Group 2 element like Calcium Hydroxide and Magnesium Hydroxide to see the difference in term of its solubility and thermophysical of the substance
Conduct the experiment using different flue gas like Sulphur dioxide (SO2) to see whether amino acid give similar outcome as the one used on CO2
35
REFERENCES
[1] R. Bacastow, C. D. Keeling, G. Woodwell, and E. Pecan, "Atmospheric carbon dioxide and radiocarbon in the natural carbon cycle. II. Changes from AD 1700 to 2070 as deduced from a geochemical model," Univ. of California, San Diego, La Jolla; Brookhaven National Lab., Upton, NY (USA)1973.
[2] R. S. Haszeldine, "Carbon capture and storage: how green can black be?,"
Science, vol. 325, pp. 1647-1652, 2009.
[3] J. Kubesh, S. R. King, and W. E. Liss, "Effect of gas composition on octane number of natural gas fuels," SAE Technical Paper1992.
[4] Z. Liang, M. Marshall, and A. L. Chaffee, "CO2 adsorption-based separation by metal organic framework (Cu-BTC) versus zeolite (13X)," Energy & Fuels, vol. 23, pp. 2785-2789, 2009.
[5] K. E. Zanganeh, A. Shafeen, and C. Salvador, "CO2 capture and development of an advanced pilot-scale cryogenic separation and compression unit," Energy Procedia, vol. 1, pp. 247-252, 2009.
[6] D. Q. Vu, W. J. Koros, and S. J. Miller, "High pressure CO2/CH4 separation using carbon molecular sieve hollow fiber membranes," Industrial &
engineering chemistry research, vol. 41, pp. 367-380, 2002.
[7] K. Simons, K. Nijmeijer, H. Mengers, W. Brilman, and M. Wessling, "Highly selective amino acid salt solutions as absorption liquid for CO2 capture in gas–
liquid membrane contactors," ChemSusChem, vol. 3, pp. 939-947, 2010.
[8] A. Portugal, P. Derks, G. Versteeg, F. Magalhaes, and A. Mendes,
"Characterization of potassium glycinate for carbon dioxide absorption purposes," Chemical Engineering Science, vol. 62, pp. 6534-6547, 2007.
[9] P. H. Feron and N. ten Asbroek, "New solvents based on amino-acid salts for CO2 capture from flue gases," Proceeding of GHGT, vol. 7, pp. 5-9, 2004.
[10] A. Chakma and A. Meisen, "Improved Kent-Eisenberg model for predicting CO2 solubilities in aqueous diethanolamine (DEA) solutions," Gas Separation
& Purification, vol. 4, pp. 37-40, 1990.
[11] D. Guo, H. Thee, C. Y. Tan, J. Chen, W. Fei, and S. Kentish, "Amino acids as carbon capture solvents: Chemical kinetics and mechanism of the glycine+
CO2 reaction," Energy & Fuels, vol. 27, pp. 3898-3904, 2013.
36
[12] P. D. Vaidya, P. Konduru, M. Vaidyanathan, and E. Y. Kenig, "Kinetics of carbon dioxide removal by aqueous alkaline amino acid salts," Industrial &
Engineering Chemistry Research, vol. 49, pp. 11067-11072, 2010.
[13] J. Brouwer, P. Feron, and N. Ten Asbroek, "Amino-acid salts for CO2 capture from flue gases," in Fourth Annual Conference on Carbon Capture &
Sequestration, May, 2005.
[14] E. Sanchez-Fernandez, K. Heffernan, L. van der Ham, M. J. Linders, D.
Brilman, E. and L. Goetheer, "Analysis of process configurations for CO2
capture by precipitating amino acid solvents," Industrial & Engineering Chemistry Research, vol. 53, pp. 2348-2361, 2014.
[15] E. S. Fernandez and E. L. Goetheer, "DECAB: Process development of a phase change absorption process," Energy Procedia, vol. 4, pp. 868-875, 2011.
[16] J. van Holst, G. Versteeg, D. Brilman, and J. Hogendoorn, "Kinetic study of CO2 with various amino acid salts in aqueous solution," Chemical Engineering Science, vol. 64, pp. 59-68, 2009.
[17] R. P. Smith, T. Ree, J. L. Magee, and H. Eyring, "The inductive effect and chemical reactivity. I. General theory of the inductive effect and application to electric dipole moments of haloalkanes," Journal of the American Chemical Society, vol. 73, pp. 2263-2268, 1951.
[18] B. E. Gurkan, C. Juan, E. M. Mindrup, L. E. Ficke, B. F. Goodrich, and E. A.
Price,"Chemically complexing ionic liquids for post-combustion CO2
capture," in Clearwater Clean Coal Conference, pp. 6-10, 2010.
[19] G. Puxty, R. Rowland, A. Allport, Q. Yang, M. Bown, and R. Burns,"Carbon dioxide postcombustion capture: a novel screening study of the carbon dioxide absorption performance of 76 amines," Environmental science & technology, vol. 43, pp. 6427-6433, 2009.
[20] V. Zelenak, D. Halamova, L. Gaberova, E. Bloch, and P. Llewellyn, "Amine- modified SBA-12 mesoporous silica for carbon dioxide capture: Effect of amine basicity on sorption properties," Microporous and Mesoporous Materials, vol. 116, pp. 358-364, 2008.
[21] P. Kumar, J. Hogendoorn, S. Timmer, P. Feron, and G. Versteeg, "Equilibrium solubility of CO2 in aqueous potassium taurate solutions: Part 2. Experimental VLE data and model," Industrial & engineering chemistry research, vol. 42, pp. 2841-2852, 2003.
[22] H.-J. Song, M.-G. Lee, H. Kim, A. Gaur, and J.-W. Park, "Density, Viscosity, Heat Capacity, Surface Tension, and Solubility of CO2 in Aqueous Solutions of Potassium Serinate," Journal of Chemical & Engineering Data, vol. 56, pp.
1371-1377, 2011.