This study aims to determine the relationship between sleep duration, sleep quality and SSB intake among UTAR students. Pearson correlation was performed to determine the relationship between sleep duration, sleep quality, and SSB intake in college students.
Research Background 1
It is worth noting that soft drink intake was considered one of the risk factors for obesity among university students (Wan Mohamed Radzi et al., 2019). As a result, it appears that sleep may be the underlying factor in SSB intake among college students.
Problem Statement 4
There are other factors that may influence SSB intake that have not been studied among college students. However, it is still unclear whether sleep duration and quality are the underlying factors for SSB intake among college students, as most of the previous studies have rarely been conducted among college students.
Significance of Study 5
On the other hand, sleep quality has been found to be consistently correlated with SSB intake, despite limited study being conducted. 6 the SSB consumption of university students for effective policy and health program development to guarantee the overall health of university students.
Research Objectives 6
General Objective 6
Specific Objectives 6
Research Questions 7
Research Hypothesis 7
Background of Sugar-sweetened Beverage (SSB) 8
SSB Definition and Recommended Intake 8
SSB Intake Trend 9
SSB Intake and Obesity Prevalence 10
SSB Consumption of University Students 11
SSB Consumption Between Gender 13
Most of the previous studies showed that male university students had a higher consumption of SSB compared to female university students (Bawadi et al., 2019; Ahmad et al., 2019; Islam et al., 2019; Islam et al., 2019; Islami et al., found that male university students consumed a significantly higher calorie intake from SSB than female university students. Despite this, previous studies revealed n that gender consumption was not associated with .al found that males had a higher risk of SSB intake, with male university students twice as likely to drink sugary drinks compared to females.
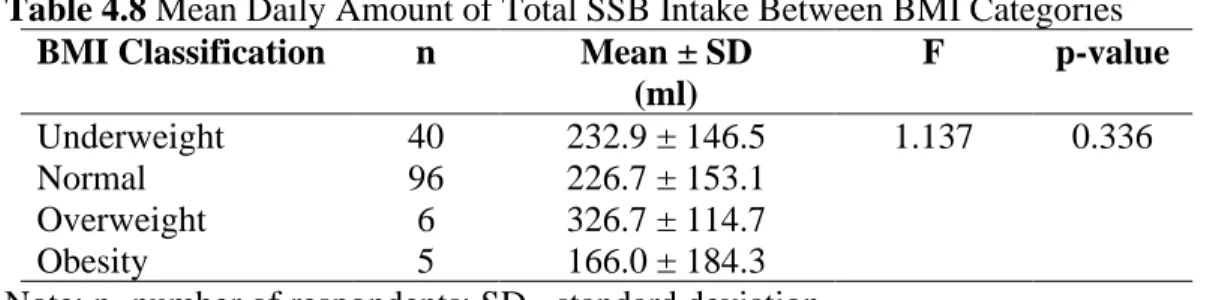
SSB Consumption Between BMI Categories 14
Sleep Duration and Quality of University Students 14
Similar finding was reported by Du, Zan et al. 2021), who conducted a study among university students in 7 countries. However, on average, university students from all 7 countries had a minimum of 7 hours of sleep per night (Du, Zan et al., 2021).
Sleep Characteristics and SSB Intake 17
Sleep Duration and SSB Intake 17
Contrary to the earlier findings, Boozari et al. 2020) reported no significant association between sleep duration and SSB intake among university students. In addition, some previous studies used secondary data, which were collected using questionnaire about sleep duration and SSB intake with unclear validity (Min et al., 2018; Sampasa-Kanyinga et al., 2018). 19 short sleep duration defined according to age-appropriate sleep duration recommendation (Sampasa-Kanyinga et al., 2018).
Similarly, Sampasa-Kanyinga et al. 2018) also found that people with short durations were more likely to consume energy drinks, which is a type of caffeinated SSB. As evidence for this claim, a negative association between sleep duration and SSB intake was observed after adjusting for potential confounders such as screen time and physical activity level (Kjeldsen et al., 2014).
Sleep Quality and SSB Intake 20
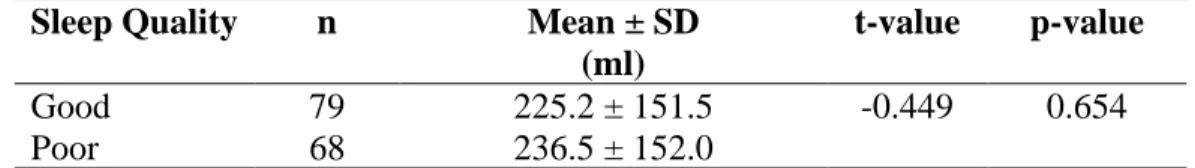
Daily amount of total SSB intake was the dependent variable, while sleep duration and sleep quality were the independent variables. Independent t-test was performed to assess the difference in mean daily amount of total SSB intake between genders and between sleep quality groups. 42 4.4 Comparison of the average daily amount of total SSB intake with gender, BMI, sleep duration and sleep quality.
The finding revealed that male university students had a significantly higher amount of total SSB intake per day than female students. There was no significant association between age, BMI and sleep duration with the daily amount of total SSB intake. 46 Table 4.11 Pearson correlation between age, BMI, sleep duration, sleep quality with the daily amount of SSB intake in UTAR students.
The present study found that the amount of SSB intake has no significant difference between BMI categories. 56 5.6 Correlation between selected socio-demographic variables and daily amount of the total SSB intake of UTAR students. The present study could not find any significant association between age, BMI, sleep duration, sleep quality with daily amount of SSB intake among university students.
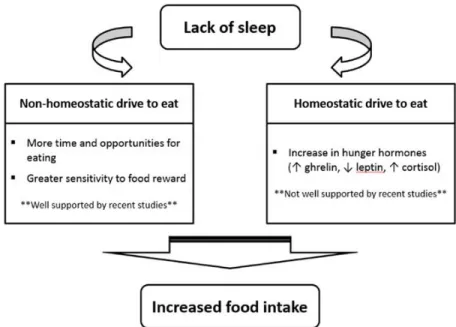
Mechanism on Sleep Deprivation Affects Appetite 21
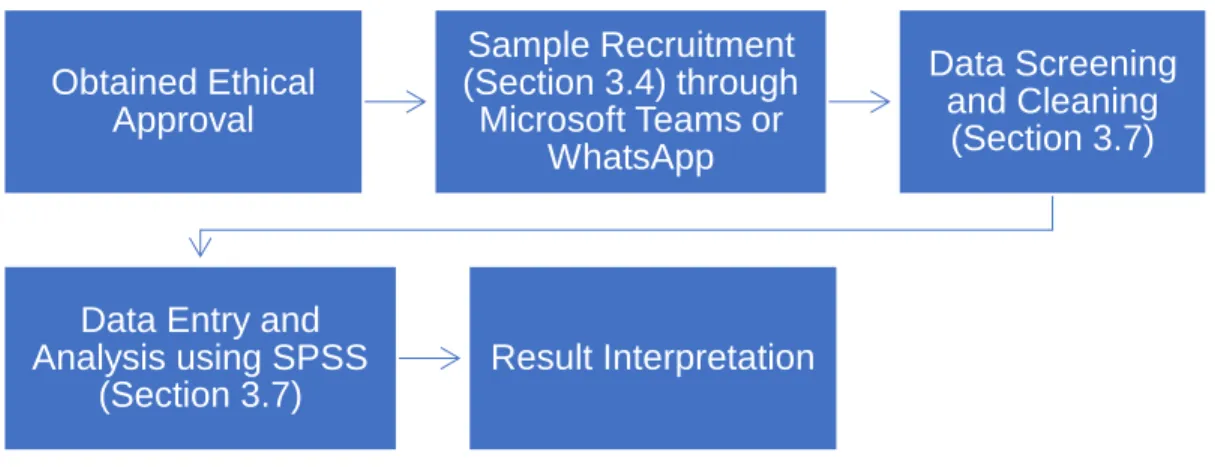
Study Design 25
A cross-sectional research design was used in this study to determine the prevalence of SSB intake, sleep duration and sleep quality of the target population.
Study Location 25
Ethical Approval 25
Sample Recruitment 26
Sampling Method 26
Sample Size Calculation 26
The estimated population proportion of SSB intake was 89.3%, which was taken from Ahmad et al. 2019) who investigated SSB intake among students in one of the Malaysian universities. Regarding respondent non-response, a 20% non-response rate was taken into account when calculating the sample size, so the target was 176 respondents.
Sampling Criteria 27
Research Questionnaires 28
Section A: Socio-demographic Data 28
Section B: Sugar-sweetened Beverage (SSB) Intake 29
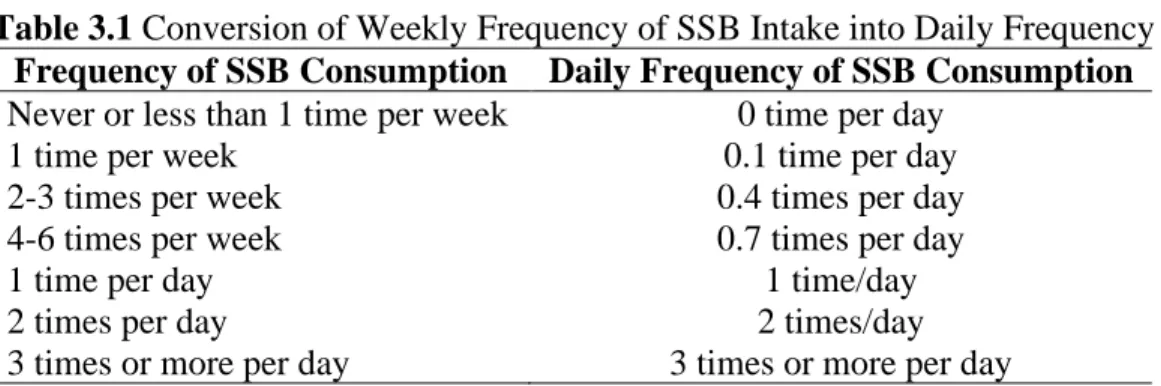
Non-SSBs, such as diet soda, homemade tea without sugar or creamer and homemade coffee without sugar or creamer are excluded from total SSB. The daily frequency of consumption for each drink was obtained by dividing the weekly frequency by 7, as shown in Table 3.1. Daily frequency of total SSB intake was obtained by summing daily frequency of each SSB intake.
It was used to classify SSB intake into three groups which were low, moderate and high intake as shown in Table 3.2. Regarding the daily amount of total SSB intake, it was obtained by ∑(daily frequency of SSB intake x amount consumed each time) for each SSB.
Section C: Pittsburgh Sleep Quality Index (PSQI) 31
Global PSQI score >5 has 89.6% sensitivity and 86.5% specificity for distinguishing between individuals with good and poor sleep quality. In addition to sleep quality, one of the questions in the PSQI was used to assess sleep duration, from which respondents were asked to report the actual hours of sleep per night. night during the past month. As shown in Table 3.4, the sleep duration was classified into three groups which are short, normal and long sleep duration based on the recommended sleep duration for the age group of 18 to 64 years.
Seven to nine hours of sleep per night is recommended for young adults and adults aged 18 to 64 years old, which applies to the target group (Hirshkowitz et al., 2015).
Flowchart of Study 33
Data Analysis 33
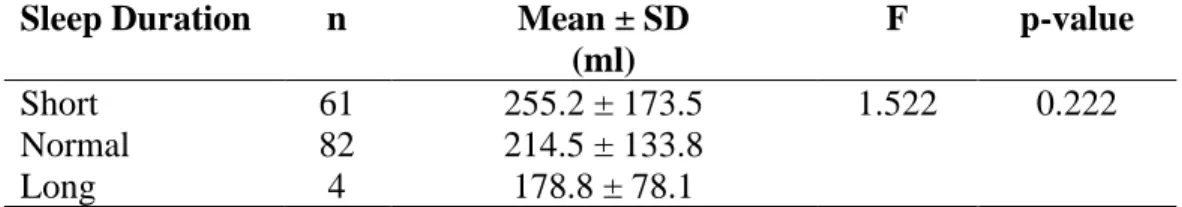
Descriptive statistics were used to present the sociodemographic data and the prevalence of SSB intake, sleep duration and sleep quality of university students. Categorical data were presented in frequency and percentage, while continuous data were presented in mean ± standard deviation. One-way ANOVA was used to determine the difference in mean daily amount of total SSB intake between BMI categories and between sleep time groups.
Pearson's correlation was used to examine the correlation between age, BMI value, sleep duration, sleep quality (PSQI global score) with daily amount of total SSB intake. All data were analyzed using the Statistical Package for the Social Sciences (SPSS) version 26, with p < 0.05 considered statistically significant.
Socio-demographic Characteristics of Participants 36
Prevalence of SSB Intake of UTAR Students 38
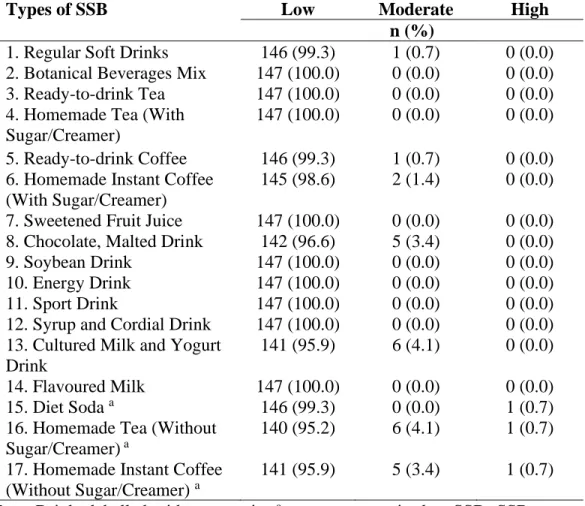
39 coffee and tea at least once a day respectively, while none of them consumed tea sweetened with sugar and less than 2% of them consumed coffee sweetened with sugar daily.
Sleep Characteristics of UTAR Students 40
Sleep Duration of UTAR Students 40
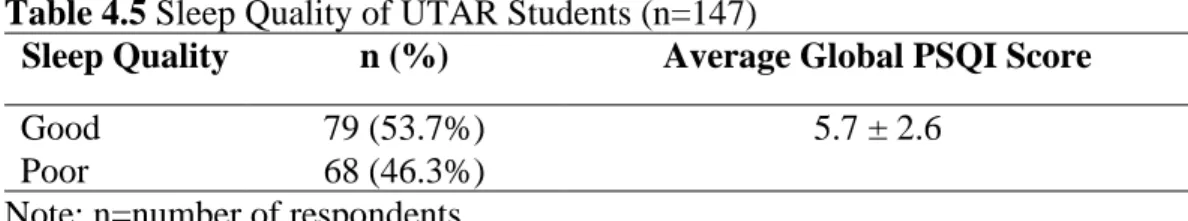
Sleep Quality of UTAR Students 40
The statistical analysis showed that the average daily amount of total SSB intake was significantly different between sexes, with p=0.028. The statistical analysis shows that the difference in the average daily amount of total SSB consumed was not significant. Therefore, the result of sleep duration indicated no influence on the amount of total SSB intake in a day among UTAR students.
However, the difference in mean amount of total SSB intake between good and poor sleep quality was not statistically significant with p=0.654. In conclusion, age, BMI, sleep duration and sleep quality were not correlated with the amount of SSB consumed, indicating that these variables do not influence the daily amount of total SSB intake among college students. In addition, Boozari et al. 2020) found that groups with short sleep duration (6 to 8 hours of sleep) had a significantly higher amount of SSB compared to the normal and long sleep duration group.
Compared to the university population, Boozari et al. 2020) revealed that sleep quality was recognized as the factor associated with SSB intake among university students.
Comparison of Mean Daily Amount of Total SSB Intake 42
Correlation Between Age, BMI, Sleep Duration, Sleep Quality 44
SSB Consumption Among UTAR Students 47
Indeed, SSB consumption was observed among UTAR students, however, their rate of SSB consumption was not at an alarming level. Compared to Malaysian university students, the present study reported that most UTAR students had a low SSB intake (no SSB intake per day). According to Park et al. 2014), knowledge about the health complications of SSB intake was associated with low SSB intake, individuals who had insufficient knowledge on the complications of SSB intake had a 61% greater probability of SSB consumption.
According to Cheng and Lau (2022), university students who had a good practice on SSB consumption are likely to have low SSB consumption. Vending machines were available in university, so students living at university hostel can easily access SSB, resulting in high SSB consumption.
Sleep Duration and Quality of UTAR Students 49
The current study population was free to choose their accommodation outside the university area, while the study by Ahmad et al. 2019) was conducted among students living in a student dormitory. According to Deliens et al. 2015), availability of sugary drinks at university was associated with energy drink intake. For example, Du, Zan et al. 2021) who recruited university students from seven countries found that all participants had an average of 7.5 ± 1.2 hours of sleep.
Compared with previous studies conducted in Malaysia, the current study found that 41.5% of respondents were sleep deprived, which was lower than the sleep deprivation rate reported by Naito et al. While getting enough sleep is important, improving sleep quality seems to be a more alarming concern among college students.
Comparison of Mean Daily Amount of Total SSB Intake 51
Comparison of Mean Daily Amount of Total SSB 51
Sleep Quality in Relation to Daily Amount of Total SSB Intake 54
Prevalence and factors associated with sugar-sweetened beverage intake among undergraduate students in a public university in Malaysia. Association between sleep duration and sleep quality with sugar and sugar-sweetened beverage intake among university students. Declining consumption of added sugars and sugar-sweetened beverages in Australia: A challenge for obesity prevention.
Unhealthy lifestyle associated with higher intake of sugar-sweetened beverages among Malaysian school-aged adolescents. Relationship between nutrition knowledge and amount of sugar-sweetened beverages consumed in Los Angeles County. Long-term consumption of sugar-sweetened and artificially sweetened beverages and risk of mortality in US adults.
The role of sugar-sweetened beverages in the global epidemics of obesity and chronic disease.
Correlation Between Selected Sociodemographic Variables and 56
Future Recommendations 58
Association between sugar-sweetened beverage consumption and body mass index among university students in Kuala Nerus, Terengganu, Malaysia. Daily sugar-sweetened beverage intake among US adults in 9 states, by state and sociodemographic and behavioral characteristics, 2016. Self-reported knowledge, attitude, and consumption of sugar-sweetened beverages among undergraduate oral health students at a university in South Africa.
Consumption of sugar-sweetened beverages, juice, artificially sweetened soft drinks and bottled water: an Australian population study. Consumption of sugar-sweetened beverages and incidence of type 2 diabetes in Thai adults: results of an 8-year prospective study. Short and sweet: Associations between self-reported sleep duration and sugar-sweetened beverage consumption among adults in the United States.
Factors associated with sugar-sweetened beverage consumption among Malaysian adolescents: findings from the 2017 Adolescent Nutrition Survey.