The quality of drinking water from 10 sources was determined by analyzing parameters that could deteriorate the water quality. The parameters investigated are pH, conductivity, total suspended solids (TSS), total dissolved solids (TDS) and heavy metals such as Cd, Cr, Pb, As, Hg and Sn. The results of the analysis were then compared to drinking water quality standards such as WHO guidelines, USEPA and local standards which are NDWQS and NWQS.
All parameters were found to be within the limit set by these authorities, except for Sn in samples from certain sites that had exceeded the maximum allowed concentration. For example, the water at all locations was found to be safe, as drinking water was within the standard limit by means of all analyzed parameters. An exception is made to the Sn concentration exceedance in five samples because Sn is not considered a primary or secondary contaminant for drinking water and carries a very low risk of harming human health.
Excellent advice and constructive criticism were given which really help to further improve the project outcome. Fakhrusy Syakirin Bin Zainol Alam, Science Officer (Chemistry) from Public Health Division, Perak Health Department for providing support and gave full cooperation throughout the completion of the project.
INTRODUCTION
- BACKGROUND OF STUDY 1 Drinking water
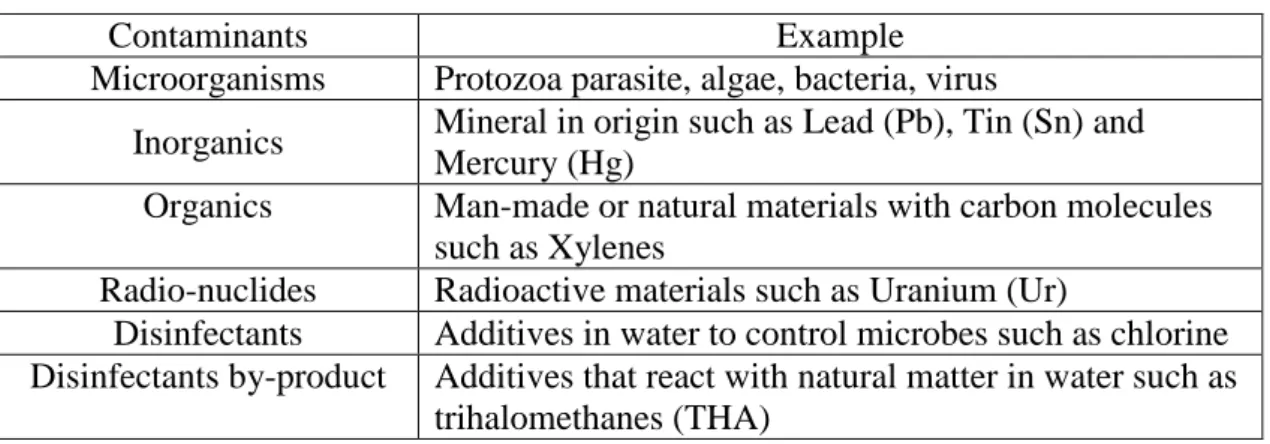
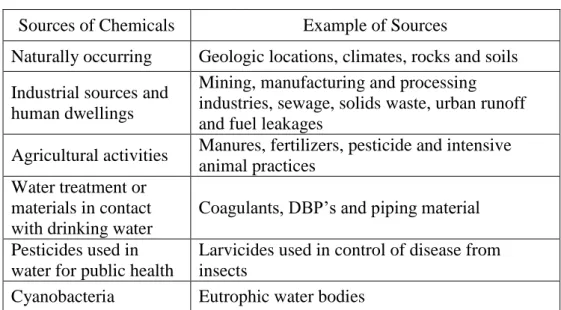
- Contaminants in drinking water
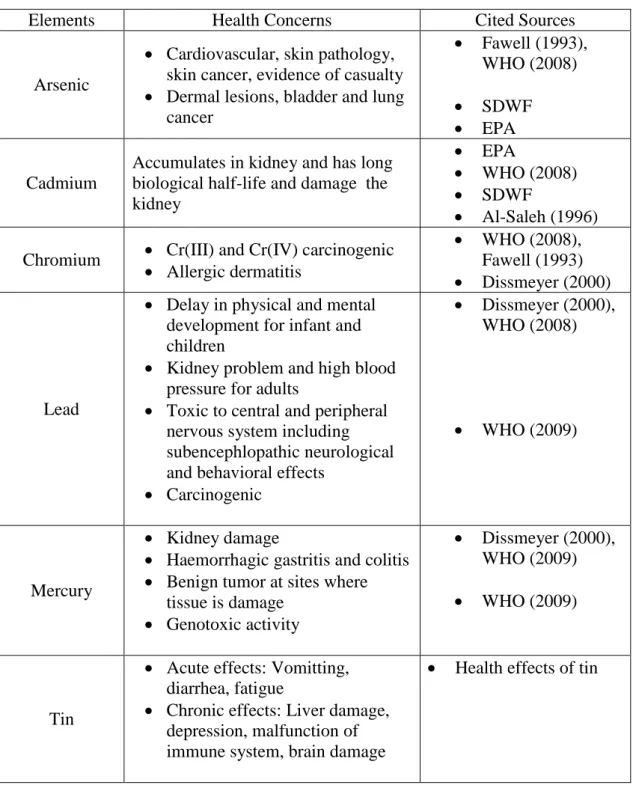
- Heavy Metals and Health Problems
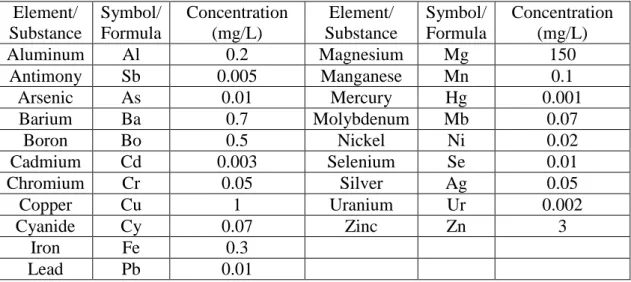
- Drinking water quality standards
- Problem Statement
- Objective
- Scope Of Study
- WATER SUPPLY
- Perak Drinking Water Supply .1 Perak Water Board (PWB)
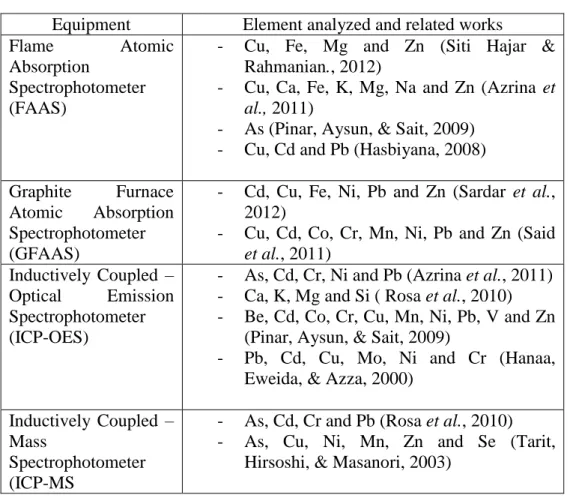
- Previous Works on Drinking Water Analysis
- Methods Used For Quantification of Elements In Water
- PROJECT METHODOLOGY
- Project Flow
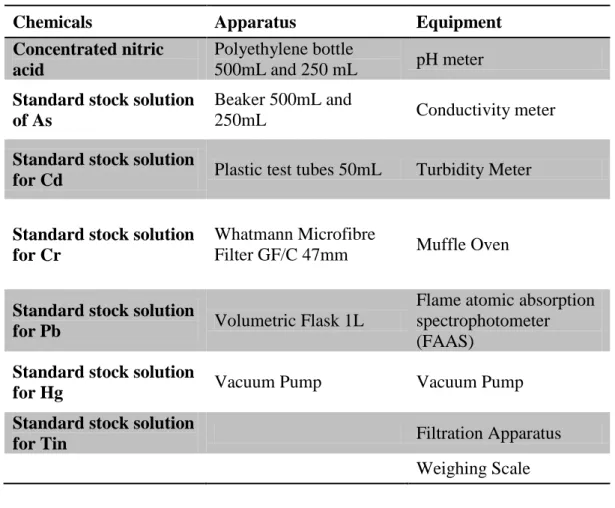
- Experimental Procedures
- Project Planning and Execution
- Results
- Discussion
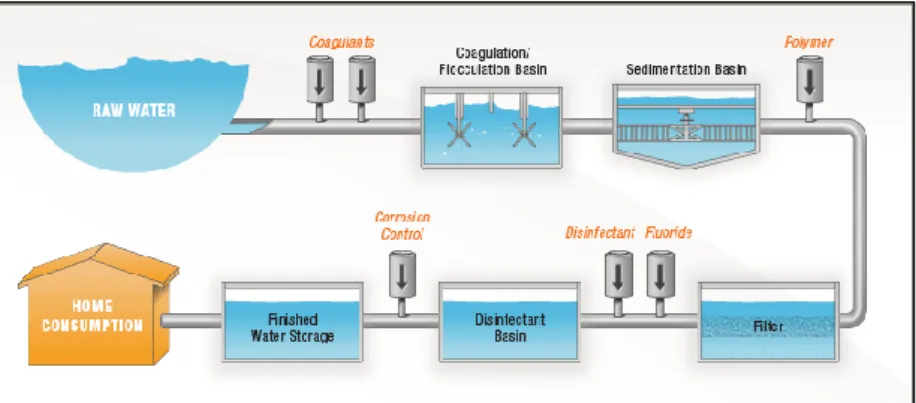
Contaminants such as arsenic (As) can result from runoff from electronics and glass production. Points i and ii can cause the water to be undrinkable in appearance and taste. The quality of water consumed by a community can be determined by analyzing the water content.
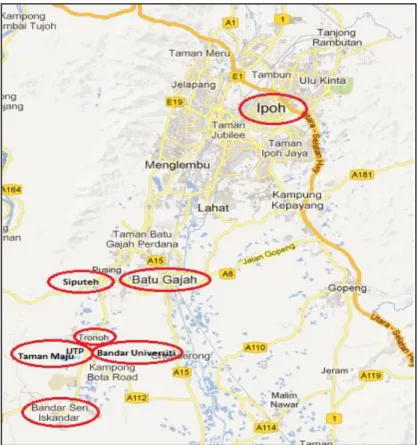
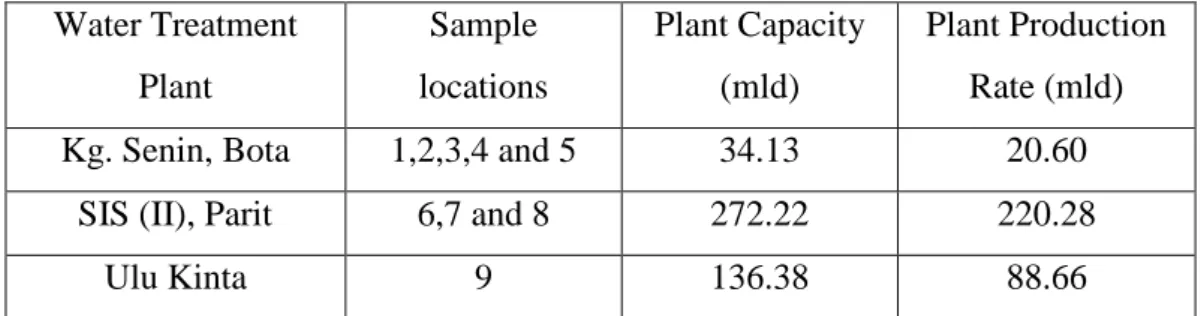
Therefore, in the present work, ICP-MS will be used to quantify the concentration of elements due to lower detection limits of the equipment. This is done to ensure that the concentration of heavy metals in the scope of the study can really be determined. Eight of the samples will be from tap water in residential and institutional areas.
Both dishes and containers were placed in the electronic dry cabinet for cooling. With the limitation of the equipment, the analysis was done only to determine the concentration of Cd, Cr and Pb. Memory collection of samples can lead to different values obtained for each of the parameters.
For the rest, the sample taken from the plant is considered to be fresh from the plant. In the presence of substances (Ca, Mg Na and others) current is created in the water due to the ability of the substances to conduct electricity. The same applies to the sample from the dispenser machine, as the location of the dispenser is not known.
High conductivity will result in lowering the aesthetic value of the water by giving the water a mineral taste. The existence of high concentration of TSS in water can be seen from the sedimentation of solid matter at the bottom of the water container. Nevertheless, due to the very low amount of TSS, sedimentation of solid matter is not seen in any of the samples.
Unfortunately, the concentration of Pb in all samples was found to have negative values. As mentioned in 3.3.4, the method used to quantify the concentration of elements is based on the spectrometric varion method according to APHA. Mineral water and RO possess the lowest concentration of this metal that water is further processed through the filtration system that removes most of the minerals in the water.
However, the exact concentration of Hg cannot be determined due to the limitation of the detection limit of the method used to analyze Hg in the samples.
CONCLUSION AND RECOMMENDATION
CONCLUSION
Turbidity of drinking water samples was found below the limit of 5 NTU set by NDWQS. Concentration of TSS was below the maximum permissible limit of 25 mg/L for Class I and Class IIA water suitable for water supply as determined in NWQS. In this study, TDS was determined using two methods which were through experimental work and estimation method.
Both results obtained showed that the concentration of TDS was below 500 mg/l in all samples. For the analysis of heavy metals in the samples, the concentration of all metals analyzed except Sn was found to be below the maximum allowable concentration set by NDWQS, WHO and USEPA. Sn content was found to be high in samples from five sites, which has the potential for contamination from the site itself, which is on or near a former tin mining area, and leaching of Sn from the use of Sn-based Pb-based solder of pipe fittings and joints.
Based on the analysis, the water from the ten sources is considered to be safe as drinking water as all parameters analyzed were within the standards set by the Ministry of Health of Malaysia, WHO and USEPA regardless of Sn which is not considered a pollutant for drinking water . from these bodies. In short, this research can determine the safe and quality level of water supplied to the community. The result from this study can benefit the people of specific research areas, Perak Health Department and help PWB in monitoring water supply quality.
The project methodology has been improvised along the way to ensure reliable and accurate data collection. Overall, with the completion of the experimental work and data analysis, the objectives of the project are successfully achieved.
RECOMMENDATION
In addition, the basis of selection of sampling locations should be clearly stated as this could lend great credibility to the study. As for this study, which is a continuation of the previous study, the sampling locations were selected based on the same locations that were selected in the previous study. In addition, future studies may be conducted on the determination of organotin in drinking water, which would have a greater risk to humans than inorganic tin.
The high concentration of inorganic Sn in the samples can then be correlated with the concentration of organic Sn that may result in bacterial action. The study can also be carried out in the evaluation of the concentration of Sn in the human body through the analysis of urine or blood accompanied by the assessment of the health impact on a population in certain places that may be affected by the high concentration of Sn in drinking water .
Chemical quality of tap water versus bottled water: evaluation of the content of some heavy metals and elements in drinking water in Dakahlia Governorate-Egypt. Health risk assessment of heavy metals and their source designation in drinking water in Kohistan region, Northern Pakistan. Investigation of arsenic and other heavy metals in food composites and drinking water and estimation of dietary intake by the villagers of an arsenic-affected area in West Bengal, India.
Determination of methyltin compounds in the urine of an occupationally exposed and general population by in situ ethylation and head-mounted SPME combined with GC-PFD.