The aim of the project is to determine the optimal temperature and determine the effectiveness of thermal treatment in the removal of hydrocarbons contaminated in seabeds with different penetration depths of contaminated seabeds. The efficiency of the thermal treatment method was calculated based on the amount of hydrocarbons removed from the contaminated soil.
PROBLEMSTATEMENT
PROBLEM IDENTIFICATION
Rachel Carson (1962), has ignited environmental consciousness globally, particularly on issues of groundwater and soil pollution. However, with increasing demand for agricultural use and drinking water, the vulnerability of groundwater and soil has become an important environmental and human health issue (Mohamed et al., 2009).
OBJECTIVES AND SCOPE OF STUDY
SCOPE OF STUDY
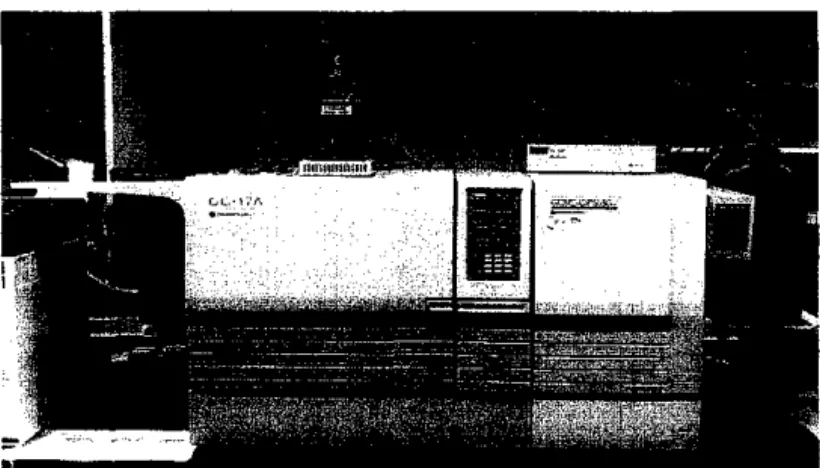
In the UTP laboratory facilities, the contaminated sea soil with hydrocarbon could be treated by means of thermal treatment using Gas Chromatography Mass Spectrometry Unit. The advantages of this equipment can be manipulated in the temperature and can also detect the type and amount of hydrocarbons removed from the process of thermal treatment.
THE RELEVANCY OF PROJECT
The traditional method of treating soil and groundwater contamination has been based on removal or containment (Brown et al., 1986). Treatment of contaminated soil in situ or ex situ either in an on-site plant or in a central plant.
CHAPTER2
LITERATURE REVIEW
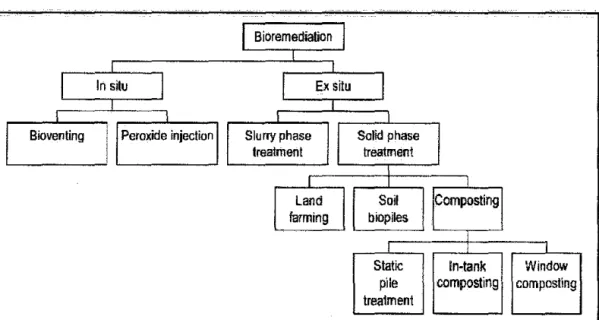
REMEDIATION TECHNOLOGIES
- CHEMICAL AND PHYSICAL TREATMENT
- BIOLOGICAL TREATMENT
- SOLIDIFICATION I STABILIZATION
- THERMAL TREATMENT
The purpose of all chemical and physical remediation methods is to alter the chemical environment in a way that prevents the transport of toxic substances to other elements of the soil system (Ibrahim, 2008). The technique, known to some as aerobic bioremediation, is achieved by introducing oxygen and nutrients to the soil to increase the biological breakdown of pollutants.
THERMAL TREATMENT OF CONTAMINATED SOIL WITH HYDROCARBON
- INCINERATION
- THERMAL DESORPTION
- PYROLYSIS
- PYROLYSIS GAS CHROMOTOGRAPHY MASS SPECTROMETRY (GC-MS)
- PLASMA IDGH TEMPERATURE METALS RECOVERY
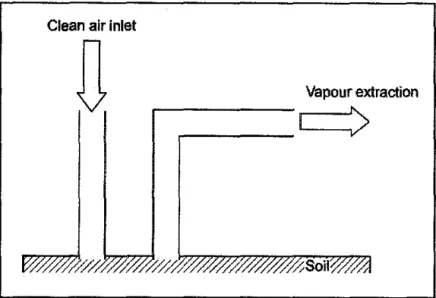
The results obtained at different temperatures from 150°C to 800°C showed that the hexadecane can be almost completely removed from the soil at operating temperature at approx. 300°C. Therefore, the performance of the fluid bed desorber was investigated at different operating temperatures and operating conditions. From the research, they found that for batch operation results show that the time to achieve the available efficiency depends on temperature and for continuous operation, the operating temperature must be kept above 294"C to achieve the desorption efficiency above 95%.
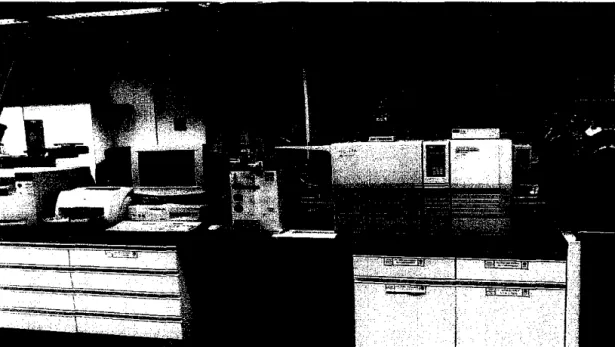
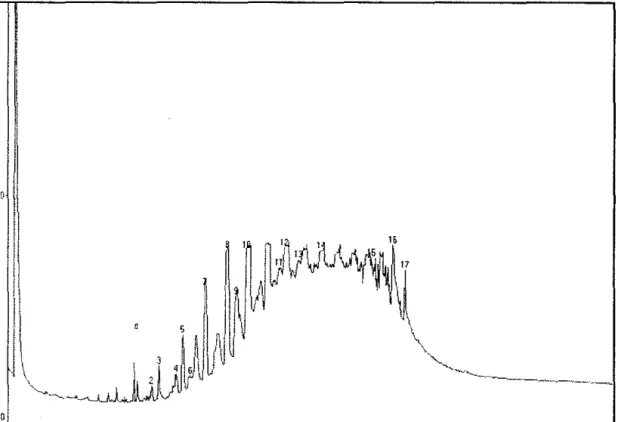
A continuous flow of helium transported vaporized products from the boat to the collection station during heating. Gases recovered from the gas sampling bag at the collection station were analyzed by gas chromatography (GC) using a flame ionization detector (FID). GCMS is the equipment used to treat the contaminated seabed and also to determine the type and amount of hydrocarbons removed from the treatment process.
CHAPTER3
MATERIAL
- SOIL SAMPLES
METHODS
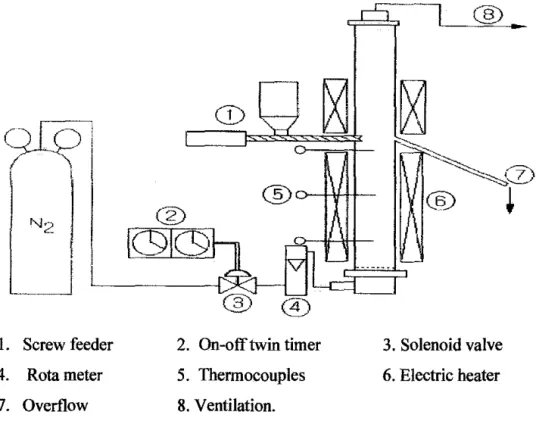
- THERMAL TREATMENT USING FIXED BED ACTIVATION UNIT
- UVIVISffiLE SPECTROPHOTOMETER ANALYSIS
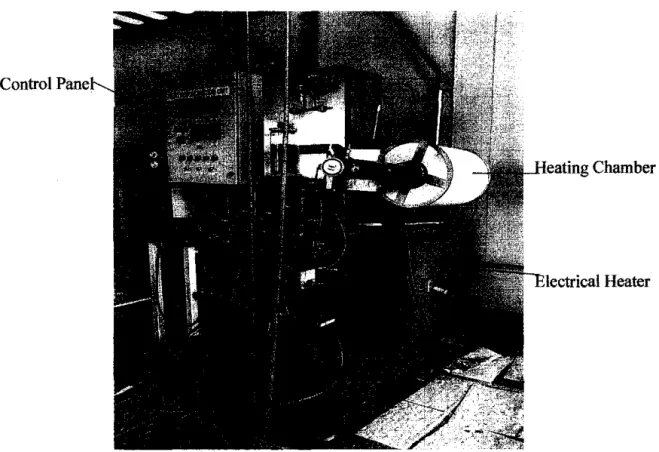
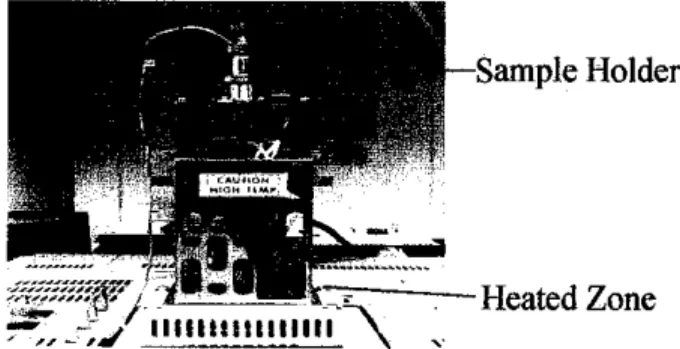
The hydrocarbon contaminated soil samples were placed in 3 mm x 3 mm platinum pan as shown in Figure 3.2. The full bucket was placed in the sample holder, which was attached to the top of the PYR-4A pyrolysis unit as shown in Figure 3.3 and holds the bucket with the samples for 5 minutes at room temperature under a helium gas flow. The hydrocarbon contaminated soil sample treated by thermal treatment using a fixed bed activation unit as shown in Figure 3.5.
About 30 g of contaminated soil samples with hydrocarbon were put into the ceramic beaker and placed in the oven (heating chamber). N-hexane (10 cm3) was added to the rinsed soil and shaken sideways for 5 minutes as shown in Figure 3.6, after which the n-hexane/hydrocarbon extract was removed. The absorbance of the centrifuged extract was measured at 400 nm using SHIMADZU UV-3150 UV-VIS-NIR spectrophotometer as shown in Figure 3.4.
CHAPTER4
RESULT AND DISCUSSION
RESULTS
- GAS CHROMATOGRAPHY MASS SPECTRUM ANALYSIS
- HYDROCARBON GROUPING
From the gas chromatography (GC) analysis for the sample taken at Ocm depth penetration, the result shows that the content of contaminated hydrocarbon chain components ranging from C7 to C2s The most important functional group in the sample is 75% is alkane group which contains straight chain , branched alkanes, as well as cyclic alkanes with a varying number of saturated rings and side chains. 5% of this contaminated soil sample is of aromatic hydrocarbon, including one or more aromatic rings ranging from simple monoaromatic compounds, such as benzene and toluene, to polyaromatic compounds such as pyrene. The rest of the fraction for this sample is carboxylic acid which is about 14% while alcohol is about 5%.
The gas chromatography (GC) results for the sample taken at a penetration depth of 10 cm show that the content of contaminated hydrocarbon compounds with a carbon chain ranges from C2 to C44. The major functional group in the sample is 74% derived from the alkane group which contains both branched alkanes and cyclic alkanes with varying numbers of saturated rings and side chains. The functional group distribution for contaminated soil samples collected at a depth penetration of 1 Ocm is shown in Figure 4.4.
Peak Area vs Hydrocarbon Group (lOcm)
The gas chromatography (GC) result for samples taken with a penetration depth of 30 cm shows that the content of contaminated hydrocarbon components varies from C2 to C20. The main functional group in the sample consists of 82% alkane group, 1% of this contaminated soil sample comes from aromatic hydrocarbons, 22% is carboxylic acid, while alcohol is approximately 1%. The functional group distribution for contaminated soil samples collected at a depth of 30 cm is shown in Figure 4.6.
Peak Area vs Hydrocarbon Group (30cm)
Peak Area vs Hydrocarbon Group (40cm)
Peak Area vs Hydrocarbon Grouping (50cm depth penetration)
UVIVISmLE SPECTROPHOTOMETER ANALYSIS
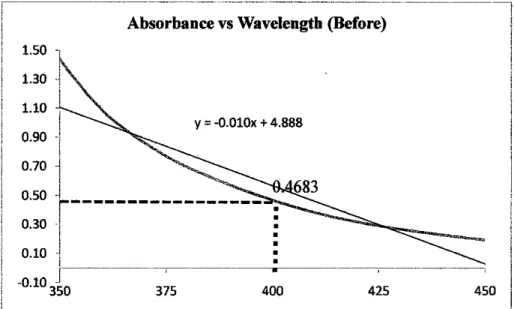
This analysis was performed to identify the hydrocarbon reduction from the treated samples of hydrocarbon contaminated soil. UVNisible Spectrophotometer analyzes determine the percentage of hydrocarbon reduction through absorbance at specific wavelength. The wavelength for the experiments set at 400Nm based on the main functional group which is the alkane group.
HYDROCARBON REDUCTION
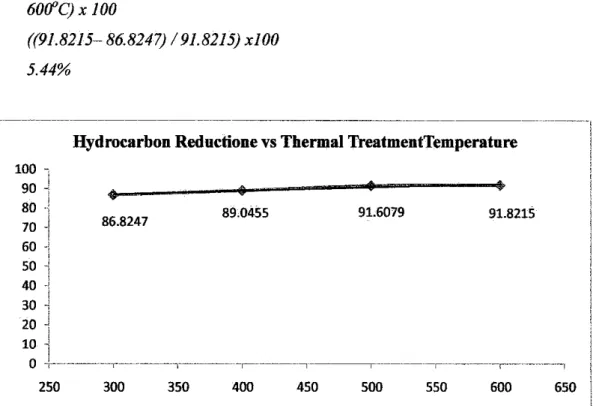
According to the absorption resulting from the analysis; the hydrocarbon reductions detected in the analysis of the contaminated soil samples were identified. From the experiment on the hydrocarbon contaminated soil samples treated by thermal treatment at a temperature of 300°C, it was found that the absorbance of the liquid solution is 0.0617, as shown in Figure 4.10. The result shows that the absorption is much lower compared to the absorption of soil samples before treatment.
The slope for graphene also shows that the gradient is smaller compared to the gradient of graphene for soil samples before thermal treatment. From the results, the hydrocarbon content of the soil sample is reduced after undergoing thermal treatment. For the sample treated at temperature 300°C, the reduction of hydrocarbon in the soil samples was about 86.82%.
DISCUSSION
The aromatic hydrocarbon contamination is slightly different where the aromatic group is found higher in soil samples collected from soil surface compared to soil samples collected from other areas (depth penetration). At Ocm the aromatic group contaminated about 5% in the soil while other areas: 10cm, 20cm, 30cm, 40cm and 50cm depth penetrations are only about 1%. The percentage of alkanes group in contaminated soil samples at different depth penetrations is shown in Figure 4.15.
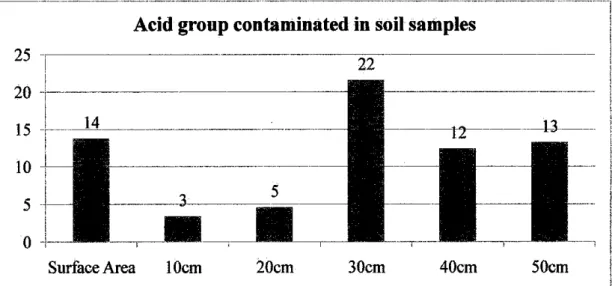
Aromatic group contaminated in soil samples 5
The hydrocarbon group alcohol which is contaminated in all the soil samples, but is more contaminated in the soil samples collected at surface area to sample at depth penetration 20cm compared to soil samples collected at depth penetration between 30cm to 50cm, while this phenomenon is opposite for ketone groups which are more contaminated for samples at depth penetration between 20cm and 50cm compared to samples collected at surface area until soil sample located at depth penetration 50cm. There is no ketone contamination in the samples at surface area, 1 Ocm depth penetration and 30cm depth penetration. The soil contamination of aldehyde group is a little different where the contamination is spread from surface area to depth penetration at 50cm.
Contamination of alcohol group, aldehyde group and ketone group in soil samples is shown in Figure 4.17. Hydrocarbon soil contamination samples are classified into hydrocarbon groups as shown in Figure 4.18. The largest contamination is the alkane group, followed by the acid group, which contaminated about 76% and 12% to the soil.
Peak Area vs Grouping
HYDROCARBON REDUCTION (REMOVAL)
UV/visible spectrophotometer analysis on the contaminated soil samples shows that the content of contaminated hydrocarbon components decreases after undergoing thermal treatment. The thermal treatment process on the contaminated soil samples was treated using fixed bed activation unit. The soil samples contain the main hydrocarbon form alkanes group which about 85o/o of the contaminants and have their carbon chains between C2 to C20 were experimented in the treatment of the contaminations by means of thermal treatment at four different levels of temperature.
From analysis of the solutions using a UV/visible spectrophotometer, the reduction of the hydrocarbon in the soil samples was determined. From the calculation above, the different efficiency of thermal treatment at 300°C compared to 400°C is about 2.494%. It is about 5.44% of different efficiency of thermal treatment on the soil samples treated at 300°C and 600°C.
CHAPTERS
CONCLUSION
CONCLUSION
From the result, the heat treatment efficiency of the samples is not much different between the amount of treatment temperature from Joo•c to 6oo•c. In conclusion, the main contaminating hydrocarbons in the soil samples which contributed about 85% of the pollutants is from the group of alkanes containing carbon chain in C2 to C20• The pollutants showed the same hydrocarbon compositions found at every level of the soil samples taken in different depth penetration from Ocm to 50cm depth penetration. With contaminants, the optimum temperature for heat treatment in removing contaminants in coriminated soil is 300°C.
With an average of 90% hydrocarbon removal, the experiment determined that the thermal treatment is one of the best and suitable for the treatment of the sea soil contaminated with hydrocarbons.
Bucala, (2007) Effect of temperature on the release of hexadecane from thermally treated soils, Journal of Hazardous Materials, Volume 143, p. 4 5 5--461. Groundwater and Soil Vulnerability in the Langat Basin, Malaysia, European Journal of Scientific Research, Volume 27, Issue 4, p. 628-635. Surfactant-Enhanced Remediation of Organically Contaminated Soil and Water Advances in Colloid and Frontier Science, Volume 138, Issue I, p. 24-58.
Assessment of geo-environmental effects of oil pollution in coastal sediments of Bushehr province -Iran.
APPENDICES
APPENDIX A
GAS CHROMATOGRAPHY MASS SPECTROMETRY
FORMI:JLA CIROUJ>ING