Utilization of C02 for Enhanced Oil Recovery
By
Erni Yusniza Khaled (915)
Final Draft submitted inpartial fulfillment of
the requirements for the
Bachelor ofEngineering (Hons)
(Chemical Engineering)
November 2002
University Teknologi PETRONAS
Bandar Seri Iskandar 31750 Tronoh
Perak darul Ridzuan
CERTIFICATION OF APPROVAL
Utilization of C02 for Enhanced Oil Re-overy
By
Erni Yusniza Khaled (915)
A project dissertation submitted to the Chemical Engineering Programme
Unversiti Teknologi PETRONAS In partial fulfilment of the requirement for the
BACHELOR OF ENGINEERING (Hons)
CHEMICAL ENGINEERING
Approved by
(Ir Abdul Aziz b. Omar)
2 If If
cr UNIVERSITI TEKNOLOGI PETRONAS
Z& TRONOH, PERAK
3-O0J-
NOVEMBER 2002
f- (fri/bm Atvxjttt a.LE—'jfafyn
CERTIFICATION OF ORIGINALITY
This is to certifythat I am responsiblefor the work submitted in this project, that the original work is my own except as specified in the references and acknowledgements, and thatthe original workcontained herein havenot been undertaken or done by unspecified sources or persons.
ERNI YUSNIZA KHALED
wti Y<Jt/r Jl:sir-irvh Fri'tcu? fECB 50:14}
ABSTRACT
The purpose of the project is to develop a framework, which will enhance students' skills in the process of applying knowledge, expending thoughts, solving problems independently and presenting findings through minimum guidance and supervision The title for this research project is 'Utilization of C02 for Enhanced Oil
Recovery'.
C02 is a colorless and odorless gas that exists in the atmosphere in small quantity. However it is one of major greenhouse gases that have a significant impact in society, economics and environment. The increase in anthropogenic or human-related in the accumulation of C02 in atmosphere as the amount ofC02 emitted is greater than that consumed. In Malaysia, liquid hydrocarbon fuel has been the major contributing source of C02 emission. C02 emission from gaseous hydrocarbon fuel has been increased tremendously in the 1990s, as a result of the impact of global warming and climate change, there is a significant international effort including the emissions of C02. This study is carried out to recommend technically viable C02 management for enhanced oil
recovery.
EOR refers to any process used to increase the ultimate recovery from the reservoir except the injection ofplain water or low-pressure gas into a reservoir. It can be
at the secondary stage or at the tertiary stage. US National Petroleum Council definedEOR in their Enhanced Oil Recovery report (1976) as; Enhanced oil recovery is the
additional recovery of oil from a petroleum reservoir over that which can be
economically recovered by conventional primary and secondary methods. Atechnically more restrictive definition, EOR consists of methods aimed at increasing ultimate oil recovery by injecting appropriate agents not normally present in the reservoir to induce
new mechanisms for displacing oil.
In the name ofAllah, The Most Passionate and The MosfMerciful
Firstly, Alhamdulillah, with His bless, I have been able to finish working on the Final Year Research Project successfully. This project, which entitled C02 Utilization for Enhanced Oil Recovery, is done for the period of 14 weeks throughout this
semester.
I would like to thank several people who helped me in achieving the objective of my project and in completing this final report. In particular, my deepest thanks go to my supervisor, Ir Abdul Aziz b. Omar, who contribute a great deal of attention and did not hesitate to provide me with any of his valuable time throughout the project period. I am also very grateful to PRSS staffs that had helped a lot in understanding and gave all information and encouragement.
To the FYP Committee in Universiti Teknologi PETRONAS (UTP), En Lukman Ismail and Puan Anis, thank you for the patience you have in handling the
students.
To end with, thankyou goesto my dearest family and friends, who always bring out the best in me and always keep me on the right track.
usi Yw J\c.-i&n-rfc Project sbX'B f!j5-t}
TABLE OF CONTENTS
* No Content
Title page
Abstract
Table of content
4 ] List of figures
10
11
u
List of tables
Abbreviations and Nomenclatures Chapter 1; Introduction
1.1) Background
1.2) Problem Statement
1.3) Objectives and Scope ofStudy Chapter 2; Literature Review and/or Theory
2.1) Definition ofEOR 2.2) Benefits ofEOR
2.4) Economic Factor of EOR 2.3) Limitation ofEOR
Chapter 3: Methodology/Project Work 3.1) Data Gathering Process
3.2) Miscible/Immiscible Gas Injection Techniques
Chapter 4:Results and Discussion 4.1) Current Gas C02 Production 4.2) Current Reserves
Chapter 5: Conclusion and Recommendation
References Appendices
n
Page
u
i n
m
IV
1 10 20
21 23 23 26
27 28
33 36
ls~
~40~
~41~
fimi fear Pe?;mrrh Protect ?i;X"B $034!
LIST OF FIGURES
1) Figure 1: Pressure - Temperature (P-T) Diagram for Carbon Dioxide 2) Figure 2: Global Carbon Dioxide Emissions from Fossil Fuel
3) Figure 3: Trends inUS C02 Emissions
4) Figure 4: US Carbon Dioxide Emissions by Fuel and Sector (1994)
5) Figure 5: Global C02 Concentration
6) Figure 6: C02 Emission Intensity and C02 Emissions
7) Figure 7: C02 Emission Intensity (average ofoperational thermal power station) 8) Figure 8: Reduction ofC02 Emissions by the Optimal Generating Configuration.
9) Figure 9: International Comparison ofC02 emission intensities 10) Figure 10: Chart Shown Undiscounted Cost Element Before Taxes 11) Figure 11: lOOOpsi -Immiscible Carbon Dioxide
12) Figure 12:1500psi - Miscibility Begins to Develop
13) Figure 13: 2500psig - C02 has Developed Miscibility with the Oil
14) Figure 14: Lower Liquid Begins to Condense 15) Figure 15; Final Stage - Gas Immiscible 16) Figure 16: Miscible Gas Injection Diagram 17) Figure 17: Immiscible Gas Injection Diagram
18) Figure 18: Current Production Gas Network
19) Figure 19: C02 Reserve from Respective Oil and Gas Fields 20) Figure 20: Average C02 Content for Each Oil and Gas Fields
i n
visit ii Yen')' /ur.Vi-.v?
i.()2 \''fil>ztft!o?< ft
~rh Prwca fPCB $034}
.>r hi&mccd On Rwavcrv
LIST OF TABLES
1) Table 1: C02 Physical and Chemical Properties
2) Table 2: Estimated C02 Emissions for 1993,1994 and 1995
3) Table 3: GHG Emissions forecast
4) Table 4: Screening Criteria for EOR
5) Table 5: Average Composition of OSC (1997-2000) 6) Table 6: Average Composition ofOGT (1998-2005)
IV
lyttfi V^rrIhwitvft Pru^u ti-X'B $0)4}
f l>2 litilizittionfor fafhinwd{fitRirtiwr.
ABBREVATIONS AND NOMENCLATURES
AKG atm Bscf CFCs CH4 C02 EIA EOR EU FCCC GDP GHG GtC HFCs IPCC JDS JE LA LNG LPG MMP N20 OGT OSC PFCs PGU ppm RDS SF6 USA USD WAG
Angsi atmosphere
Billion standard cubic feed chlorofluorocarbons methane
carbon dioxide
Energy Information Administration's
Enhanced oilRecovery
European Union
Framework Convention on Climate Change
Gross Domestic product
Greenhouse Gas Giga tonne Carbon Hydrofluorocarbons
Intergovernmental Panel on Climate Change
Joint Delivery System
Jerneh Lawit
Light "Natural Gas Liquidpetroleum Gas
minimum Miscibility Pressure
Nitrous Oxide
Onshore Gas Terminal
Onshore Slug Catcher perfluorocarbons
Peninsular Gas Utilization part per million
Resak Delivery System
sulfurhexafluoride United State of America United State Dollar
Water Alternating System
v
final Year Research Project ftJCB 5034) Chapter 1
C(J2 Utilization for Enhanced Oil Recovery Introduction
f-tv*—••- "• "T»*^» • f | • • • -jii •••• »m- «u*"W»"* •!'•! —• F' HI • •» IJjw] "vmsM n •• *r—m
1.1 Background of Study , „
1.11 WhatisC02?
C02 is a colorless and odorless gas that exists in the atmosphere in small quantity. However it is one of major greenhouse gases that have a significant impact in society, economics and environment. The increase in anthropogenic or human-related in the accumulation of C02 in atmosphere as the amount of C02 emitted is greater thatthat consumed. In Malaysia, liquid hydrocarbon fuel has been the major contributing source of C02 emission- C02 emission from gaseous hydrocarbon fuel has increased tremendously in 1990s. As a result of global warming and climate change, there is significant international effort including the emissions of C02. This study is carried out to recommend technically viable C02 management for enhanced oil recovery.
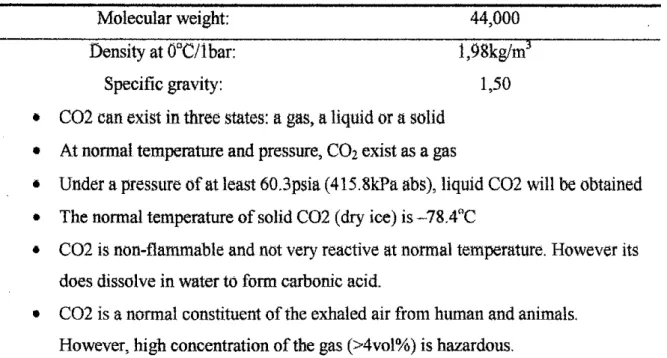
Table 1: C02 Physical and Chemical Properties
Molecular weight: 44,000
Density at 0DC/lbar: l,98kg/m3
Specific gravity: 1,50
C02 can exist in three states: a gas, a liquid or a solid At normal temperature and pressure, CO2 exist as a gas
Under a pressure of at least 60.3psia (415.8kPa abs), liquid C02 will be obtained The normal temperature of solid C02 (dry ice) is -78.4°C
C02 is non-flammable and not very reactive at normal temperature. However its
does dissolve in water to form carbonic acid.
C02 is a normal constituent of the exhaled air from human and animals.
However, high concentration of the gas (>4vol%) is hazardous.
h'wal Year Research Project itX'B 5034)
( 7)2 VUhzatioii inr Enhanced Oil Rcanwv
Chapter 1
li'iirod'ochon
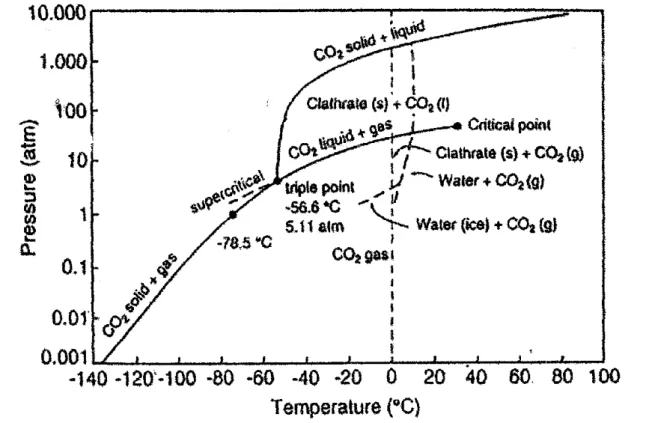
-140-120-100-80 -60 -40 -20 0 20 40 60 80 100
Temperature (°C)
Figure 1: Pressure-Temperature (P-T) Diagram for Carbon Dioxide
h'iital Year Research Project (RCR 5034} Chapter 1.
(. 7)2 (hih~aiio)i for Pnhoncvd Oil Ri-ctsi-en: Introduction
1.12 CQ2 Emission / Consumption
• Carbon dioxide in nature:
Carbon dioxide is the important link in the mutual dependence cycle between plants i andanimals in nature. Given offby animal life in respiration and absorbed by plants in the process of photosynthesis, thecarbon dioxide cycle affects every living thing. The
atmosphere is nature's great storehouse for carbon dioxide, containing billions oftons, even though carbon dioxide represents only three parts per 10,000. Not only animal respiration, but combustion and decay are continually contributing carbon dioxide to
theatmosphere. In fact, wherever carbon or its compounds are burned oroxidked,carbon dioxide is formed.
• Carbon dioxide in industry:
The large quantities ofcarbon dioxide required for commercial use are obtained by a
number of methods, chiefbetween which is the recovery and separation of the carbon dioxide content of the exhaust gasses from combustion of a hydrocarbon - such asnatural gas or oil. Carbon dioxide is also produced as a by-product from the production ofammonia, lime orphosphate, from the fermentation ofbeer oralcohol, and from
natural carbondioxide wells. The versatility of carbon dioxide in each of its three forms- as a gas, liquid orsolid - has stimulated its application to many industrial problems.
The ability to offer extremely fast cooling together with absolute control makes carbon dioxide the perfect super-coolant for manufacturing processes and transportation.
Carbon dioxide's physical characteristics make it an ideal inerting agent and pressure
medium, while its unique chemical properties give C02 a role inmany industrial
processes that cannot be performed by any other substance.U Year i<esearcri J'roj Chapter
huroducuo
The buildup of carbon dioxide accounts for about two-thirds of the human sources
ofexcess greenhouse warming from long-lived gases. (Figure 2 shows the history of
globalC02 emissions.)
:^$!itta$£^^
'§t£$£2&£$^
818
$tim I88ff 1S0¥ "..%l¥2# 1940 $B0#
Figure 2: Global carbon dioxide emissions from fossil foels
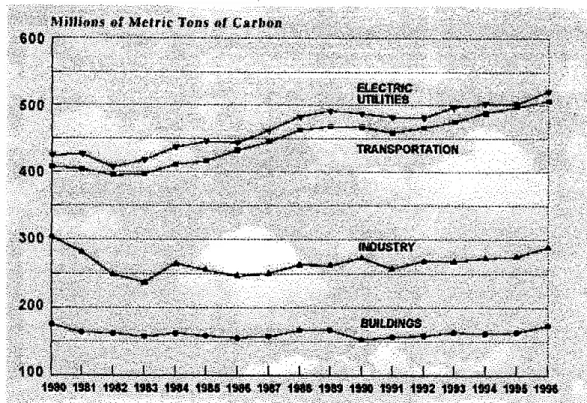
Each year, the burning of fossil fuels and biomass, along with other activities such as cement making, releases over seven bi.lii.on metric tons of carbon to the atmosphere in the form ofC02, raising the atmospheric concentration ofthe gas by about half a percent annually. Figure 3 shows C02 emissions for the United States for the period 1980 to
1996.
h'iual Yew ResearchPr<rjeci (tA 'H 5054}
('02 XHihzation ior Enhanced Oil Recover
Millions »t Metric Tons itt Carbon 600
500
400
300
£00
100 J I L
£L£CTftC ummEs
BUILDtHGS
J I L J L
Chapter i
introduction
1980 1381 1W2 1983 1984 1986 19« 1987 1988 1989 1990 1991 1992 19W 1994 199ft 1998
Figure 3: Trendsin U.S. C02 emissions
Millions nt Tons of Carbon
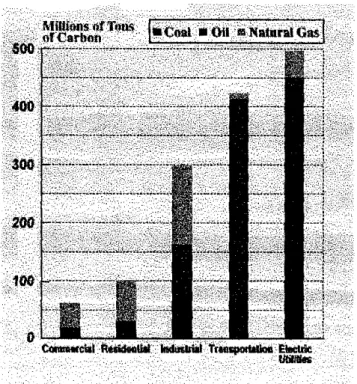
CommMcbt tosidMllal htduelriil TtMsportiUoo Eteclik
ttbNfts
Figure 4:U.S. carbon dioxide emissions by fuel and sector (1994)
IRiud Year Re-warchProject {Rt'R 5044}
introcluCUon
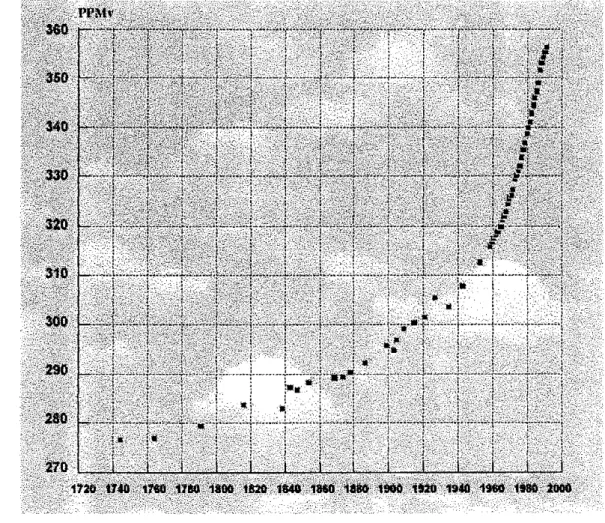
Note that electric-powerproduction and transportation are by far the largest and fastest-growing sources. With current global emissions of some 6.3 billion metric tons per year- (1995}. fossil fuel combustion is the best quantified and the largest source of C02 from human activity. Since preindustrial times, the global f 02 concentration has increasedalmost 30 percent, from 280 parts per million (ppm) to about 360 ppm today.
(See Figure 5.) Carbon dioxide stays in the atmosphere 50 to 200 years,
PPMv 360
350
340
• '. i
\- -j—j ! 1 i- ! i ! :/l
j ! ; j
i i !
330
1 i • i
I j !
i l l ! - : : : : *:* *
320 1 1 1 | -; f j- -; r -
i i '. « :
i i * .
! i \i '• !
i * :
310
• i •
• I * '' :
' m
! *:
300
• \ i
! i <
•f i j ; |
290 - - - ; - - -j f "-
: «
: 1 1 . !
230
• • 1*
": *:
-4 | 1 •••-' i
270 I i \ i i i i i i i i i i i
1720 1740 17*0 1780 1800 1820 1840 I860 1080 1900 1920 1940 1060 1900 1000
Figure 5: Global C02 concentration
hRkit Year Research Project (t:\ 43 5054}
002 {h.daaiion lor Enhanced Oil Recovery Introduction
While electricity generated hasbeengrowing, the C02 emission intensity has beendeclining due to the net effects of expanded nuclear capacity, improved thermal efficiency of thermal power generation and increased thermal power stations fired by LNG, which offers low£02 emissions compared with otherfossil fuels.
Hundred thousand t-CO 2 or hundred million kWh/uear
4,000
C02 emission intensity r*—Estimates (average of all operation never , ,, i''
stations) [Y-axis: -*] ]1i|1' 3,0821,,."'
kl-C02/fcWh 0.7
3,500 3,000 2,500 2,000 1,500
1,000 500 0
i ' '
0.6
0.5
0.4
0.3
0.2
0.1
J L 0
C02 entissfans [Y-axis: 4-J
m'1
J LL
,„""""""
»
1970 1975 1980 1985 1990 1995 2000 2005 FY
Figure 6: C02 emission intensity (per kWh electricity by all operational power stations)
and C02 emissions
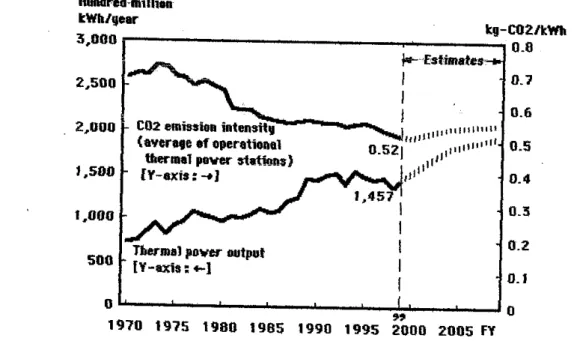
The C02 emission intensity has been on the decline due to the net effects of increased thermal efficiency of thermal power generation as well as expansion of thermal power stations fired by LNG, which has smaller C02 emissions compared to other fossil
fuels.
Char Introdut r-Wtii icar f<esearvh.Project (PC-M 5034}
Hundred million fcWh/year
3,000 kg-C02/kYni
0.8
^Estimates*
0.7
0.6
0.5
0.4
0.3
0.2
0.1
0
2,500
2,000
1,500
1,000
500
CD2 emission intensity (average of operational
thermal paver stations) {Y-axis:-♦3
Ni^ ' ;;;;
0.521 .m"""
Thermal paver output [Y-axis s*-l
»
1970 1975 1980 1985 1990 1995 2000 2005 FY
Figure 7: C02 emission intensity (average ofoperational thermal power stations)
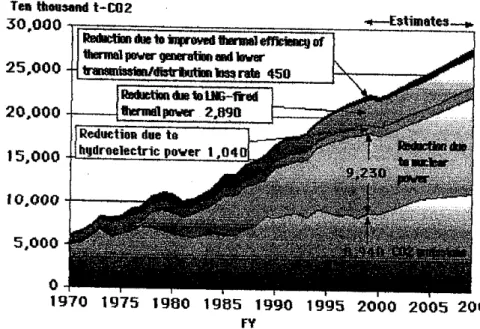
C02 emissions have been reduced through avariety of measures, such as the promotion ofthe optimal generating configuration with an emphasis on nuclear, hydroelectric and LNG-fired thermal power stations, improvements in the thermal efficiency ofthermal power generation, and reductions in the transmission and
distribution loss rate.
Ten thousand t-CG2 30,000
Rerfnctimowtoiii^ovedlhereMleffitiHM^of
thermalpowergeneration endtower tratsmmlon/dbtrhjtimtossrate 450
•*—Estimates
1970 1975 1980 1985 1990 1995 2000 2005 2009
FY
Figure 8: Reduction ofC02 emissions by the optimal generating configuration, etc
XI i
tion
faaai Year fhescan-fo Proicci (P('R 5054}
( V)2 {hJhzaaon for Enhanced 04 Reeoverv Chapter i
ntroduction Note 1:
The amount ofC02 emissions reduced by improving the thermal
efficiency ofthermal power generation and lowering the
transmission/distribution loss rate was calculated with fiscal year 1970 as the base y^ar. The reductions due to the expanded use ofnuclear power, hydroelectric *md LNG-fired stations were calculated on the assumption that these facilities served as replacements for thermal power stations
other than LNG-fired ones.
Note 2; The amount ofC02 sequestered inthe green tracts ofland we own is estimated at about 140,000 t-C02 annually.
The C02 emission intensity (average for all operational power stations) of TEPCO is lower than the intensities for the major European countries and the United States, although itis higher than the intensities for Canada, where hydroelectric power holds alarger percentage share ofthe total capacity, and France, where nuclear power
predominates.
ke-C02/kWh ^ j<^™»^i*nsibj(Bv«TB»Ei*oijer^
10 | [_J DSZamssimnta^Caraaqeofaneptir^^
o.b^" a*
08!
0.6
0.4- E
f
0.2^
I fj L
I
0.0-1
018
0061
n i
Canada France Germany Italy Britain USA
U.65 O 67
0541
050
n
0.85 083 I
058 0.58
05?
0 45 0.48
n
i
i
•
0 53
0.2* i
I
Japan (FY! 999)TEPCO1Averageof six countries {Canada, iFrance,Germany, Italy, Britain and
USA.)
Figure 9; International comparison of C02 emission intensities
m>ui u-ur Research JOotcct (hi J3 $OPn
* yn r >ti!^...,.-, _•• ,. r ', - ," . tnapter i
'• i>i >. -yhuuisomDr sniariccdtn Re^>very ? - • •
•-~-n-.1 Introduction
1.2 Problem Statement
U1 Background on Climate Change Concerns
The United Nations Framework Convention on Chmate Change (FCCC), negotiated in Rio de Janeiro in 1992, became effective in March 1994 after the first 50 nations ratified the treaty. Many meetings have been held under UN auspices and more than 160 nations have now ratified the treaty, but disagreement remains concerning the whole issue of global climate change. For example, there is alack ofagreement among:
• Scientists concerning the nature, causes and import ofpotential chmate changes.
• Nations on the steps that should be taken to limit emissions ofgreenhouse gases
(GHGs) that may contribute to climate change and which nations should take
action and/or bear the economic cost ofthe action.
• Policy makers in the US. (and other countries) on the need for and nature, effectiveness, timing and economic impact ofmeasures that might be taken to
limit GHG emissions.
The FCCC set an ultimate objective of "stabilization ofgreenhouse gas
concentrations in the atmosphere at alevel that would prevent dangerous anthropogenic (man-made) interference with the climate system..." The convention did not specify
targets or timetables for achieving this objective but did require the developed countries to report on the policies and measures they adopt "...with the aim of returning
individually or jointly to their 1990 levels...anthropogenic emissions of carbon dioxide
and other greenhouse gases..."
As detailed in Attachment A, the FCCC assigns the lead responsibilities in
"combating climate change" to certain "developed" countries. It lists other countries
10
h'iirai Year Research Ih'Ojcci {E\ P 5034} '">".nv- i
\ 4)2 ihiOcuRo}; tor Enhanced Oil ^e^ixerv \**ir-A,\.*ii-n
(principally from the former Soviet Union and Eastern Europe) that emit large amounts ofGHGs, but recognizes that these nations may not now have the resources needed to reduce emissions. The other 100+ nations that have ratified the FCCC have only limited obligations to reduce GHG emissions. Note that anumber ofthe nations in this latter group are large and/or rapidly developing countries those c+e now or may become competitors ofthe US. in international markets (e.g., China). Nations in each ofthe three categories are listed inAttachment Aofthis report.
The United States and other industrialized countries ofthe world now contribute a large share ofthe anthropogenic GHG emissions. However, the growths in GHG
emissions in the years ahead are expected to come, overwhelmingly, from "developing"
countries such as China and India. Infact, the increases in GHG emissionsfrom
developing nations are expected to greatly exceed any reductions that might be made by the industrialized nations. This fact contributes to the controversy surrounding the
climate change debate.
Despite the disagreements, parties to the treaty, including representatives ofthe U.S., will be meeting in Kyoto, Japan, in December 1997 to set targets and timetables for the reduction ofgreenhouse gases. Among the targets and timetables that have been proposed within the UNfor the "developed" countries (not all countries) are the following three alternative requirements for reductions inGHG emissions below 1990
emission levels:
• A 20% reduction in carbon dioxide emissions by 2005.
• A10% reduction in carbon dioxide emissions by 2005 and a 15-20% reduction by
2010.
• A5 to 10% reduction inall greenhouse gases by 2010.
11
hfmi Year Research Project {OCR 50$4i ^„1T ,
— l-"> Introduction
1.22 Greenhouse gas
Many chemical compounds found in the Earth's atmosphere act as "greenhouse gases." These gases allow sunlight, which is radiated in the visible and ultraviolet spectra,
to enter the atmosphere unimpeded. When it strikes the Earth's surface, some ofthe sunlighi is reflected as infrared radiation (heat). Greenhouse gases tend to absorb this infrared radiation as it is reflected back towards space, trapping the heat in the
atmosphere.
Many gases exhibit such "greenhouse" properties, including those that occur naturally in the atmosphere, such as water vapor, carbon dioxide, methane, and nitrous
oxide, and those that are man-made, such as chlorofluorocarbons (CFCs), hydrofluorocarbons (HFCs), perfluorocarbons (PFCs), and sulfur hexafluoride (SF6).
Atmospheric concentrations of several important greenhouse gases (carbon dioxide, methane, nitrous oxide, and most man-made gases) have increased by about 25
percent since large-scale industrialization began some 150 years ago. The growth in their concentrations is caused by human (anthropogenic) activity. In particular, anthropogenic carbon dioxide emissions have increased dramatically since the beginning of the
industrial age due largely to the burning of fossil fuels and deforestation
Given the natural variability ofthe Earth's climate, it is difficult to determine
whether any change can be attributed to human activity. Evidence accumulated by the Intergovernmental Panel on Chmate Change (1PCC), indicates that global mean surface
air temperature has increased between approximately 0.3 and 0.6°C (0.5 and 1.1°F) since the late 19th century. Although there is considerable uncertainty about whether this temperature increase has been caused by anthropogenic greenhouse gas emissions, the IPCC has concluded that the balance ofevidence suggests that there has been a discernible human influence on global climate.
13
h'iihii Year Research Jh'ofect (POR 5054} Chapter I
(44P I'Oheaaonfor Enhanced OH Recovery Introduction
1.23 Sources of Greenhouse Gases
As explained in more detail in Attachment B, greenhouse gases(GHGs) come from a variety of natural and human activities, particularly the production and use of energy. GHGs include water vapor, carbon dioxide, methane, nitrous oxide, and others.
Water vapor is recognized as the most prevalent GHG by far, but most water vapor comes from natural sources and is not subject to control. Those who are expressingthe most concern about the potential for "global warming" are, instead, focusing their attention on GHGs that resultfrom anthropogenic (man-made) activities, with the greatest attention focused on emissions of carbon dioxide (CO2).
The burningof fossil fuels (coal, oil and natural gas) are the primary sources of carbon dioxide emissions in the U.S. In addition, non-fuel uses of energy (e.g., for making fertilizers or steel) and a variety of other activities are also sources of GHGs.
Tables included in Attachment B provide data on:
• Sources of GHG emissions, including carbon dioxide (CO2), methane (CH4), nitrous oxide (N2O), CFCs, HCFCs, and "criteria pollutants."
• "Global warming potential" (GWP), which varies widely among the various
GHGs.
• The relationship between carbon dioxide (C02), carbon, and carbon equivalents of
GHGs,
The following table showsthe Energy Information Administration's (EIA) estimates of U.S. carbon dioxide (CO2) emissions fromfossil energy consumption by
each end-use sector:
14
h'inal Year Research .Project (14. 43 5054}
( 44P Ihilrzuiion lor Enhanced OH Recorerv
Chapter 1
Introduction
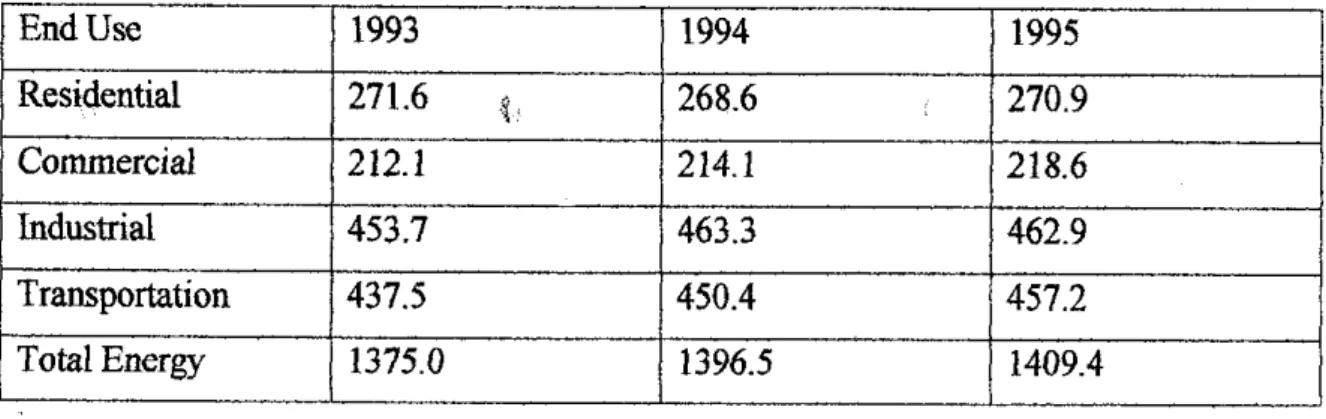
Table 2: Estimated C02 Emissions for 1993,1994 and 1995 - in Million Metric Tons of
Carbon
End Use 1993 1994 1995
Residential 271.6 {, 268.6 270.9
Commercial 212.1 214.1 218.6
Industrial 453.7 463.3 462.9
Transportation 437.5 450.4 457.2
Total Energy 1375.0 1396.5 1409.4
EIA has also produced estimates of U.S. methane (CH4) emissions. These estimates are shown in Attachment C. Methane emissions in the U.S. are much smaller
than carbon dioxide emissions, butare considered important because the "...heat-trapping capacity of methane is 21 times thatof carbon dioxide..." and "after weighting emissions by the global warming potential of each gas, methane represents 10percent of all U.S.
anthropogenic emissions."
Actions to require reduction in methane emissions would be particularly important for the people of Texasbecause significant economic activities in Texas contribute to methane emissions. These include oil and gas production, chemical production, transportation and combustion of fossil fuels (automobiles, electric generating plants and industrial facilities), and rising of cattle and other farm animals.
15
Pinal Year Research J'rojcci (P'443 5054} Chanter ]
(. iP OueaaitonOor Rnhanccd Oil Recovery hUrodnction
1-24 Greenhouse Gas Emissions from Sources Other than Energy
In addition to Texas' uses of energy, a variety of other activities in the state
contribute to GHG emissions. Data are not readily available ona state-by-state basis to estimate the amounts ofemissions. However, it is important to recognize that these activities would be counted as contributing GHG emissions, and measures might be
established to force or encourage reductions in the activities and/or the emissions
resulting from them. These other activities, along with emission data, where available, are
as follows:
1. Fertilizer. The use offertilizer results inGHG emissions inat least two ways:
• Natural gas and liquid petroleum gas (LPG) are used in producing fertilizer.
• Nitrogen based fertilizers are a source of nitrous oxide (N20),which is a greenhouse gas.
2. Raising livestock. Cattle and calves (Texas had 14,800,000 in 1994,) are one ofthe
sources ofmethane (CH4) that is also a greenhouse gas. Methane results from incomplete
digestion and from animal wastes.
3. Other activities. Avariety of other activities, while making up relatively small portions of Texas' Gross Domestic Product (GDP) also involve GHG emissions. These include (but are not limited to) the following:
a) Various industrial activities that are dependent upon adequate andreasonably priced energy butrequire lesser amounts than the industries listed above; e.g., companies thatare in such industries as electronics, industrial machinery and
equipment, transportation equipment, food processing, construction, and trucking
and warehousing industries.
16
h'wai Year Research Project (Li 43 5054} Chapter 1 (. 'i P I iultzaiion lor Enhanced (41 Recovery Introduction
b) All industriesthat are dependent upon raw materials producedelsewhere and require significant amounts of energy and/or emit methane or other greenhouse gases in order to-produce those raw materials (e.g., production of iron, steel, aluminum). Also, significant amounts of C02are released during calcination of , limestone for cement production, lime manufacture, limestone and dolomite consumption, soda ash manufacture and consumption, and industrial carbon
dioxide manufacture.
c) Military activities, which are important in the Texas economy, require substantial amounts of energy; e.g., fuel for military aircraft and ships.
d) Methane (CH4) is released from incomplete combustion of fuels in automobiles, aircraft, ships, and locomotives.
e) Methane (CH4) released from landfills, domestic and commercial wastewater treatment facilities, and burning of crop residues.
17
F'mal Year Research Project (E< 43 5054}
f. 4)2 {kihr-aikmlnv Enhanced OH Recovery
1.25 Greenhouse gas emissions - Current Scenario
Charter 1 IntTOGUClJOT'i
Amongst the pollutants mentioned by the Kyoto Protocol, the following
greenhouse gas emissions are inventoried: carbon dioxide, nitrogen oxides andmethane.
Othergases included in the protocol will be inventoried in the future, suchas fluoridation hydrocarbons, perfluorocarbons and sulphur hexafluoride.
The carbon dioxide emission in 1989 was of 194,826 Gg (considered to be a reference value), andthe level for 1994 was of 125,597 Gg, following thatan updated inventory for greenhouse gases willbe conducted andvalidated in 2001, from the perspective of the new data reporting system.
Table 3: GHG emissions forecast (GgCO2 equivalent /year)
Reference scenario
Total emission of CO2 Total emission of CHj Total emission of N2O
Total emission Minimum scenario
Total emission of C02 Total emission of CH4 Total emission of N20
Total emission Maximum scenario
Total emission of CO2 Total emission of CI-Cj Total emission of NjO
Total emission
2000 2005 2010
162,334.8 187,794.0 228,535.7
33,531.0 36,740.0 43,125.0
8,480.0 10,240.0 12,704.0
204,345.8 234,774.0 284,364.7
158,445.9 178,926.0 201,447.5
33,445.0 33,712.0 36,368.0
8,128.0
' 9,024.0
10,112.0200,019.0 221,662.0 247,927.5
150,807.9 156,432.0 167,655.5
32,879.0 32,164.0 32,227.0
7,744.0 7,904.0 8,256.0
191,430.9 196,500.0 209,138,5
18
Final Year Research Project (FOB 5034) Chapter 1
C02 Utilization for Enhanced Oil Recovery Introduction
In Kyoto, Japan, 1-11 December 1997, 167 countries reached an agreement, known as the 'Kyoto-ProtocoP, which establishes the terms and rules of monitoring the gas that determine the greenhouse effect for the earth. The Kyoto Protocol provides that=
till 2012, the medium quantity of GHG (six gases in particular) to be reduced with 5.2%
below the level from 1990.
The main methods that must be taken into consideration in order to achieve the objectives of the Kyoto Protocol are:
• The industry must become more efficient from the point of view of energy consumption, shifting from the use of fossil fuels with the high carbon content (coal) to fuels with a low-grade of carbon (natural gases) or alternate fuels.
• The energy sector,from extraction till consumption, must be restructured so that it becomes more efficientand less pollutant.
• The transportation must use low consumption and less pollutant means of transport
• The construction sector must be energy efficient
• The equipment and the products must have low energy consumption
• The forests will be protected and even extended.
19
i'mat Year PesearctiProject (Pi 45 5054} Chanter ]
(^)2 OiPration for Enhanced (PI Recovery
Infroduction
1.3 Objectives and Scope of Study
The main objective ofthis study are:
* To review oftechnologies for C02 utilization by enhanced oil recovery
• To review current status of C02 production from various field in Peninsular Malaysia
• To investigate the technical applying carbon dioxide and hydrocarbon
miscible flooding in selected oil field.
• Beside that, by doing this study, an experimental research on feasible
candidate fields to establish the behavior of reservoir rock andfluid underEOR conditions.
• To investigate the technical feasibility of increasing oil recovery efficiency and reserves ofmajor producing field though an EOR process
utilizing C02 gasinjection.
20
bwo! )\jorRc-ween-h FrcjcU (hl'B $054}
( iP tiiiiicuwoft ior hnfarnecd(41 Pi'co-vcrv 'ievi/ iiViij/or Tueorv
Chapter 2: LITERATURE REVIEW AIND/OR THEORY
2.1 EOR-Definition
EOR refers to any process used to increase the ultimate recovery from the reservoir except the injection of plain water or low-pressure gas into a reservoir. It can eitherbe at the secondary stage or at the tertiary stage. US National Petroleum Council defined EORas 'Enhanced oil recovery is the additional recovery of oil from a petroleum reservoir over that which can be economically recovered by conventional primary and secondary methods'. A technically more restrictive definition is EOR consists of methods aimed at increasing ultimate recovery by injecting appropriate agents notnormally
present in the reservoir to induce new mechanisms for displacing oil.
This graphic represents a Carbon Cycle as it is unique to the energy industries.
The normal situation is that waste gases, especially C02, from refining processes and fuel combustion are mostly vented to the atmosphere after taking out only some of the most noxious by-products. Our goal should be to capture as much of this waste gas from energy production as possible, and put it to good economic use, or return it to the underground reservoirs where it originated. In theory, all the waste C02 gas from fossil fuel combustion has a place back in the earth from whence the fossil fuel came. The extraordinary expense of producing the fossil fuels and connecting the reservoirs to the surface has already been taken. How much more could it cost to use that same facilities to start returning the spent carbon back down the same wells into the same reservoirs? Other
21
i^fitii Year :<csconi< Rnrcci (PX4B 4>34! re^^ •..• -^
yice vnuiLWoHjur hikMcu! OilRwuwry Literature Review and-'ur THtoiy
economic uses ofC02 exist, such as dry ice for shipping and bubbles in soda pop, but using it for EOR has a much, much larger potential, and we take the carbon out of the
environment for good.
.3 . =
'•>-
m EOR-Worldwide
Worldwide, over two million barrels of oil per day (bopd) are being produced from various EOR projects. In 1998, of199 active U.S. EOR projects producing atotal of 759,965 bopd, 66 projects were miscible C02 floods accounting for over 179,000 bopd ofproduction. U.S. EOR from steam injection accounted for 419,349 bopd ofproduction, while hydrocarbon gas injection accounted for 102,053 bopd. Almost all U.S. steam floods are located in California, because ofthe state's abundance ofshallow, "heavy" oil, and almost all U.S. C02 floods are inwest Texas, because there's a source ofC02 nearby
to flood the deep, "light" oil reservoirs. (The above numbers do not include
waterflooding, even though waterflooding an oil reservoir is common practice, many times as a pre-requisite to gas flooding, and accounts for significant enhanced oil production worldwide. Today, in California alone, active waterflood projects were injecting 2.2 million barrels ofwater per day adding about 140,000 bopd ofproduction.)
• EOR with C02
Basically, a miscible gas flood of an oil reservoir works because an injected gas becomes miscible, or becomes one liquid phase, with the oil, and helps the oil move through the rock reservoirs and up and out the wells. A gas (like C02) is continually
added to an oil reservoir by being compressed and pushed in, and when it is produced back out with the enhanced oil, it is recaptured and reinjected along with new gas, produced back out, added to new, re-injected, and so on, until as much enhanced oil has been produced as possible. MEI owns an interest in a mature C02 flood of an oil reservoir in west Texas, started in 1983, which now adds 10 million cubic feet per day (cfpd) of new C02 (piped in from New Mexico) to 30 million cfpd of C02 being recycled from the enhanced oil production. That's 40 million cubic feet of C02, weighing 2,000 tons, handled and re-handled, every day.22
l-iwi Year P^ccrch Pr^cci Op Pi $034} rh ..„ , ' ^ i-^'^Xor Mfaww on t^cvery UTcroture. Review ^d/or Theorv 2.2 EOR-Benefits
The issue of emission and sequestration of green house gas, especially C02, becomes much hot and attracts international society to pay attention. By utilizing C02
using EOR technique, we canobtain benefits such as:
• Monitoring C02 by converting awaste product into useful product.
• EOR is one ofthe promising options for C02 utilization. Thorough this option the
benefit bothto economic and environment canbe obtained
• One of C02 storage technique
• EOR can increased oil production
• Cost saving through efficient operation ofhigh C02 utilization.
• Development of in-house expertise and facilities with regard to C02 technologies
• Conformance to natural gas specification - avoidance of associate penalty
2.3 EOR - Economic Factors
The economic for a C02 - EOR project primarily depends on several factors and involves uncertainties in many aspects. Uncertainties in measuring reservoir characteristic and predicting reservoir behavior and the variations in the costs of drilling wells and the cost for the equipment can vary the cost up to US$25 per tonne ofC02. the major aspects to take into consideration while installed ofEOR system are:
• Reservoir condition
• Tax
• C02 separation process involves
• Rate of production
• Distance to the source
US National Petroleum Council 1981 estimated cost elements before taxes as
shown on the chart:
23
Vinai Year Re-wan-ft Frcicci iR(5B $034}
'4'( 'K2 Ulilnuuanfor tithfcwd (JifRvnwrv
13%
19%
10%
47%
LWeratur<? R<
Chapl vie1^1 meter "CSv;
0C02 purchase price
QC02 recyJeDpewtint.
expense
• well opcraaqg cost
•tangible mtustmcni
H tangible and intangible nHmg cn^is
Figure 10: Chart shown undiscounted cost element before taxes
In practice, the operating cost for an EOR project is 5% to 10% of the capital cost (assume 6% for the cost estimation). The cost that consider under Capital Cost are such
as:
• Feasibility study, project engineering and design
• C02 delivery / resale pipeline
• Producing well workovers and installation ofhigh capacity lift system
• New development well
• Injection distribution system
• Surface production facilities
• Water injection plant including filtration and treating
• C02 recompression plant including dehydration
And for operatingcost,the elementsthat consider under it are:
• Fixed annual field operating cost for surface production facilities & direct
overhead
• Fixed well operating cost
• Unit lifting, treating and handling cost to produce fluids
24
hhiai Yrer JPrccrch Preset tRi'B $034}
(4P 144aeuon fyr PnPaieyP(PiRi;a>ix7V
* Water treating and injection plant
• C02 recompression and dehydration plant
ChHpLC
The brake down can bfc summarize into these two categories:
Main controller con? ibutor 1. Compression
• to maintain C02 in the supercritical state during transport and injection, requires a minimum pressure of 82atm.
• Use IFP study onDulang asa basis.
Maximum 5 recompression units (1-
12bars, 15-40bars, 40-80bars & 160- 320bars) at the injector
• Assume 4% inflation rate 2. Pipeline
• Aftmction ofinternal diameter, pipe thickness, length and water depth.
• Determine pipeline diameter from the
flow rate
• Multiply by 2 to allow for corrosion 3. Injection well
• Use 3.5MMUSD/well drilling cost
• Assume 5-spot pattern (1-10 ratio)
• Assume 6% operating cost
25
Other cost distributor Equipping the injectors -
USD150000/well Surface facilities for injectors = USD55000/well Surface facilities for
producers =
USD25000/well
Work-over for producers =
USDIOOOOO/well
Vi
f j ft*
i o
atfO w 2
to «
£
inal YeifrRe-Si.'itrc(i Privet fJ'X'B $<>3a
iP tOcizanon jor ppincvdf 4! Raawrv Chapia".
L.'3t.:rs'iurv;' Review arsd'or Theo-r
2.4 EOR-Limitation
Economically successful EOR projects are difficult to predict because ultimately they are dependent on the vagueries of the geology miles below the earth's surface, and the price of oil, both of which are difficult to predict with certainty. Traditionally, the farther away from abundant, naturally occurring C02 in a relatively pure state, the less economic viability there was for a C02 flood. The west Texas C02 floods are near the C02 deposits produced in New Mexico, and that's why distant California has no active C02 floods. But that's changing as the energy industries wake up to the fact that their waste
C02 is a valuable resource for EOR.
The screening criteria that determine the suitability are based of the statistic on successful commercial IOR operation and were updated according to Table 10.
Table W: Screening Criteria forEOR
EOR Process Criteria C02 Miscible Immiscible CO?
Depth, m >600 >200
Temperature, °C >30 -
Oil Saturation, % >25 >50
Initial Pressure, kPa >MMP <MMM
Oil Density, kg/m3 <920 <980
Oil Viscosity, mPa.s L_ <10 <600
Gas Cap present No No
Bottom water present - No
Active water drive - No
26
b'inai Ye-ar RerennP Prated iPXYB $054}
(4P UtiUzanonfvr Pikmccdi4! Rvcuvwy
Chapicr M&.iuxioio;^y •' Prober WoY
Chapter3: METHODOLOGY/ PROJECI WORK
3.1 Data Gathering Process
The data was gathered and reviewed as shown in the systematicprocedure below:
Review given data and
information
Internet surfing & data gathering
Classify data
Summarize and compile
data and confirmation
27
Analyze data for C02 management purpose
viwi Year Rcwttrrfi Project 4:443 $044}
0H2 Pn/ua^onfor fiihmk'-td(Jit Ri'i'overv Meduxioiusv / PrijiKci" W^rk
3.2 Miscible/Immiscible Displacements Techniques
An injected.gas becomes miscible with oil when enough light hydrocarbons concentrate in the gas for the gas and liquid to become mutually soluble. IfNGL is not the injected gas, other gases such as carbon dioxide, flue gas or nitrogen can be used. All of these gases become miscible only when their density is high, generally greater than
0.5. Thus, they work best athigh pressure.
For carbon dioxide, the minimum pressure is 1,070 psig at 88 °F (31 °C), i.e., when C02 becomes supercritical and its gas and liquid are no longer separate phases. At those conditions, which are conveniently close to the pressure and temperature of many fields, carbon dioxide's density is high enough for itto be a good solvent for oils, which contain a significant volume of light hydrocarbons. As the temperature increases (C02 density decreases), or the API gravity decreases (light hydrocarbons decrease), the pressure needed to attain miscibility increases. So at 170 °F (75 °C), carbon dioxide develops miscibility at pressures greater than 2,500 psig.
Nitrogen on the other hand becomes an efficient miscible displacement only for light oils, temperatures greater than 240 °F (115 °C) and pressures greater than 5,000 psig, where its density is high enough to extract light-hydrocarbons from the oil. Flue-
gas works well at lower pressure and temperature, since it contains around 13% carbondioxide.
The following photographs illustrate a C02 miscible process for a selected reservoir. The experiments were conducted in an etched glass model at 105 °F (41 °C),
at pressures of 1,000, 1,500 and 2,500 psig. The models were viewed with a stereomicroscope sothat each millimeter in theoriginal photograph is 50 microns.28
:/wtl Year 2kmv. •// Priced <P( 'B $034}
543 VtiUwuwfor PePmceh (PiRecovery vtotKoddo^v / ProiecT Work.
Figure 11 - 1000psi - Immiscible CarbonDioxide
The gas and oilphases are separate- Oil spreads between gas and water - Gas can diffuse into pores and form a isolated Gas Bubble - This helps displace the oil.
Figure 12- 1,500 psi - Miscibility Begins to Develop
A clear Middle Phase forms and spreads between the oil and gas. The interfacial tensions are very low. Oil recovery will be high and the displacement will appearto be above the MinimumMiscibility Pressure (MMP).
29
I-iwf Oar ('02 Un'itz
RvK-umi! Project (5X4B $034i enact for PchnneedOil Recovers
Meth.odolui?,y: f'roicei Work
Figure 13 - 2,500 psig - C02 Has Developed Miscibility with the Oil
Well above the MMP - The miscible fluid is the very light fluid flowing in a channel past the darker bypassed oil. The miscible fluid is Extracting NGL from the
bypassed oil.
Figure 14- Lower Liquid Begins to Condense
After some time, the light hydrocarbons have been depleted from the bypassed oil
and the Lower Liquid (dark spots) begins to condense from the miscible fluid. The condensed phase appears to coat the wall ofthe model (wet),
As more lower liquid condenses from the miscible bank, the lower liquid phase coalesces into a continuous phase, Figure 15. The dark lower liquid phase (a heavy-oil
containing some C02) is miscible with the bypassed oil, but immiscible with the C02 rich gas phase. The dark lower liquid may wet surfaces because it was enriched in the30
Final Year Research Project (FOB5034) CG2 Utilization for Enhanced OH Recovery
Chapter 3 Methodology / Project Work
Figure 16:Miscible GasInjectionDiagram
The oil and the injected gas remain in two phases. The gas pushes the oil towards the producing well. Injection pressure < MMP. The purpose of immiscible gas injection is normally to maintain the reservoir pressure. Similar to the miscible gas injection of the gas onlyor alternated withwaterfor bettersweep efficiency.
IMMISCIBLE GAS INJECTION \'r
Injection well WMMIBMBBM Productions
Figure 17: Immiscible Gas Injection Diagram
32
CJiapter 4: RESULT AND DISCUSSION
4.1 Current Gas (C02) Production
Offshore gas is currently transported through five major pipelines, namely Lawit (LA), Jerneh (JE), Angsi (ANG), Resak Delivery System (RDS) and Joint Delivery System (JDS) to onshore terminals. (Appendix 1) Current Peninsular Gas Utilization (PGU) sales gas demand is 1.8Bscf/day with average growth of 6% per annum. Current natural gas
production is 2.3Bscf/day.
Sotong
Collector
Figure 18: Current Production Gas Network
33
J.a wit
Jerneh
Beranang
Guntontj D
Bekok C
Duyong
iemt Yer?r Re\c<trct7 Project (POP 5tP3l
*' •' <".,; VtUizuffvv for Ptthaace4 Of/ Re<. wcsr
Result &.w. Discussion
Gas receives at Onshore Slug Catcher (OSC) has been increasing at an average rate of 17%
per annum.
Table 5: Average Composition ofOSC (1997-2000)
Component jMol%
•[cr 185-36.
•| C2 ! 5.31
|C3
2.34j C4
1.31C5 0.33
C8+ 0.25
C02 4.90
H20 0.01
N2 0.20
Gas received by Onshore Gas Terminal (OGT) is predicted to peak in 2001 at rate of
1152MMscf/day.
Table 6: Average Composition ofOGT (1998-2005)
. Component Mol%
j CI 79.07
J C2
8.28:|C3 3.96
•"( C4 1.66
C5 0.26
C8+ 0.31
C02 5.77
[H2CT
0.01N2 0.66
Gas from offshore is currently collected at OSC and OGT before treatment at gas
processing plant (GPP). Current annual C02 production from GPPs' AGRUs is estimated
at 3.2 Mega tonne. PGU sales gas demand is projected to increase to more than 2Bscf/day by 2002. Current PGU gas demand is 1.8Bscf/day. Increasing demand will require development of high C02 content fields eventually. The initial forecast PGU sales gas
34
fetal 'rear Research Protect (Pi 'p, -iti ;.y;
3xmn anu Discussion
demand for year 2001 is 1.8Bscf/day, for year 2005 is 2.5 Bscf/day and for year 2010 is 3.5Bscf/day. After the life of fields has been extended, the revised forecast PGU sales gas demamd from GPP ,s lowered to 2.0Bscf/day. To sustain the gas demand, development of
new fields, inclusive of the high C02 gas fields would be necessary in tlfc future. The
provision for C02 capture faciUties also need to be considers such as the sparation,
utilization and storage, due to increasing C02 amount.
35
Final Year Research Project (ECP 5^331 402 Ptiikutiwinr liHhniicetJ \'hf Recerav
Result and Discus^ii
4.2 Current Reserves
Gas reserves can#e classified into three categories that are pre-development, production and development (\ppendix 2). Pre-Development Reserves are expected to be recovered from new wells on undrained portion ofthe reservoir or where arelatively large expenditure is required to recomplete an existing well or transportation facilities for or improved recovery projects. For Producing Reserves is refer to gas reserve that are currently producing. While Developed Reserves are defined as the estimated quantities of petroleum expected to be recovered from existing wells which including reserves behind pipe. Improved recovery reserves are considered developed only after the necessary
equipment has been installed or when the costs to do so are relatively minor.
PM-Rel. Gas Fields EPMI/PCSB Gas PSC - EPMI(NGPSA)- Gas Fields EPMI/PCSB Gas PSC-Oil
PCSB - Gas Fields
PM - Rel. Gas Fields (PM5)
PM302 PM3 - CM
PM - Rel. Oil Fields (PM5)
PCSB - Oil Fields
PM - Rel. Gas Fields (PM8)
PM Rel. Oil Fields PM2
PM - Rel. Oil Fields (PM8) EPM1 (NGPSA) - Oil Fields
PM307 PM306
ni'jjj/i.rj>jii.UiUiiim
*M4Uh|i«*Mfah>b«M
0 1000 2000 3000 4000 5000 6000 7000 8000
C02 reserves (Bscf)
Figure 19: C02 Reserve from Respective Oil and Gas Fields
36
Final Year Research Froject (FOB 5034) C()2 Utilizationjar Enhanced OH Recovery
Chapter 4
Result and Discussion
PM308
PM 307Is®2.8
EPMl^GPSA)-OfiRB(dS PM-RetC«nekls(pM3}
PM2
Ij&fcjMifJrfcSE3!3,5 0.5
J'l^l^^^^mM.y^^imi'Iim^
PM RetQ8Ftetts~ r^^^i^^}JiT^IV^^ifei324,1
PM- Ref,Sas Ftefcfe (PMS} 0.3 PC5B~OBFie*te
pm -Rel c^Ffeids (PM5>JsJffiffiBza 10.S
PM3-0M
PM3Q2tes£s£EEsSi13
PM - ReL.Gas.Reiite(PM^J®««S228S23^^ig.6
PCSB-G«sRe*Jfi BttaaBflOBSftM epwt.'pcssGasPsc-osRews" mm^m-hmftwrt 8,2
E^Mr(NGPSAj-(^smis" waaS.f
EPttypCSSGssPSC -ok Bete PM-Ref.i3asRs«s
S22SSE3l6.5 •
i«k*»vfe«fjBiK^»™&'SKA«al!(^^
T to
T
20 30
Mot%
40
Figure 20. Average C02Content for Bach Oil and Gas Fields
37
T 50
•«&i
60
Final Year Research Project (ECB 5034) Chapter 5 C02 Utilizationfor Enhanced Oil Recovery Conclusion and Recommendation
C02 is one of the major greenhouse gases emitted from developed countries ands
'Vs
it is increasing annually. Petronas production fields itself have contribute about3.2 Mega tonne of C02 emissions. It makes annual C02 emission in Malaysia nearly reached 100 Mega tonne, which is still small, compare to USA that emitted 1.5Gtc. Annual global C02 emission is 6.8 Giga tonne. The total amount of C02 in atmosphere is 790 Giga tonne carbon, and the total concentration is 360ppmv. The greenhouse gases absorb infrared radiation while letting sunlight though. This heat is there radiated bask towards the surface of earth causing climate warming. The significant impact on society, economics, and environment are raising sea level, wild weather, disruption of ecosystem, thinning ice and hotter time. The recent Kyoto Protocol to United Nation Framework Convention on Climate Change (UNCCC) would, if ratified, required developed nations to reduce their net carbon emissions in the period 2008-2012 by at least 5% of total emission level in 1990. At present, C02 is mainly used as a feedstock for the chemical production, as well as for enhanced oil recovery (EOR). Small quantity of C02 has traditionally been used for flood and biomedical applications.
The availability of natural sources in West Malaysia an reduction in the number of hydrocarbon reserves are some ofthe driving factors for utilization of C)2 in enhanced oil recovery. EOR is one of the promising options for C02 utilization. Through this option we will benefit both economically and environmentally. In worldwide, over 2 million bscf are being produce from various EOR project. Total gas reserve in West Malaysia is around 25,606Bscf and the total C02 reserves from those gases are around 9,812Bscf. It is recommended to start EOR with Tiong, Tapis or Guntong since they fall in the most potential group with high gain and low risk. The gas field could be the source of C02 for the EOR operation to sustain the gas demand; development of new fields, such as Inas/Sepat