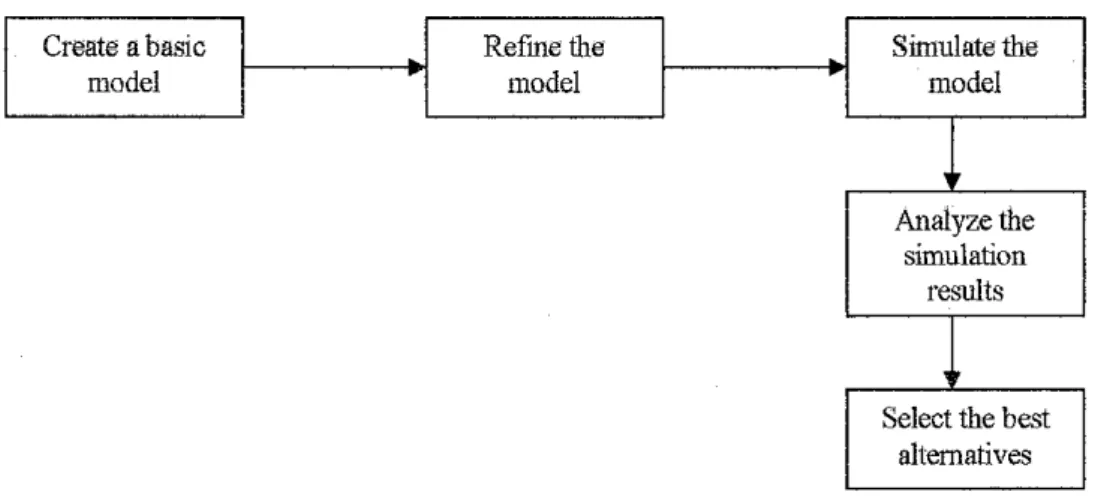
The aim of this project is to develop a manufacturing system based on a practical situation implemented on the ARENA software. The project topic is particularly applicable to most manufacturing companies as it involves typical flows and conditions. The main goal of this project is to improve the process with weaknesses and inefficiencies through continuous process improvement and process redesign.
Nordin bin Saad for his expert guidance, attention and suggestions, support and advice regarding the project and the difficulties encountered during the project implementation. Don't forget to mention that I would like to thank several engineers from a production company who sacrifice their time to help me get the necessary data from their company which is very important for the development of this project. In addition, I am grateful to Laboratory Technician Instrumentation and Control, Mr. Azhar bin Zainal Abidin, for his guidance, support and care during the project work.
Last but not least, my appreciation goes to the individuals or groups who have helped me in every possible way to complete the project. Above all, I would like to thank God for making this project possible this far.
Exported data and charts at Microsoft® Excel
Input Analyzer
The function is to place specific distribution functions in a data file to allow the user to compare distribution functions or show the effects of changes in parameters for the same distribution. The data files processed by the Input Analyzer usually represent the time intervals associated with a random process, captured in the current process [17]. Most of the distribution used for this project is Beta, Triangular, Weibull, Uniform, Normal, Gamma and Lognormal.
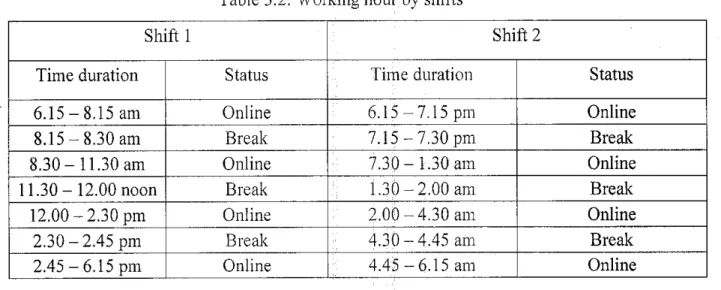
The term distribution is used later to express the possible intermediate arrival time or process time. As chosen for this simulation, the 'Capacity Time Pattern' determines whether or not a resource will be available over time. Below is the generated time pattern showing the total working hours for the day where the shift working hours are defined in the Shift 1 and Shift 2 files as shown in Figure 3.6.
Process Analyzer
In essence, this is also a presentation of one of many approaches to model validation by implementing simulation logic using actual process time collected from a real system (historical data). Instead of using a process time based on sampling from a probability distribution, a record of that time is inserted into a user form created using VBA.
Microsoft® Excel
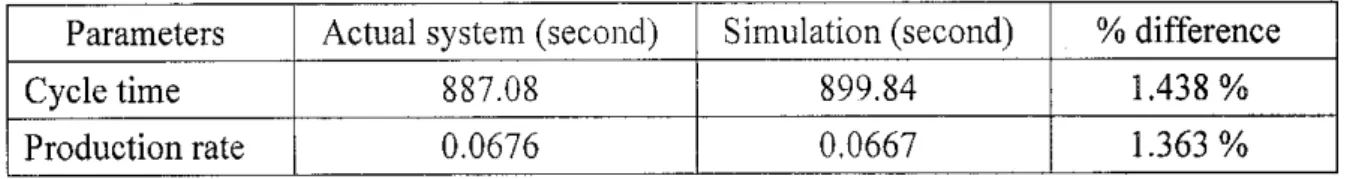
The first phase of the simulation focuses on getting the production rate and cycle time similar to the actual system. From Table 4.1 it can be concluded that the percentage difference between the actual system and the simulated model is relatively small and will produce small errors. From this data monitoring, the utilization value per completed process can be seen directly, where the percentage of utilization for the Install speaker, Screw speaker, Auto Geometry, Inspection, Packing and Direct Vanning processes is quite low.
One of the process times exceeds the clock time by an additional 10%, while the others are not balanced. The demand rate is not reached, so this line balancing method is one of the ways to. By observing and comparing the takt time with the process time, it can be seen that some improvements can be made:.
The output for this model is increased to 996 and can be seen through the animation in Appendix 5. From the observation on the line itself, it can be said that the problem is mainly caused by the increase in the setup time and the failure of the software to respond. After simulation, replacing four computers, the output of this model increases to 897 and can be seen through the animation in Appendix 6.
It can be observed that after line balancing the jobs are evenly distributed and under takt time with allowance (model 2). The results can be seen in Appendix 11 and also in the process analyzer parts, where it can be concluded that the combination of both activities increases the production output more. So with the improvements on this model, the duty time can be reduced to just 11 hours.
The simulation can be used in conjunction with these properties, since the processes are almost the same and different process time can be inserted in the user form generated by VBA. Excel and animation, while the entire report, which is in PDF version, can be viewed. The results verify the main focus of the simulation model, which is to vary the changeover time and production speed based on market demand, to reduce downtime losses and to do line balancing.
Silva, Ramos, Vilarinho, Using Simulation for Manufacturing Process Reengineering - A Practical Case Study, 2000 Winter Simulation Conference
Kang, Gue, Eaton, Cycle Time Reduction for Naval Aviation Depots, 1998
Estremadoyro, Farrington, Schroer, Swain, Simulation of Memory Chip using an Electronic Manufacturing Simulator, 1997 Winter Simulation Conference
Michael Quirk, Manufacturing, Teams and Improvement, the Human Art of Manufacturing, Prentice Hall, 1999
J.RSwishers ET AL, Computers & Operation Research 28 (2001)
Siti Aishah Fadilullah, 2006, Logbook, Student Industrial Internship Programme
Nurul Faezah Mohhid, 2006, Logbook, Student Industrial Internship Programme
SMALL
Kot Module Dim theModl2 Kot Module Dim theMod 13 Kot Module Dim theMod 14 Kot Module Dim theMod 15. Kot Module Dim theMod!6 Kot Module Dim theMod 17 Kot Module Dim theMod 18 Kot Module Dim theMod 19 Kot Module Dim theMod20 Kot Module Dim theMod21 Kot Module Dim theMod22 As Module Dim theMod23 As Module Dim theMod24 As Module Dim theMod25 As Module Dim theMod26 As Module Dim theMod27 As Module Dim theMod28 As Module Dim a As Long. Dim b As Long Dim c As Long Dim d As Long Dim e As Long Dim f As Long Dim g As Long Dim h As Long Dim i As Long Dim j As Long Dim k As Long Dim 1As Long Dim n As Long.
Dim o As Long Dim p As Long Dim q As Long Dim r As Long Dim s As Long Dim t As Long Dim u As Long Dim v As Long Dim w As Long Dim x As Long Dim y As Long Dim z As Long Dim aa As Long Dim ab As Long Dim ac As Long. Private Sub CommandButton l_Click() Dim m As Model 'Definer variabler brugt i DimsAsSIMAN' VBA-logikken. Private Sub CommandButton2_CHck() Dim m As Model 'Definer variabler brugt i Dim s As SIMAN -'VBA-logikken.
AOCResource.Utilization Convergence2Resource.Utilization inspectioniResource.Utilization Inspetfion2Resounee.Utilisation Inspection3Resounee.Utilization InstallRearCowerResource.Utilisation InsulationTestResource.Utilization VideoCheckResource.Ub'lisation TouchUp2Resource.Utilization TouchUp2Resource.Utilization.Utilization.Utilization.Utilization.Utilization.
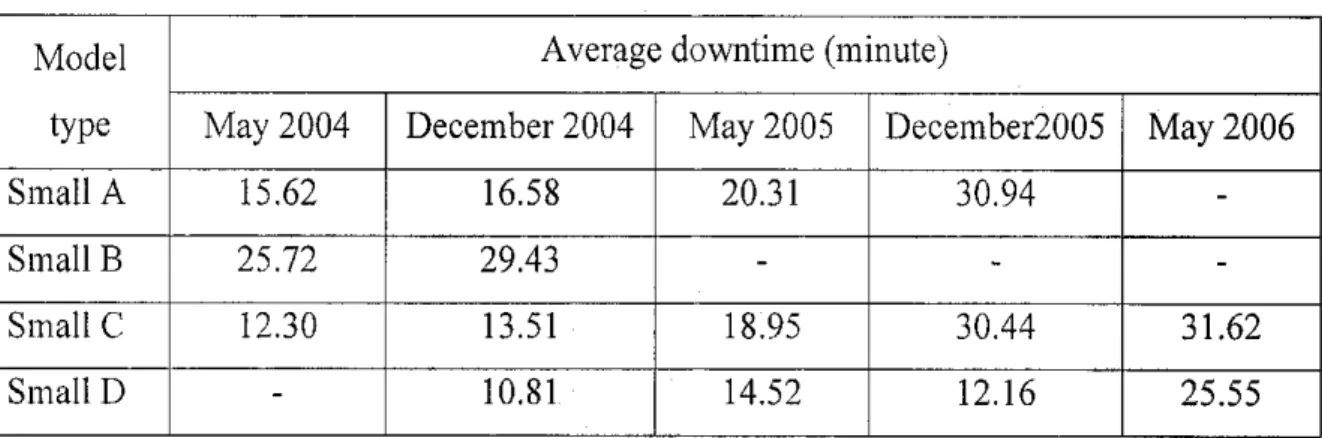
![Table 2.1: Common data of small model type of television [source: Siti Aishah Fadilullah, 2006, Logbook, StudentIndustrial Internship Programme]](https://thumb-ap.123doks.com/thumbv2/azpdforg/10247292.0/19.829.71.641.196.634/common-television-aishah-fadilullah-logbook-studentindustrial-internship-programme.webp)
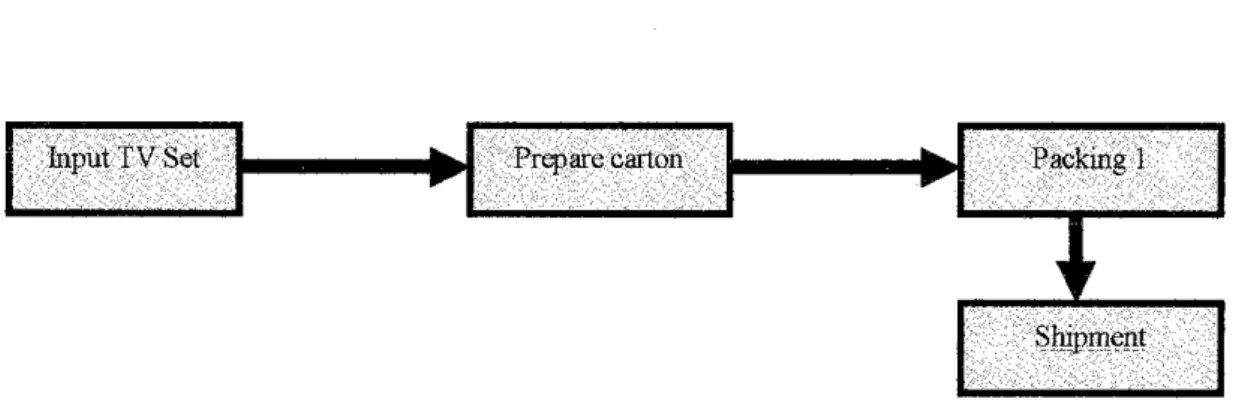
![Figure 2.4: Inspection process blocks [source: Siti Aishah Fadilullah, 2006, Logbook, Student Industrial Internship Programme].](https://thumb-ap.123doks.com/thumbv2/azpdforg/10247292.0/20.829.60.710.538.816/figure-inspection-fadilullah-logbook-student-industrial-internship-programme.webp)
![Figure 2.3: Adjustment process blocks [source: Siti Aishah Fadilullah, 2006, Logbook, Student Industrial Internship Programme].](https://thumb-ap.123doks.com/thumbv2/azpdforg/10247292.0/20.829.84.687.248.394/figure-adjustment-fadilullah-logbook-student-industrial-internship-programme.webp)