Western Pacific Surveillance and Response Journal
WPS R
Volume 14, Number 1, 2023, Pages 1–91
p-ISSN: 2094-7321 e-ISSN: 2094-7313 [email protected] l https://ojs.wpro.who.int/
IN THIS ISSUE IN THIS ISSUE
Original Research Original Research
Using an online calculator to describe excess mortality in the Philippines during the COVID-19 pandemic 1 JR Migriño, Jr and MR Bernardo-Lazaro
Regional Analysis Regional Analysis
Epidemiology of dengue reported in the World Health Organization Western Pacific Region, 2013–2019 12 E Togami, M Chiew, C Lowbridge, V Biaukula, L Bell, A Yajima, A Eshofonie, D Saulo, HTH Do, S Otsu, DT Cong, MS Ngon, CK Lee, R Tsuyuoka, L Tuseo, A Khalakdina, V Kab, RR Abeyasinghe, RP Yadav, P Esguerra, S Casey, CP Soo, M Fukusumi, T Matsui and B Olowokure
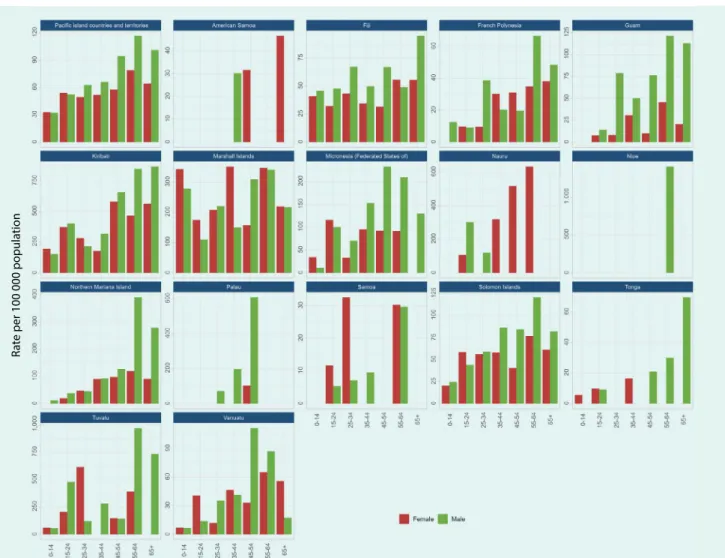
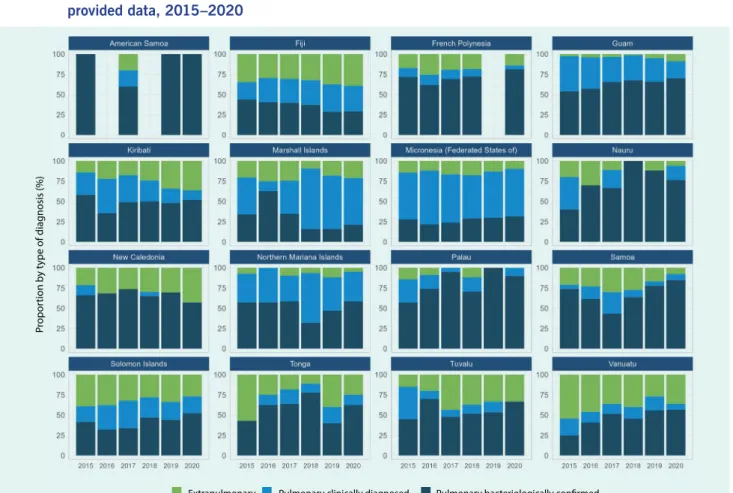
Epidemiology of tuberculosis in the Pacific island
countries and areas, 2000–2020 28
M Yanagawa, F Morishita, KH Oh, K Rahevar, TA Islam and S Yadav
Surveillance Report Surveillance Report
Epidemiology of tuberculosis in Mongolia: analysis of
surveillance data, 2015–2019 40
T Boldoo, L Otero, B Uranchimeg, A Purevdagva, T Enebish, O Erdenee, T Islam and F Morishita
Brief Report Brief Report
After-action reviews for emergency preparedness and response to infectious disease outbreaks 52 HL Quach, KC Nguyen and F Vogt
COVID-19: Field Investigation Report COVID-19: Field Investigation Report
A descriptive assessment of the National Institute of Public Health’s role in supporting the COVID-19
response in Cambodia, 2020–2021 60
S Chhim, WI Vong, K Pa, C Chhorn, T Housen, AE Parry, WV Damme, P Ir and C Chhea
COVID-19: Original Research COVID-19: Original Research
Post-COVID-19 health-care utilization: one year after the 2020 first wave in Brunei Darussalam 67 MS Abdullah, R Asli, PL Chong, BI Mani, NR Momin,
NA Rahman, CF Chong and VH Chong
How the Commonwealth of the Northern Mariana Islands stalled COVID-19 for 22 months and managed its first significant community transmission 76 D Davis, S Kern-Allely, L Muldoon, JM Tudela, J Tudela, R Raho, HS Pangelinan, H Palacios, J Tabaguel, A Hinson, G Lifoifoi, W Villagomez, JR Fauver, HL Cash, E Muña, ST Casey and AS Khan
Early pandemic use of face masks in Papua New Guinea
under a mask mandate 86
Western Pacific Surveillance and Response
WHO Western Pacific Surveillance and Response (WPSAR) is an open access journal dedicated to the surveillance of and response to public health events. The goal of the journal is to create a platform for timely information sharing within our region and globally to enhance surveillance and response activities. WPSAR is a publication managed by the World Health Organization Regional Office for the Western Pacific.
Rights and permissions © World Health Organization 2020. Some rights reserved.
p-ISSN: 2094-7321 e-ISSN: 2094-7313
The articles in this publication are published by the World Health Organization and contain contributions by individual authors. The articles are available under the Creative Commons Attribution 3.0 IGO license (CC BY 3.0 IGO http://
creativecommons.org/licenses/by/3.0/igo/legalcode), which permits unrestricted use, distribution and reproduction in any medium, provided the original work is properly cited. In any use of these articles, there should be no suggestion that WHO endorses any specific organization, products or services. The use of the WHO logo is not permitted.
Attribution: please cite the articles as follows: [Author names].
[Article title]. Western Pac Surveill Response J. [Year]; [Volume]
([Issue]). [doi number]. License: Creative Commons BY 3.0 IGO
The World Health Organization does not necessarily own each component of the content contained within these articles and does not therefore warrant that the use of any third-party-owned individual component or part contained in the articles will not infringe on the rights of those third parties. The risk of claims resulting from such infringement rests solely with you. If you wish to re-use a component of the articles attributed to a third party, it is your responsibility to determine whether permission is needed for that re-use and to obtain permission from the copyright owner. Examples of components can include, but are not limited to, tables, figures or images.
Any mediation relating to disputes arising under this license shall be conducted in accordance with the WIPO Mediation Rules (www.wipo.int/amc/en/mediation/rules). Any inquiries should be addressed to [email protected].
Disclaimer
The designations employed and the presentation of the information in this publication do not imply the expression of any opinion whatsoever on the part of the World Health Organization concerning the legal status of any country, territory, city or area or of its authorities, or concerning the delimitation of its frontiers or boundaries.
The mention of specific companies or of certain manufacturers' products does not imply that they are endorsed or recommended by the World Health Organization in preference to others of a similar nature that are not mentioned. Errors and omissions excepted, the names of proprietary products are distinguished by
EDITORIAL TEAM
Executive Editor
Babatunde Olowokure
Coordinating Editors
Ashley Arashiro Michelle McPherson
Editorial Assistants
Roxanne Andaya Don Rivada
Associate Editors
Rabindra Abeyasinghe • Leila Bell Sean Casey • May Chiew • Thilaka Chinnayah Anna Drexler • Roger Evans • Emma Jane Field Naoko Ishikawa • Jan-Erik Larsen • Chin-Kei Lee Ying-Ru Lo • Simone Moraes Raszl • Satoko Otsu
Amy Elizabeth Parry • Boris Pavlin Sharon Salmon • Mikiko Senga
To contact us:
Western Pacific Surveillance and Response World Health Organization
Office for the Western Pacific Region United Nations Avenue
1000 Manila, Philippines [email protected]
https://ojs.wpro.who.int/
T
he coronavirus disease (COVID-19) pandemic has been ongoing since March 2020 and, as of early January 2023, there have been more than 666 million reported cases and more than 6.7 million reported deaths globally.1 The numbers of daily or weekly COVID-19 cases and deaths have been used to assess the impact of the pandemic. However, while data on COVID-19-related deaths have been widely reported, the quality, accuracy and timeliness of mortality data can be influenced by country-specific factors such as COVID-19 testing capacity, population and per capita income,2,3 and are often under-reported or delayed especially in low-income countries.4,5 Therefore, reported COVID-19 mortality data may not reflect the full impact of the pandemic. An assessment by the World HealthOrganization (WHO) of 133 countries in 2020 found that almost 40% of the world’s deaths were not registered.6
One method to standardize estimates of COVID-19 deaths is through measurement of excess mortality, defined as “the increase of all-cause mortality over the mortality expected based on historic trends”.7 P-score is an associated index of excess mortality and represents the percentage of excess deaths relative to the expected deaths.8 In a 2020 study, excess mortality and P-scores were reported for most countries, particularly those in Central and South America,8 with global estimates of excess mortality for 2021 of 18.2 million people, more than three times the reported global COVID-19 deaths.7 Excess mortality and P-scores provide more realistic
a San Beda University College of Medicine, Manila, Philippines.
b Ateneo de Manila University School of Medicine and Public Health, Pasig, Philippines.
Published: 22 March 2023
Objective: Excess mortality is an indicator of the impact of the coronavirus disease (COVID-19) pandemic. This study aims to describe excess mortality in the Philippines from January 2020 to December 2021 using an online all-cause mortality and excess mortality calculator.
Methods: All-cause mortality datasets from 2015 to 2021 from the Philippine Statistics Authority were obtained and analysed using the World Health Organization Western Pacific Regional Office All-Cause Mortality Calculator. Expected mortality, excess mortality and P-scores were obtained using two models, 5-year averages and negative binomial regression, for total deaths and by administrative region.
Results: Reported national all-cause mortality exceeded the expected mortality in August 2020 and from January to November 2021, peaking in September 2021 at 104 per 100 000. Total excess mortality using negative binomial regression was -13 900 deaths in 2020 and 212 000 deaths in 2021, peaking in September 2021. P-scores were -2% in 2020 and 33% in 2021, again peaking in September 2021 at 114%. Reported COVID-19 deaths accounted for 20% of excess deaths in 2021. In 2020, consistently high P-scores were recorded in the National Capital Region from July to September and in the Bangsamoro Autonomous Region in Muslim Mindanao from June to July. In 2021, most regions recorded high P-scores from June to October.
Discussion: Tracking excess mortality using a robust, accessible and standardized online tool provided a comprehensive assessment of the direct and indirect impacts of the COVID-19 pandemic in the Philippines. Furthermore, analysis by administrative region highlighted the key regions disproportionately affected by the pandemic, information that may not have been fully captured from routine COVID-19 surveillance.
Using an online calculator to describe
excess mortality in the Philippines during the COVID-19 pandemic
Julius R Migriño, Jra,b and Ma Rosario Bernardo-Lazarob
Correspondence to Julius R Migriño, Jr (email: [email protected])
• Expected all-cause mortality and 95% prediction intervals using NBR. This statistic uses an NBR approach to estimate deaths for 2020 and 2021 using data from 2015 to 2019. This technique is preferred since it allows for overdispersion and can also account for low or zero counts. The mean parameter (𝜆𝑡) for the counts is modelled as
log𝜆𝑡 = 𝑐(𝑡) + 𝑡𝑟𝑒𝑛𝑑(𝑡) + 𝑋𝑡𝛽
where c(t) is the annual cycle in all-cause mortal- ity, modelled as a piecewise cyclic cubic spline function, trend(t) is the non-cyclic cubic spline function of all-cause mortality over time, and Xt is for arbitrary time-varying covariates.
• Excess mortality. Excess mortality was calculated using the formula
and values were calculated per region and per month for 2020 and 2021. Excess mortality counts were computed using both 5YA and NBR expected mortality.
• P-scores of excess mortality. P-score was calcu- lated using the formula
and is expressed as percentages. These values were calculated per region and per month for 2020 and 2021 and were also computed using both 5YA and NBR expected mortality.
Total excess mortality and P-scores were calculated using both 5YA and NBR expected mortality. However, only NBR was used to calculate excess mortality and P-scores per administrative region due to its increased accuracy and adoption by WHO.
Reported COVID-19 deaths per month for 2020 and 2021 were also extracted from the WHO coronavirus (COVID-19) dashboard.16 The ratio of COVID-19 deaths to excess deaths was calculated using the formula estimates of the true mortality during the COVID-19
pandemic, which includes estimates of underreported COVID-19 deaths as well as indirect deaths, that is, those from other diseases.8,9
The Philippines is an archipelagic lower middle- income country divided into 13 administrative regions (Map 1). Country data on mortality are available from both the Philippine Statistics Authority (PSA) and the Department of Health (DOH). The PSA data are obtained from death certificates, whereas the DOH data are obtained from mortality reports sent to the DOH Epide- miology Bureau.10 There have been several reports on excess mortality in the Philippines, with low and negative excess mortality reported compared to other countries in the region;7,11 one study also reported that the excess mortality rate in the Philippines was almost 3.5 times the recorded number of COVID-19 deaths.7
The World Health Organization Western Pacific Regional Office All-Cause Mortality Calculator (“ACM Calculator”) is an open-source online tool developed to calculate expected all-cause mortality, excess mortality and P-scores from mortality data. All-cause mortality can also be calculated by age, sex and administrative state or region if the disaggregated mortality data are indexed in the calculator. The results can then be displayed using tables and graphs. The ACM Calculator estimates excess mortality and P-scores using two approaches: historical 5-year averages (5YA) and a non-parametric negative binomial regression (NBR) model.12
The aim of this study is to describe excess mortality in the Philippines at national and regional levels during the COVID-19 pandemic (2020 and 2021) using data gener- ated by the ACM Calculator.
METHODS
Mortality data from publicly available PSA reports13 from 2015 to 2021 were obtained by year, month and region.
These data were encoded into a blank template provided by the ACM Calculator website and used to generate the following statistics in the Calculator.14,15
• Expected all-cause mortality and 95% confi- dence intervals using 5YA. This statistic takes the monthly average and 95% confidence intervals of the reported mortality using data from 2015 to
excess mortality = reported mortality - expected mortality
P-score = excess mortality x 100 expected mortality
ratio = COVID-19 deaths x 100 excess mortality
mortality in August 2020 and from January to November 2021, while mortality was lower than expected in March and April 2020 and in December 2021 (Fig. 1).
The total excess mortality using the NBR method for the Philippines was -13 900 deaths, or -13 deaths per 100 000 population for 2020, and 212 900 deaths or 193 deaths per 100 000 population for 2021. P-scores were -2% for 2020 and 33% for 2021 (Table 1). The highest excess mortality (56 per 100 000 population) and P-score (114%) were recorded in September 2021.
The calculated excess mortality was lower using NBR compared to 5YA across all time points (Table 1).
The ratio of reported COVID-19 deaths to calculated excess mortality was -66% in 2020 and 20% in 2021, All raw data on reported mortality as well as calcu-
lated statistics were tabulated. Time-series line graphs for reported mortality, expected mortality and P-scores were generated, and box plots for excess mortality were created. Data entry, cleaning and processing were com- pleted in Microsoft Excel.
RESULTS
In 2020, reported mortality in the Philippines peaked during August at 52 per 100 000 population, with the lowest mortality rate reported in April at 41 per 100 000.
In 2021, the peak occurred in September at 104 per 100 000, with the lowest rate observed for December at 44 per 100 000 (Fig. 1). The reported mortality for the Philippines exceeded the upper bound of the expected Map 1. Administrative map of the Philippines, 2019
BARMM: Bangsamoro Autonomous Region in Muslim Mindanao; CAR: Cordillera Administrative Region; NCR: National Capital Region.
Map revised from Dakilang Isagani - Own work.
Source: authors; map adapted from Felipe_Aira’s Municipal and city map of the Philippines (CC BY-SA 4.0. See: https://commons.wikimedia.org/w/index.
php?curid=81166427).
5YA: 5-year average; NBR: negative binomial regression.
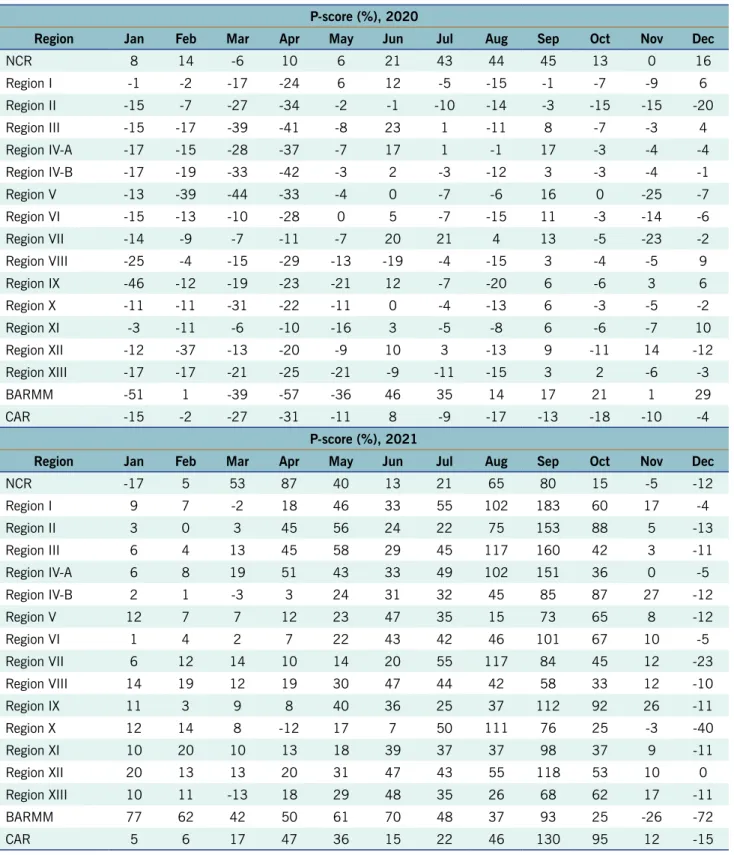
from June to October, while NCR had high P-scores from March to May and from August to September. BARMM consistently had high P-scores from January to Septem- ber 2021.
DISCUSSION
By using the ACM Calculator, we showed that the re- ported all-cause mortality in the Philippines exceeded expectations in July and August 2020, which coincided with the peak of the country’s second wave17 in August 2020. Most months in 2021 recorded a higher mortality rate than expected, which peaked in September. This coincided with the spread of the Delta variant across the Western Pacific Region and throughout the country.17
As there is a lack of published studies on excess mortality by region for the Philippines, we also calculated excess mortality and P-scores by administrative region.
Unlike the results for the Philippines overall, most regions had negative P-scores during July and August 2020. However, the high P-scores in NCR, Region VII and BARMM contributed significantly to the total all- cause mortality recorded during those months. BARMM and NCR recorded positive excess mortality and high P-scores consistently from the start of the pandemic despite having highly different local government struc- tures, population demographics, population density and the latter suggesting that reported COVID-19 deaths in
the country only accounted for about 20% of excess mortality in 2021. Monthly ratios ranged from -360%
in October to 142% in September of 2020 (interquartile range = 56%) and from -44% in December to 159% in November of 2021 (interquartile range = 15%) (Fig. 2).
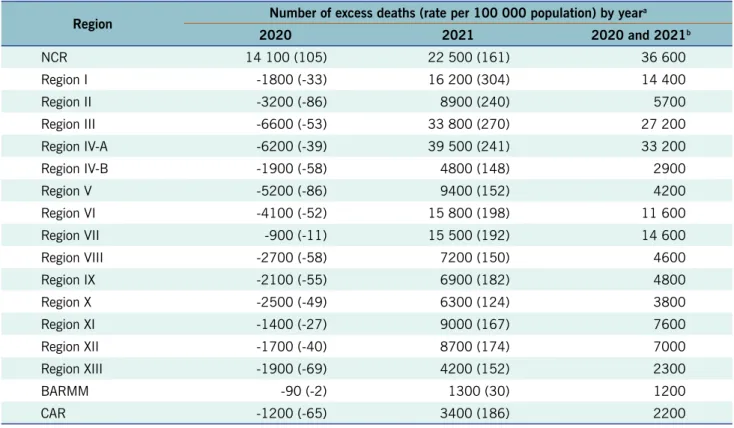
In the analysis by administrative region, only the National Capital Region (NCR) reported positive excess mortality of 14 100 deaths or 105 per 100 000 in 2020, while all administrative regions reported positive excess mortality in 2021 (Table 2). Overall, for both years, NCR had the highest excess mortality, with Region IV-A and Region III ranking second and third, respectively.
The regions with the highest excess mortality rates in 2021 were Regions I, III and IV-A, while Bangsamoro Autonomous Region in Muslim Mindanao (BARMM) had the lowest excess mortality (Table 2).
When assessing P-scores per region per month for 2020 and 2021 (Fig. 3; Table 3), the top three highest monthly P-scores occurred in September 2021 from Region I at 183%, Region III at 160% and Region II at 153%. Up until June 2020, most regions had negative P-scores, whereas in June 2020 only three regions had negative P-scores. NCR had high P-scores (that is, greater than the 75th percentile) from July to September 2020, while BARMM had high P-scores in June and
Fig. 1. Number of reported deaths and expected deaths calculated using the negative binomial regression and 5-year average methods, the Philippines, 2020 and 2021
0 10000 20000 30000 40000 50000 60000 70000 80000 90000 100000 110000 120000 130000
Jan Feb Mar Apr May Jun Jul Aug Sep Oct Nov Dec Jan Feb Mar Apr May Jun Jul Aug Sep Oct Nov Dec
Number of deaths
2020 2021
95% confidence interval (5YA) 95% confidence interval (NBR) recorded mortality expected mortality (5YA) expected mortality (NBR)
Table 1. Reported number of deaths and number, rate and P-score of excess deaths calculated using the negative binomial regression and 5-year average methods, the Philippines, 2020 and 2021
Year and month
Reported mortalityb Excess deaths using negative binomial regression
Excess deaths using 5-year average method Number (rate per
100 000 population) Number (rate per
100 000 population)b P-score (%)c Number (rate per
100 000 population)b P-score (%)c
2020 totala 613 900 (563) -13 900 (-13) -2% 27 200 (25) 5%
January 53 500 (49) -200 (0) 0% 1500 (1) 3%
February 46 300 (42) -3500 (-3) -7% 800 (1) 2%
March 46 000 (42) -6600 (-6) -12% -1900 (-2) -4%
April 44 800 (41) -5500 (-5) -11% -2500 (-2) -5%
May 50 300 (46) -1300 (-1) -3% 1100 (1) 2%
June 48 500 (44) -1500 (-1) -3% 2400 (2) 5%
July 54 400 (50) 2000 (2) 4% 5600 (5) 11%
August 56 800 (52) 3400 (3) 6% 6300 (6) 12%
September 54 000 (49) 1400 (1) 3% 4600 (4) 9%
October 54 200 (50) -500 (0) -1% 2900 (3) 6%
November 51 600 (47) -1200 (-1) -2% 2900 (3) 6%
December 53 700 (49) -400 (0) -1% 3700 (3) 7%
2021 totala 853 100 (774) 212 900 (193) 33% 266 400 (242) 45%
January 57 600 (52) 2700 (2) 5% 5600 (5) 11%
February 53 100 (48) 4000 (4) 8% 7700 (7) 17%
March 61 600 (56) 7900 (7) 15% 13 700 (12) 29%
April 67 900 (62) 16 500 (15) 32% 20 700 (19) 44%
May 71 400 (65) 18 600 (17) 35% 22 300 (20) 45%
June 66 900 (61) 15 900 (14) 31% 20 800 (19) 45%
July 75 200 (68) 21 600 (20) 40% 26 300 (24) 54%
August 95 700 (87) 41 100 (37) 75% 45 200 (41) 89%
September 115 000 (104) 61 200 (56) 114% 65 600 (60) 133%
October 82 400 (75) 26 500 (24) 47% 31 100 (28) 61%
November 57 400 (52) 3400 (3) 6% 8700 (8) 18%
December 48 900 (44) -6500 (-6) -12% -1100 (-1) -2%
a Cumulative counts of excess mortality per year may not reflect the sum of values shown due to rounding.
b Mortality counts 100 and above were rounded to the nearest 100; mortality counts below 100 were rounded to the nearest 10; rates were rounded to the nearest integer.
c P-scores were rounded to the nearest integer.
tive correlation (r = 0.92) between COVID-19 deaths and regional population density, as well as between the num- ber of intensive care unit beds and doctors absent due to being in quarantine (r = 0.92 and 0.85, respectively).20 Regions III and IV-A border NCR with many workers regularly travelling to NCR from these regions, suggesting labour mobility may have also played a role in excess deaths. However, the above-mentioned local study found low correlation between mobility and COVID-19 deaths.20 Aron et al. recommended supplementing region-based disaggregation analysis with analyses by age, sex and 2021, most regions recorded positive excess mortality
and P-scores for most months, and all contributed to the higher-than-expected national all-cause mortality rate reported in 2021. This provides further evidence of the country-wide spread of COVID-19 during 2021.
Overcrowding was identified as a factor affecting excess mortality in Chile.18 In this study, regions with the highest population density (that is, NCR, Region III and Region V-A)19 also had the highest total excess mortality from 2020 to 2021. A local study showed a strong posi-
Fig. 2. Reported COVID-19 deaths and number of excess deaths calculated using the negative binomial regression method,a the Philippines, 2020 and 2021
a Error bars represent the 95% prediction intervals.
Table 2. Number of excess deaths calculated using the negative binomial regression method by administrative region, the Philippines, 2020 and 2021
Region Number of excess deaths (rate per 100 000 population) by yeara
2020 2021 2020 and 2021b
NCR 14 100 (105) 22 500 (161) 36 600
Region I -1800 (-33) 16 200 (304) 14 400
Region II -3200 (-86) 8900 (240) 5700
Region III -6600 (-53) 33 800 (270) 27 200
Region IV-A -6200 (-39) 39 500 (241) 33 200
Region IV-B -1900 (-58) 4800 (148) 2900
Region V -5200 (-86) 9400 (152) 4200
Region VI -4100 (-52) 15 800 (198) 11 600
Region VII -900 (-11) 15 500 (192) 14 600
Region VIII -2700 (-58) 7200 (150) 4600
Region IX -2100 (-55) 6900 (182) 4800
Region X -2500 (-49) 6300 (124) 3800
Region XI -1400 (-27) 9000 (167) 7600
Region XII -1700 (-40) 8700 (174) 7000
Region XIII -1900 (-69) 4200 (152) 2300
BARMM -90 (-2) 1300 (30) 1200
CAR -1200 (-65) 3400 (186) 2200
BARMM: Bangsamoro Autonomous Region in Muslim Mindanao; CAR: Cordillera Administrative Region; NCR: National Capital Region.
a Mortality counts 100 and above were rounded to the nearest 100; mortality counts below 100 were rounded to the nearest 10; rates were rounded to the nearest integer.
b Totals of excess mortality for 2020 and 2021 may not reflect the sum of values shown due to rounding.
BARMM: Bangsamoro Autonomous Region in Muslim Mindanao; CAR: Cordillera Administrative Region; NCR: National Capital Region.
a P-scores were rounded to the nearest integer.
Fig. 3. P-scoresa calculated using the negative binomial regression method by administrative region and month, the Philippines, 2020 and 2021
and timing of testing and location of death. Early in the pandemic, data quality was recognized as a possible factor in underestimating COVID-19 deaths, especially in developing countries.3 In some states in the United States of America, increases in excess deaths cor- responded to increases in testing intensity.28 In Italy, COVID-19 mortality data did not include deaths at home or in care facilities where COVID-19 testing was not routinely carried out.27 The Philippines DOH released several advisories which acknowledged delays in report- ing of COVID-19 mortality data, citing logistical delays from local government units and health-care providers as well as technical issues with the information system as possible reasons for delayed reporting.29,30 Often considered the most reliable epidemic indicator interna- tionally, reporting of daily deaths may be unreliable and may peak at times that appear contradictory to patterns of confirmed cases.31
Indirect deaths caused by the pandemic also contribute to the excess mortality counts,11,32 but the exact proportion of indirect deaths is difficult to ascer- tain, varying by country, state or even locality. Based on our study, indirect deaths appear to be a significant contributor to excess mortality, possibly responsible for as much as 80% of the excess deaths in 2021. In one socioeconomic categories (such as inequality and urban
density) to reveal “the effectiveness of different types of policy”.21 Nonetheless, an analysis disaggregated by region could contribute to the assessment of the impact of the COVID-19 pandemic, particularly by identifying specific areas that are disproportionately affected.
While this study showed that the patterns of all- cause mortality and excess mortality were similar to reported COVID-19 deaths in the Philippines, these reported COVID-19 deaths only accounted for 20% of the excess mortality in 2021. A recent global study estimated this proportion at 29% for the Philippines from 2020 to 2021, compared to around 85% in high-income coun- tries such as Belgium and Sweden.9 The Commission on Population and Development in the Philippines also acknowledged that COVID-19 was a major contributor to excess mortality in 2021.22 Discrepancies in excess deaths versus reported COVID-19 deaths suggest that there may be: (1) underreporting of actual COVID-19 deaths; (2) a large cohort of deaths indirectly caused by the pandemic that are not COVID-19 deaths; or (3) a combination of both.23–27
Delays in reporting contribute to underreporting of COVID-19 deaths, as can the varying quality, intensity
Table 3. P-scoresa calculated using the negative binomial regression method by administrative region and month, the Philippines, 2020 and 2021
P-score (%), 2020
Region Jan Feb Mar Apr May Jun Jul Aug Sep Oct Nov Dec
NCR 8 14 -6 10 6 21 43 44 45 13 0 16
Region I -1 -2 -17 -24 6 12 -5 -15 -1 -7 -9 6
Region II -15 -7 -27 -34 -2 -1 -10 -14 -3 -15 -15 -20
Region III -15 -17 -39 -41 -8 23 1 -11 8 -7 -3 4
Region IV-A -17 -15 -28 -37 -7 17 1 -1 17 -3 -4 -4
Region IV-B -17 -19 -33 -42 -3 2 -3 -12 3 -3 -4 -1
Region V -13 -39 -44 -33 -4 0 -7 -6 16 0 -25 -7
Region VI -15 -13 -10 -28 0 5 -7 -15 11 -3 -14 -6
Region VII -14 -9 -7 -11 -7 20 21 4 13 -5 -23 -2
Region VIII -25 -4 -15 -29 -13 -19 -4 -15 3 -4 -5 9
Region IX -46 -12 -19 -23 -21 12 -7 -20 6 -6 3 6
Region X -11 -11 -31 -22 -11 0 -4 -13 6 -3 -5 -2
Region XI -3 -11 -6 -10 -16 3 -5 -8 6 -6 -7 10
Region XII -12 -37 -13 -20 -9 10 3 -13 9 -11 14 -12
Region XIII -17 -17 -21 -25 -21 -9 -11 -15 3 2 -6 -3
BARMM -51 1 -39 -57 -36 46 35 14 17 21 1 29
CAR -15 -2 -27 -31 -11 8 -9 -17 -13 -18 -10 -4
P-score (%), 2021
Region Jan Feb Mar Apr May Jun Jul Aug Sep Oct Nov Dec
NCR -17 5 53 87 40 13 21 65 80 15 -5 -12
Region I 9 7 -2 18 46 33 55 102 183 60 17 -4
Region II 3 0 3 45 56 24 22 75 153 88 5 -13
Region III 6 4 13 45 58 29 45 117 160 42 3 -11
Region IV-A 6 8 19 51 43 33 49 102 151 36 0 -5
Region IV-B 2 1 -3 3 24 31 32 45 85 87 27 -12
Region V 12 7 7 12 23 47 35 15 73 65 8 -12
Region VI 1 4 2 7 22 43 42 46 101 67 10 -5
Region VII 6 12 14 10 14 20 55 117 84 45 12 -23
Region VIII 14 19 12 19 30 47 44 42 58 33 12 -10
Region IX 11 3 9 8 40 36 25 37 112 92 26 -11
Region X 12 14 8 -12 17 7 50 111 76 25 -3 -40
Region XI 10 20 10 13 18 39 37 37 98 37 9 -11
Region XII 20 13 13 20 31 47 43 55 118 53 10 0
Region XIII 10 11 -13 18 29 48 35 26 68 62 17 -11
BARMM 77 62 42 50 61 70 48 37 93 25 -26 -72
CAR 5 6 17 47 36 15 22 46 130 95 12 -15
BARMM: Bangsamoro Autonomous Region in Muslim Mindanao; CAR: Cordillera Administrative Region; NCR: National Capital Region.
a P-scores were rounded to the nearest integer.
There were several limitations to this study. Mortal- ity reporting systems do not cover all deaths, especially in low-resource settings, with civil registration of deaths noted to be as low as 20% in some low- and middle- income countries.1 Additionally, mortality data are often preliminary which suggests that the earlier data may be more incomplete.7 The ACM Calculator assumes that reported counts are the actual values and that reports are complete and accurate, but it does not currently account for reporting delays. This may explain the overestimation of our data compared to studies from older datasets.
Therefore, the results of the ACM Calculator should be interpreted with caution, particularly when there are timeliness issues and reporting delays.12,14 Second, our dataset did not contain disaggregated data on age, sex and other factors associated with excess mortality, which limited our analysis to administrative regions. Lastly, we were not able to account for regional variations in test- ing and reporting accuracy and capacity that may have influenced the dataset.
Analysing excess mortality provided a more compre- hensive picture of the direct and indirect impacts of the COVID-19 pandemic in the Philippines. While the pattern of excess mortality was similar to reported COVID-19 deaths, the reported COVID-19 deaths only accounted for a small proportion of excess deaths. We therefore recommend incorporating excess mortality analysis during surveillance of similar events such as outbreaks and pandemics. Our analysis by administrative region highlighted the key regions disproportionately affected by the pandemic, which is information that may not have been fully captured from national COVID-19 surveillance.
We recommend that excess mortality be calculated using age- and sex-disaggregated data, as well as other stud- ies on the indirect factors that may contribute to excess mortality. Standardizing the methods of analysing and reporting excess mortality would assist in contextualizing information from different sources. We also recommend the use of open-source tools such as the ACM Calculator to monitor excess mortality especially in low-resource countries, as these tools can provide standardized and timely information that may help decision-makers to optimize the use of health resources and subsequently contribute to the achievement of Sustainable Develop- ment Goals in strengthening the capacity of developing countries for early warning, risk reduction and manage- ment of national and global health risks.
study in the United States of America, drug overdoses, homicides, suicides and unintentional injuries may have contributed to non-COVID-19 excess deaths in 2020,25 while a study in Latvia documented varying noncommu- nicable diseases contributing to excess mortality, such as circulatory diseases, neoplasms, diabetes mellitus and chronic lower respiratory diseases.33 Data from the Philippines on non-COVID-19 causes of death in 2021 compared to 2020 showed increases in deaths due to ischaemic heart disease (30%), cerebrovascular disease (15%), diabetes mellitus (21%), hypertensive disease (32%) and malnutrition (47%).22 Cancer-related deaths decreased by 10%, but this was partly attributed to
“COVID[-19] cases [crowding] out actual and undiag- nosed cancer patients”.22
Excess mortality is often calculated using two general models: historical (for example, 5-year) averages and NBR. NBR models can be used for data with low or zero counts, and can account for overdispersion, seasonal fluctuations within a given year, secular trends in data, re- porting delays and other time-sensitive covariates, such as internal and external movement of populations or periods with low reporting activities (for example, holidays).7,12,14 Although we used both models to calculate total excess mortality, our analysis focused on the NBR model for two reasons: (1) the accuracy of the NBR model in the ACM Calculator was validated in its documentation;14 and (2) WHO recently released a document detailing the use of regression models in estimating excess mortality data.15
The cumulative 2020–2021 excess mortal- ity estimates from our study using the NBR estimate (199 000) was closer to the estimate (184 000) from a 2022 global study9 from the same time period which used Poisson modelling and a recent WHO-modelled estimate (185 300) as reported in May 2022.24 Our result using the 5YA model (293 600) was closer to the projected excess deaths (254 897) from a local presentation which also used historical averages and mid-2021 data.32 Vari- ations in study findings are often influenced by the com- pleteness and reliability of the all-cause mortality data used as well as backward revisions of preliminary data.7 Although the trend of excess deaths from both methods used in this study were consistent, the total number of excess deaths differed, suggesting that analysis of excess mortality data should take into account the method used to calculate the excess deaths.
8. Kapitsinis N. The underlying factors of excess mortality in 2020: a cross-country analysis of pre-pandemic healthcare conditions and strategies to cope with Covid-19. BMC Health Serv Res. 2021;21(1):1197. doi:10.1186/s12913-021-07169-7 pmid:34736434
9. Wang H, Paulson KR, Pease SA, Watson S, Comfort H, Zheng P, et al. Estimating excess mortality due to the COVID-19 pandemic:
a systematic analysis of COVID-19-related mortality, 2020–21.
Lancet. 2022;399(10334):1513–36. doi:10.1016/S0140- 6736(21)02796-3 pmid:35279232
10. Mapa DS. Causes of deaths in the Philippines (preliminary):
January to October 2021. Quezon City: Philippine Statistics Authority; 2022. Available from: https://psa.gov.ph/vital-statistics/
id/165640%5d**, accessed 26 February 2022.
11. Del Castillo FA. Negative COVID-19 excess mortality in the Philippines: outcome of public health measure or product of incomplete data? J Public Health (Oxf). 2022;44(2):e291–2.
doi:10.1093/pubmed/fdab203 pmid:34109401
12. Duan M, Handcock MS, Blackburn B, Kee F, Biaukula V, Matsui T, et al. Tool for tracking all-cause mortality and estimating excess mortality to support the COVID-19 pandemic response: all-cause mortality calculator for COVID-19 response. Western Pac Surveill Response J. 2022;13(2):1–7. doi:10.5365/wpsar.2022.13.2.921 pmid:36276174
13. Vital statistics: reports. Quezon City: Philippine Statistics Authority;
2022. Available from: https://psa.gov.ph/vital-statistics, accessed 15 November 2022.
14. Methodology used in “tracking all cause of death and estimating excess mortality during the COVID-19 pandemic: statistical and computational tools”. Los Angeles (CA): University of California Department of Statistics; 2021. Available from: https://github.
com/handcock/WPROACM/wiki/files/WPROACM_Methodology.
pdf, accessed 23 February 2022.
15. Methods for estimating the excess mortality associated with the COVID-19 pandemic. Geneva: World Health Organization;
2022. Available from: https://www.who.int/publications/m/item/
methods-for-estimating-the-excess-mortality-associatedwith-the- covid-19-pandemic, accessed 17 October 2022.
16. WHO coronavirus (COVID-19) dashboard. Geneva: World Health Organization; 2020. Available from: https://covid19.who.int, accessed 3 November 2020.
17. Toole M. The Philippines passes the 2 million mark as COVID-19 cases surge in Southeast Asia. The Conversation; 2021. Available from: http://theconversation.com/the-philippines-passes-the-2- million-mark-as-covid-19-cases-surge-in-southeast-asia-167186, accessed 9 July 2022.
18. Alfaro T, Martinez-Folgar K, Vives A, Bilal U. Excess mortality during the COVID-19 pandemic in cities of Chile: magnitude, inequalities, and urban determinants. J Urban Health. 2022;99(5):922–35.
doi:10.1007/s11524-022-00658-y pmid:35688966
19. Mapa DS. Highlights of the population density of the Philippines 2020 census of population and housing (2020 CPH). Quezon City:
Philippine Statistics Authority; 2021. Available from: https://psa.gov.
ph/content/highlights-population-density-philippines-2020-census- population-and-housing-2020-cph, accessed 13 July 2022.
20. Talabis DAS, Babierra AL, Buhat CA, Lutero DS, Quindala KM 3rd, Rabajante JF. Local government responses for COVID-19 management in the Philippines. BMC Public Health. 2021;21(1):1711. doi:10.1186/s12889-021-11746-0 pmid:34544423
Acknowledgements
The authors would like to thank colleagues for their creative and operational support. This research was sup- ported by the San Beda University College of Medicine and the Ateneo School of Medicine and Public Health.
Conflicts of interest
The authors have no conflicts of interest to declare.
Ethics statement
The study was reviewed and approved on 1 July 2022 by the Ateneo School of Medicine and Public Health Research Ethics Committee under the study protocol ID:
SMPH Mortality 2022.
Funding
A partial operational grant for the study was provided by the San Beda University Office of Research and Innova- tion.
References
1. COVID-19 coronavirus pandemic. Worldometer [online database]; 2020. Available from: https://www.worldometers.info/
coronavirus/, accessed 5 January 2023.
2. Bayati M. Why is COVID-19 more concentrated in countries with high economic status? Iran J Public Health. 2021;50(9):1926–9.
doi:10.18502/ijph.v50i9.7081 pmid:34722396
3. Schellekens P, Sourrouille DM. COVID-19 mortality in rich and poor countries: a tale of two pandemics? Washington (DC): World Bank; 2020. Available from: https://openknowledge.worldbank.
org/handle/10986/33844, accessed 26 February 2022.
4. Li R, Pei S, Chen B, Song Y, Zhang T, Yang W, et al. Substantial undocumented infection facilitates the rapid dissemination of novel coronavirus (SARS-CoV-2). Science. 2020;368(6490):489–93.
doi:10.1126/science.abb3221 pmid:32179701
5. Lau H, Khosrawipour T, Kocbach P, Ichii H, Bania J, Khosrawipour V. Evaluating the massive underreporting and undertesting of COVID-19 cases in multiple global epicenters. Pulmonology.
2021;27(2):110–5. doi:10.1016/j.pulmoe.2020.05.015 pmid:32540223
6. SCORE for health data technical package: global report on health data systems and capacity, 2020. Geneva: World Health Organization; 2021. Available from: https://apps.who.int/iris/
handle/10665/339125, accessed 26 February 2022.
7. Karlinsky A, Kobak D. Tracking excess mortality across countries during the COVID-19 pandemic with the World Mortality Dataset. eLife. 2021;10:e69336. doi:10.7554/eLife.69336 pmid:34190045
28. Weinberger DM, Chen J, Cohen T, Crawford FW, Mostashari F, Olson D, et al. Estimation of excess deaths associated with the COVID-19 pandemic in the United States, March to May 2020.
JAMA Intern Med. 2020;180(10):1336–44. doi:10.1001/
jamainternmed.2020.3391 pmid:32609310
29. Statement on concerns re data management and reporting.
Manila: Philippine Department of Health; n.d. Available from:
https://doh.gov.ph/press-release/STATEMENT-ON-CONCERNS- RE-DATA-MANAGEMENT-AND-REPORTING, accessed 18 October 2022.
30. DOH addresses information system failure to reflect accurate numbers. Manila: Philippine Department of Health; 2021.
Available from: https://doh.gov.ph/doh-press-release/DOH- ADDRESSES-INFORMATION-SYSTEM-FAILURE-TO-REFLECT- ACCURATE-NUMBERS, accessed 17 October 2022.
31. Caldwell JM, de Lara-Tuprio E, Teng TR, Estuar MRJE, Sarmiento RFR, Abayawardana M, et al. Understanding COVID-19 dynamics and the effects of interventions in the Philippines: a mathematical modelling study. Lancet Reg Health West Pac. 2021;14:100211.
doi:10.1016/j.lanwpc.2021.100211 pmid:34308400
32. Briones KJS, del Mundo MDC. Excess deaths associated with the COVID-19 pandemic in the Philippines. Quezon City: Philippine Statistics Authority; n.d. Available from: https://psa.gov.ph/sites/
default/files/Session%2010.2_Michael%20Dominic%20C.%20 del%20Mundo_CRVS%20Paper%2C%20Academe%20-%20 Study%20on%20Excess%20Mortality%20and%20Projections.
pdf, accessed 29 November 2022.
33. Gobina I, Avotinš A, Kojalo U, Strēle I, Pildava S, Villeruša A, et al.
Excess mortality associated with the COVID-19 pandemic in Latvia:
a population-level analysis of all-cause and noncommunicable disease deaths in 2020. BMC Public Health. 2022;22(1):1109.
doi:10.1186/s12889-022-13491-4 pmid:35659648 21. Aron J, Muellbauer J, Giattino C, Ritchie H. A pandemic primer on
excess mortality statistics and their comparability across countries.
Our World in Data; 2020. Available from: https://ourworldindata.
org/covid-excess-mortality, accessed 6 August 2022.
22. POPCOM: 2021 ‘deadliest’ in PHL history with 879K lives lost as
‘Covid’ accounts for 146K deaths in 2.5 years. National Capital Region: Commission on Population and Development; 2022.
Available from: https://ncr.popcom.gov.ph/2022/09/09/popcom- 2021-deadliest-in-phl-history-with-879k-lives-lost-as-covid- accounts-for-146k-deaths-in-2-5-years%EF%BF%BC/, accessed 18 October 2022.
23. The true death toll of COVID-19: estimating global excess mortality.
Geneva: World Health Organization; 2022. Available from: https://
www.who.int/data/stories/the-true-death-toll-of-covid-19-estimating- global-excess-mortality, accessed 23 February 2022.
24. Global excess deaths associated with COVID-19 (modelled estimates). Geneva: World Health Organization; 2022. Available from: https://www.who.int/data/sets/global-excess-deaths- associated-with-covid-19-modelled-estimates, accessed 17 October 2022.
25. Fairman KA, Goodlet KJ, Rucker JD, Zawadzki RS. Unexplained mortality during the US COVID-19 pandemic: retrospective analysis of death certificate data and critical assessment of excess death calculations. BMJ Open. 2021;11(11):e050361.
doi:10.1136/bmjopen-2021-050361 pmid:34785551
26. Excess deaths associated with COVID-19. Atlanta (GA): Centers for Disease Control and Prevention; 2022. Available from:
https://www.cdc.gov/nchs/nvss/vsrr/covid19/excess_deaths.htm, accessed 23 February 2022.
27. Rizzo M, Foresti L, Montano N. Comparison of reported deaths from COVID-19 and increase in total mortality in Italy. JAMA Intern Med.
2020;180(9):1250–2. doi:10.1001/jamainternmed.2020.2543 pmid:32702088
T
he global burden of dengue, an emerging and re- emerging mosquito-borne disease, increased from 2000 to 2019.1 An estimated 70% of dengue virus infections are thought to occur in Asia.2 It has previously been reported that in the World Health Organization’s (WHO’s) Western Pacific Region, the number of dengue cases increased from approximately 200 000 in 2008 to more than 450 000 in 2015.3 During this period, several countries and areas in the Region experienced large-scale outbreaks.4–6Dengue is a public health threat because it is as- sociated with large outbreaks in communities, severe disease and mortality.1 Host immunity factors, such as serotype interaction, antibody-dependent enhancement and cross-immunity, complicate the clinical course, which leads to challenges in managing severe cases.1,7 Additionally, socioeconomic and environmental factors,
including climate change, drive disease transmission and complicate prevention and control activities.
In response to these challenges, a revised Western Pacific Regional Action Plan for Dengue Prevention and Control was developed and endorsed at the 67th meet- ing of the Regional Committee for the Western Pacific in October 2016.3 The Plan has guided countries and areas in the Region on improving the laboratory diagnosis of dengue, and the clinical management, surveillance and sustainable vector management for the disease to reduce morbidity and mortality, and decrease impacts on health systems.
Sharing information and data about dengue helps countries and areas better understand transmission patterns and supports the implementation of dengue prevention and control measures.2 As a continuation of
a Health Emergencies Programme, World Health Organization Regional Office for the Western Pacific, Manila, the Philippines.
b World Health Organization Representative Office for Lao People’s Democratic Republic, Vientiane, Lao People’s Democratic Republic.
c Division of Programmes for Disease Control, World Health Organization Regional Office for the Western Pacific, Manila, the Philippines.
d World Health Organization Representative Office for Viet Nam, Hanoi, Viet Nam.
e World Health Organization Representative Office for China, Beijing, China.
f World Health Organization Representative Office for Cambodia, Phnom Penh, Cambodia.
g World Health Organization Representative Office for the Philippines, Manila, the Philippines.
h Division of Pacific Technical Support, World Health Organization, Suva, Fiji.
i World Health Organization Representative Office for Malaysia, Cyberjaya, Malaysia.
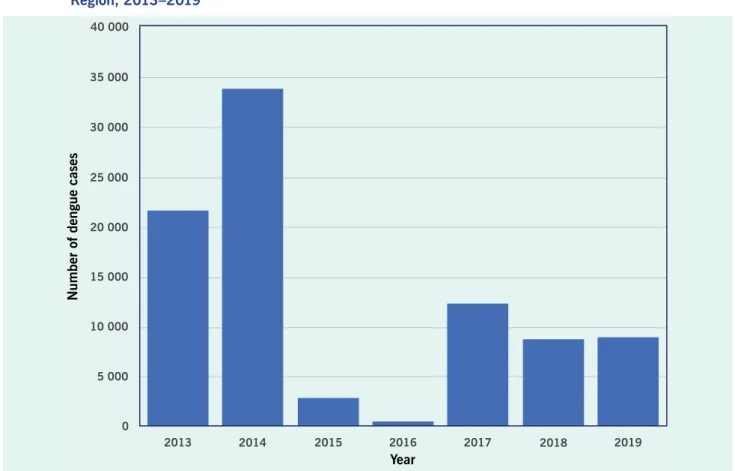
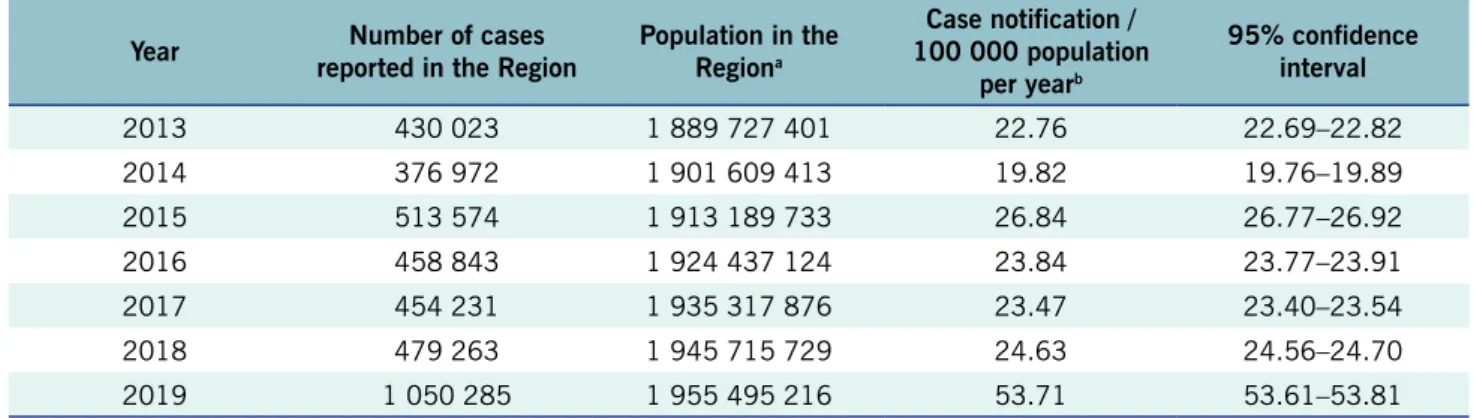
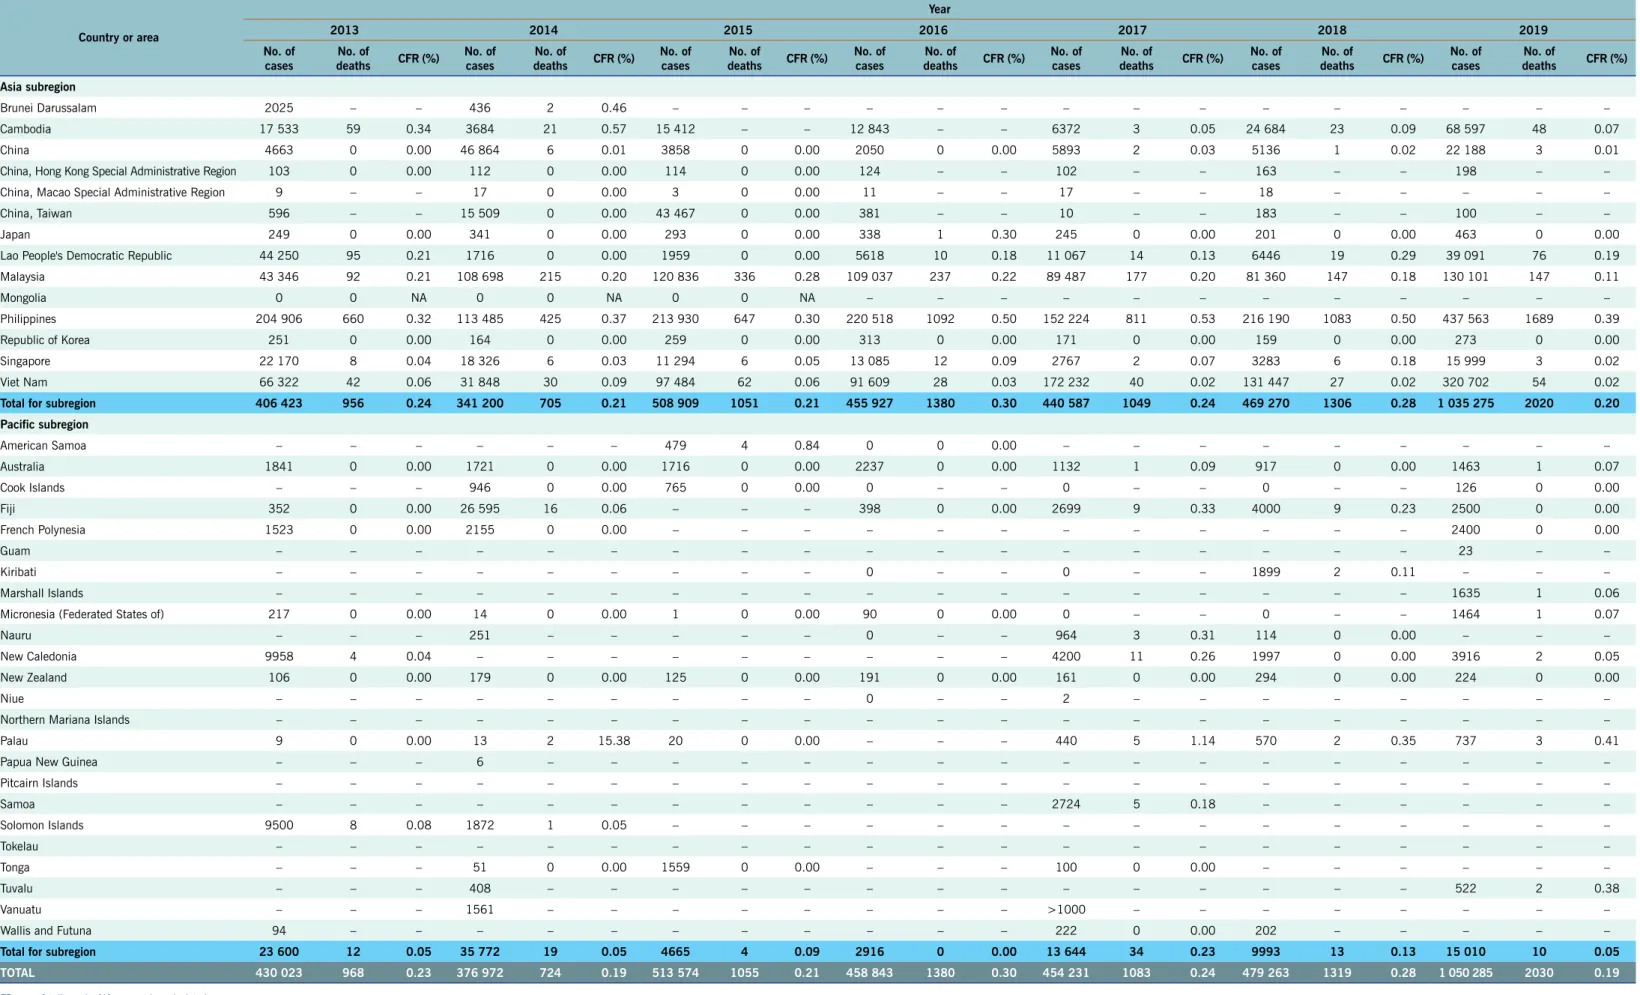
The global burden of dengue, an emerging and re-emerging mosquito-borne disease, increased during the 20-year period ending in 2019, with approximately 70% of cases estimated to have been in Asia. This report describes the epidemiology of dengue in the World Health Organization’s Western Pacific Region during 2013–2019 using regional surveillance data reported from indicator-based surveillance systems from countries and areas in the Region, supplemented by publicly available dengue outbreak situation reports. The total reported annual number of dengue cases in the Region increased from 430 023 in 2013 to 1 050 285 in 2019, surpassing 1 million cases for the first time in 2019. The reported case-fatality ratio ranged from 0.19% (724/376 972 in 2014 and 2030/1 050 285 in 2019) to 0.30% (1380/458 843 in 2016).
The introduction or reintroduction of serotypes to specific areas caused several outbreaks and rare occurrences of local transmission in places where dengue was not previously reported. This report reinforces the increased importance of dengue surveillance systems in monitoring dengue across the Region.
Epidemiology of dengue reported in the
World Health Organization’s Western Pacific Region, 2013–2019
Eri Togami,a May Chiew,b Christopher Lowbridge,a Viema Biaukula,a Leila Bell,a Aya Yajima,c Anthony Eshofonie,a Dina Saulo,a Do Thi Hong Hien,d Satoko Otsu,d Tran Cong Dai,d Mya Sapal Ngon,d Chin-Kei Lee,e Reiko Tsuyuoka,b Luciano Tuseo,f Asheena Khalakdina,f Vannda Kab,f Rabindra Romauld Abeyasinghe,g Rajendra Prasad Yadav,g Princess Esguerra,g Sean Casey,h Chun Paul Soo,i Munehisa Fukusumi,a Tamano Matsuia and Babatunde Olowokurea
Correspondence to Babatunde Olowokure (email: [email protected])