BANTAS, FEBEE B. MAY 2008. Agronomic Characters of Open-Pollinated Sweetpotato (Ipomoea batatas L.) Genotypes in Poblacion, Kibungan, Benguet. Benguet State University, La Trinidad, Benguet.
Adviser: Belinda A. Tad-awan, Ph. D.
ABSTRACT
Eight sweet potato genotypes were characterized and evaluated to determine their agronomic characters and to determine the sweetpotato genotypes adapted in Poblacion, Kibungan, Benguet.
The eight sweetpotato genotypes varied on their leaf, stem and storage root characters. Results showed that on the plant survival, plant vigor, mature leaf size, petiole length, vine length, vine diameter, number of marketable storage roots, number of non-marketable storage roots, dry matter content and harvest index, the eight sweetpotato genotypes significantly differ.
Peke Negro OP, Bengueta and Kalbo-oy have 100% survival at 30 DAP. Miracle OP, Violet OP and Bengueta OP were vigorous at 60 DAP and at 90 DAP most of the genotypes were vigorous. Wagwag OP has the largest leaf while Kalbo-oy has the longest petiole. Bengueta has the longest vines while Miracle OP has the thickest vines.
Miracle OP obtained the highest number of marketable storage roots while Violet OP obtained the highest number of non-marketable storage roots. As to the weight of marketable, non-marketable storage roots and average storage root yield, no significant
and harvest index among the eight sweetpotato genotypes.
On the sensory evaluation of boiled storage roots, the color and consistency of boiled storage roots varied. Peke Negro was rated as the sweetest among the eight sweetpotato genotypes. Most of the sweetpotato genotypes showed positive ROCE.
Miracle OP, Peke Negro OP, Wagwag OP and Bengueta are recommended at Poblacion, Kibungan, Benguet. Based on storage root yield, ROCE, resistance to scab disease and vigor, these sweetpotato genotypes can be profitably grown. Furthermore, characterization of sweetpotato germplasm should be a continuing activity.
Page
Bibliography. . . i
Abstract . . . i
Table of Contents . . . iii
INTRODUCTION . . . 1
REVIEW OF LITERATURE . . . . . . 3
MATERIALS AND METHODS . . . 5
RESULTS AND DISCUSSION . . . 17
Plant survival . . . 17
Plant vigor . . . 18
Plant type . . . 21
Mature leaf shape . . . 21
Mature leaf size . . . 21
Abaxial leaf vein pigmentation . . . 21
Petiole pigmentation . . . 22
Foliage color . . . 22
Petiole length . . . 22
Vine length . . . 22
Vine diameter . . . 24
Vine pigmentation . . . 24
Vine tip pubescence . . . .. 25
Storage root formation. . . 25
Storage root surface defects. . . 26
Storage root skin color . . . 26
Storage root flesh color . . . 26
Disease infestation and insect infestation . . . 28
Number and weight of marketable storage roots . . . 29
Number and weight of non-marketable storage roots . . . 30
Storage root yield per plant . . . 32
Sensory evaluation . . . 32
Dry matter content . . . 36
Harvest index . . . 36
Return on cash expense . . . 37
SUMMARY, CONCLUSIONS AND RECOMMENDATION Summary . . .. . . 39
Conclusions . . . 40
Recommendation . . . 41
LITERATURE CITED . . . ….. …. 42
APPENDICES . . . ……… 43
INTRODUCTION
Sweetpotato (Ipomoea batatas L.) is an important crop in the Cordillera. The root is used as a staple food and the herbage is used as a main ingredient of swine in most places. The crop is cultivated for its edible or fleshy storage roots and green tops (NPRCRTC, 1990).
In the Philippines, sweetpotato is grown in rice fields just after rice, in backyards, small gardens and in swidden farm (NPRCRTC, 1990).
The potential of sweetpotato is recognized because of its many uses, it is utilized as human food, animal feed and as industrial raw material. According to Mackay et al.
(1989) root crops, particularly sweetpotatoes are often served as substitute for the carbohydrate needs of most Filipinos especially those living in the mountains or remote areas.
Sweetpotato as an important crop in the highlands must be given importance in such a way that it will have high yield or production which will able to supply and substitute the need of the people in times of food shortage.
Production of sweetpotatoes commercially could be considered a very important factor by farmers in order to sustain food supply and other products derived from sweetpotatoes. One way to attain this is by choosing and planting the right varieties with good agronomic characteristics.
In the survey conducted by NPRCRTC (1990) sweetpotato farmers expressed the need for improved varieties with good eating quality, high yielding, resistant to pests and diseases and adapted to local conditions. With this situation, there is a need to introduce other varieties that are high yielding and acceptable to the preferences of farmers as well
as to consumers. Thus, in order to determine the good varieties of sweetpotato and to meet the demands of farmers and consumers, characterization and evaluation is necessary.
Morphological characterization of accessions in a collection is important not only to have a description of each accession but as well as identifying duplicate accessions (Huaman, 2008). In addition, many of the characteristics that are recorded on individual accessions can serve as diagnostic descriptors for the accessions. Such diagnostic characters help genebank curators keep track of an accession and check for the genetic integrity over a number of years of conservation (IBPGR, 1981).
The study was conducted to determine the agronomic characters of open- pollinated sweetpotato genotypes in Poblacion, Kibungan, Benguet and to determine the sweetpotato genotypes that are adapted in the locality.
The study was conducted at Poblacion, Kibungan, Benguet from October 2007 to March 2008.
REVIEW OF LITERATURE
Varietal Characterization
Variety characterization is the process of documenting variety traits that are useful in distinguishing one variety from other varieties. In judging the worth of a variety, some of these traits are useful not only for variety identification but as well as for evaluation. In characterization, traits used are generally more stable and need not to be taken repetitively in various stages of variety evaluation. In addition, characterization data are used to eliminate duplicates in a collection, to assess agronomic and utilization potential of an accession, to check accuracy of labeling in field experiments, and to serve as basis for rouging mixtures in multiplication fields (Rasco and Amante, 1994).
Characterization Studies in Sweetpotato
In a study conducted by Rebujio (2003) on the morphological characterization, diversity analysis and evaluation of sweetpotato genotypes results show that twenty sweetpotato genotypes significantly differ for all characters measured. The result showed that Tagalog, PSBSP 17 and Kawitan produced the highest storage root yield. Diversity indices show low variation for qualitative characters and high variation quantitative characters.
Shagol (2001) studied the morphological characters associated with yield in sweetpotato and found out that the ten sweetpotato varieties are variable in morphology and there was no strong association between the morphological characters and yield.
Based on the results, growth and yield performance of ten sweetpotato varieties depends on the genetic constitution and the environment where they were grown.
A study on characterization and evaluation of “ Kalbo–oy” strains collected from different sources by Sanggawa (2004) showed that the different “Kalbo-oy” strains were morphologically similar in terms of plant type, leaf characters (shape, central lobe, and foliage color), storage root formation and storage root defects. However, the “Kalbo-oy”
strains were significantly different in terms of canopy cover, number of leaves, leaf area, number of nodes and vine length. The results showed that “Kalbo-oy” strains are very variable in some morphological characteristics and storage root yield parameters.
Alfonso (2006) conducted a study on the characterization, evaluation, diversity and cluster analysis of sweetpotato varieties in La Trinidad, Benguet results show that the qualitative and quantitative characteristics of sixteen sweetpotato varieties varied. It was found out that the sixteen sweetpotato varieties exhibited highly significant differences for all quantitative characters measured.
MATERIALS AND METHODS
Land Preparation
An area of 120 m2 was manually cleaned and prepared for planting. The area was divided into three blocks and each block consists of eight plots each measuring 1 x 5 m.
The experiment was laid out using randomized complete block design (RCBD).
Treatments
The genotypes were taken from the Northern Philippine Rootcrops Research and Training Center, Benguet State University La Trinidad, Benguet while the check variety
“Kalbo-oy” was taken from Kibungan, Benguet.
The genotypes used were:
CODE GENOTYPE G1 Darwin OP
G2 Kawitan OP
G3 Miracle OP
G4 Peke Negro OP
G5 Violet OP
G6 Wagwag OP
G7 Bengueta (check)
G8 Kalbo-oy(check)
Planting and Planting Distance Stem cuttings with a length of 25-30 cm were planted at one cutting per hill.
Spacing was 30 cm between rows and 30 cm between hills.
% survival= X 100 Cultural Management Practices
All cultural management practices such as irrigation, weeding, and hilling-up were uniformly employed.
Data Gathered:
The descriptors list for sweetpotato by Huaman (1991) was used.
1. Plant survival (%). This was the percentage of plants that survived and it was taken by counting plant stand 30 DAP and computed using the formula:
Number of plants that survived Total number of plants planted
2. Plant vigor. This was taken at 60 and 90 DAP using the CIP rating scale.
SCALE DESCRIPTION REMARKS 1 Plants are weak with few stems and Poor vigor Leaves; very pale
2 Plants are weak with few thin stems Less vigorous and leaves
3 Better than less vigorous Vigorous 4 Plants are moderately strong with
robust stems and leaves; leaves are Moderately light green in color vigorous 5 Plants are strong with robust stems Highly vigorous and leaves; leaves are dark green in color
3. Plant type. The growth habit at 90 DAP was described using the scale as follows:
SCALE DESCRIPTION
3 Erect (<75)
5 Semi-erect (75-150)
SCALE DESCRIPTION
7 Spreading (151-250 cm)
9 Extremely spreading (>250) 4. Leaf characters
a. Mature leaf shape. This was taken at 90 DAP and the leaves on the 8th node was considered. This was described by a three- digit code where the first digit (hundreds) indicates the type of the most common expression of leaf lobing, the second digit (tens), the average total number of lobes, and the third digit (units) indicates the shape of the central lobe of leaves.
TYPE OF LEAF LOBING NO. OF LOBES SHAPE OF CENTRAL LEAF LOBE
0-No lateral lobes 0-Absent 1-Very slight (teeth) 1 1-Toothed 3-Slight 3 2-Triangular 5-Moderate 5 3-Semi-circular 7-Deep 7 4-Semi-elliptic 9-Very deep 9 5-Elliptic
6-Lanceolate 7-Oblanceolate 8-Linear (broad) 9-Linear (narrow)
b. Mature leaf size. This was measured from the basal lobes to the tip of the leaves and was recorded using the following scale:
SCALE DESCRIPTION 3 Small (<8cm)
5 Medium (8-15cm)
7 Large (16-25cm)
9 Very large (>25cm)
c. Abaxial leaf vein pigmentation. This refers to the distribution of anthocyanin pigmentation shown in the veins of the lower surface of leaves. The most frequent expression was recorded at 90 DAP using the 1-9 scale follows:
SCALE DESCRIPTION
1 Yellow
2 Green
3 Purple spot in the base of main rib 4 Purple spots in several veins 5 -Main rib partially purple 6 Main rib mostly or totally purple 7 All veins partially purple 8 All veins mostly or totally purple
9 Lower surface and veins totally purple
d. Petiole pigmentation. Refers to the anthocyanin pigmentation in the petioles of leaves. The most predominant color was recorded as follows and was taken at 90 DAP using the 1-9 scale as follows:
SCALE DESCRIPTION
1 Green
2 Green with purple near stem 3 Green with purple near leaf 4 Green with purple at both ends
5 Green with purple spots throughout petiole
6 Green with purple stripes 7 Purple with green near leaf 8 Some petioles purple, others green 9 Totally or mostly purple e. Foliage color. The color of fully expanded mature and immature leaves was taken at 90 DAP using the 1-9 scales as follows:
SCALE DESCRIPTION
1 Yellow-green
2 Green
3 Green with purple edge
4 Grayish-green
5 Green with purple veins on upper
surface
6 Slightly purple
7 Mostly purple
8 Green upper, purple lower
9 Purple both surfaces
f. Petiole length. The petiole length was measured from the base to the insertion with the blade and was recorded at 90 DAP using a scale as follows:
SCALE DESCRIPTION
1 Very short (<10 cm)
3 Short (10-20 cm)
5 Intermediate (21-30 cm) 7 Long (31-40 cm)
9 Very long (>40 cm) 5. Vine/ Stem characters
a. Vine length and diameter. This was obtained using the following scales:
INTERNODE LENGTH INTRERNODE DIAMETER 1-Very short (3 cm) 1- Very thin (4 mm)
3-Short (3-5 cm) 3- Thin (4-6 mm)
5-Intermediate (6-9 cm) 5- Intermediate (7-9 mm) 7-Long (10-12 cm) 7- Thick (10-12 mm)
9- Very long (>12 cm) 9- Very thick (>12 mm) b. Vine pigmentation. This refers to the presence of anthocyanin pigmentation in the vines besides the green color. This was taken at 90 DAP using the following scales:
PREDOMINANT VINE COLOR SECONDARY VINE COLOR
1-Green 0-Absent
3-Green with few purple spots 1-Green base 4-Green with many purple spots 2-Green tip
PREDOMINANT VINE COLOR SECONDARY VINE COLOR 5-Green with many dark 3-Green nodes
purple spots
6-Mostly purple 4-Purple base 7-Mostly dark purple 5-Purple tip 8-Totally dark purple 6-Purple nodes 9-Totally dark purple
c. Vine tip pubescence. Refers to the degree of hairiness of immature leaves recorded at the apex of the vines and was taken at 60 DAP using a rating scale as follows:
SCALE DESCRIPTION
0 Absent
3 Sparse
5 Moderate
7 Heavy
6. Storage root characters
a. Storage root formation. The arrangement of storage roots on the underground stems was described as follows:
SCALE DESCRIPTION
1 Closed cluster
3 Open cluster
7 Dispersed
9 Very dispersed
b. Storage root shape. This was described as follows:
SCALE DESCRIPTION
1 Round
2 Round elliptic
3 Elliptic
4 Ovate
5 Obovate
6 Oblong
7 Long oblong
8 Long elliptic
9 Long irregular or curved
c. Storage root surface defects. This was described as follows:
SCALE DESCRIPTION
0 Absent
1 Alligator- like skin
2 Veins
3 Shallow horizontal constrictions
4 Deep horizontal constrictions
5 Shallow longitudinal constrictions
6 Deep longitudinal constrictions
7 Deep constrictions and deep grooves
d. Storage root skin color. This was described as follows:
PREDOMINANT SKIN COLOR INTENSITY OF PREDOMINANT SKIN COLOR 1-White 1-Pale
2- Cream 2-Intermediate 3-Yellow 3-Dark
4-Orange
5- Brownish orange 6-Pink
7-Red 8-Purple red 9-Dark purple
e. Storage root flesh color. The color of the cross section of fresh storage roots was described using the scales from 1-9 as follows:
PREDOMINANT SKIN COLOR SECONDARY FLESH COLOR 1-White 0-Absent
2-Cream 1- White 3 -Dark cream 2- Cream 4 -Pale yellow 3- Yellow 5-Dark yellow 4- Orange 6-Pale orange 5- Pink 7-Intermediate orange 6- Red 8-Dark orange 7- Purple red 9-Strongly pigmented with anthocyanins 8-Purple
9-Dark purple
7. Disease (scab) and insect (leaf folder and beetles) incidence.
a. Scab disease. This was evaluated by rating the degree of disease using the Rasco and Amante (1994) rating scale as follows:
SCALE DESCRIPTION REACTION
1 No symptom Highly resistant
2 Few lesions on leaves and stem; Resistant
Slight infection
5 Several lesions on leaves and stems; Moderately resistant
No leaf deformation
7 Several lesions on leaves and stems; Susceptible Lesions coalesced with slight leaf
deformation
9 Lesions on leaves and stems coalesced; Highly susceptible Severe leaf deformation and stem twisting
b. Beetle and leaf folder. This was evaluated by rating the degree of insect damage using the Rasco and Amante( 1994) rating scale as follows:
SCALE DESCRIPTION
1 Heavy infestation (more than 50%) 2 Medium heavy infestation (25- 50 %) 3 Medium infestation (5- 25 %)
4 Medium light infestation (1- 5 %) 5 Light infestation (less than 1%) 8. Yield and yield components
a. Number and weight of marketable storage roots (kg). All storage roots with a diameter of 3 cm and above and free from injuries were counted and weighed at harvest.
b. Number and weight of non- marketable storage roots (kg). These were storage roots with a diameter of less than 3 cm and have sufficient damage were weighed at harvest.
c. Storage yield per plant (kg). Storage roots from each treatment per replication were weighed at harvest.
9. Sensory evaluation. Sample roots were boiled and evaluated according to consistency, color, and sweetness using the following scales:
CONSISTENCY OF BOILED STORAGE ROOTS
COLOR OF BOILED STORAGE ROOTS
SWEETNESS OF BOILED STORAGE ROOTS
1-Watery 1-Some beige 1- Bland
2-Extremely soft 2-Much beige 2- Slightly sweet 3-Very soft 3-Sligthly green or 3-Moderately sweet
4-Soft 4-Green 4- Sweet
5-Slightly hard 5- Grey 5-Very sweet
6-Moderately hard 6- Beige and green 7-Hard 7- Beige and grey 8-Very hard 8-Beige and purple 9-Very hard and not
cooked
9-Purple
10. Dry matter content. The dry matter content of storage roots was determined by getting 100g sample from a mixture of two to three sample roots from 5 plants per treatment, cut into pieces longitudinally and transversely. Samples were oven dried at 60
0C for 4 to 5 days. Dry matter content was obtained using the following formula:
X 100 HI=
a. MC = fresh weight – dry weight x 100 fresh weight
b. % DMC=100-% MC
11. Harvest index. This was computed using the formula as follows:
SRDW
LDW+VDW+SRDW+RDW
Where:
SRDW= Storage root dry weight LDW=Leaf dry weight
VDW= Vine dry weight RDW= Root dry weight
12. Return on cash expense (ROCE). This was computed using the following formula:
Net Income ROCE =
Total cost of production
Data Analysis
Data was statistically analyzed using analysis of variance for randomized complete block design. Significance of difference between treatments was tested using the Duncan’s Multiple Range Test (DMRT).
RESULTS AND DISCUSSION
Plant Survival
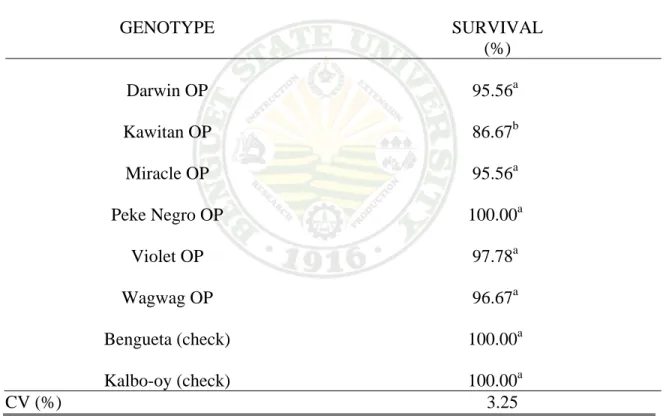
Table 1 shows the percentage survival of eight sweetpotato genotypes. Highly significant differences were observed among the sweetpotato genotypes. Most of the genotypes evaluated have high percentage of survival of more than 95%. However, Kawitan OP gave the lowest percentage survival of 86.67%.
Table 1. Percentage survival of eight sweetpotato genotypes at 30 days after planting (DAP)
GENOTYPE SURVIVAL
(%)
Darwin OP 95.56a
Kawitan OP 86.67b
Miracle OP 95.56a
Peke Negro OP 100.00a
Violet OP 97.78a
Wagwag OP 96.67a
Bengueta (check) 100.00a
Kalbo-oy (check) 100.00a
CV (%) 3.25
Means with the same letter are not significantly different at 5% level by DMRT.
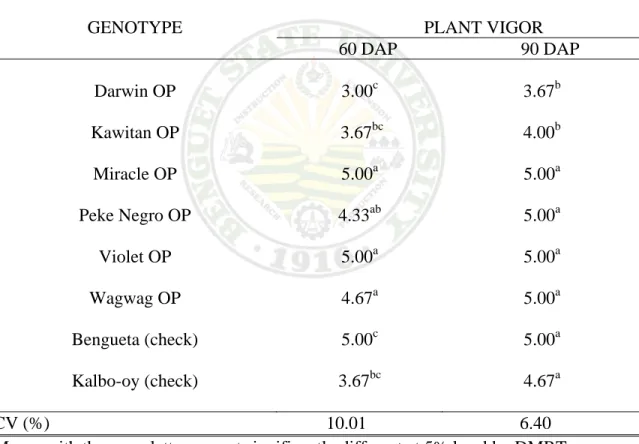
Plant Vigor
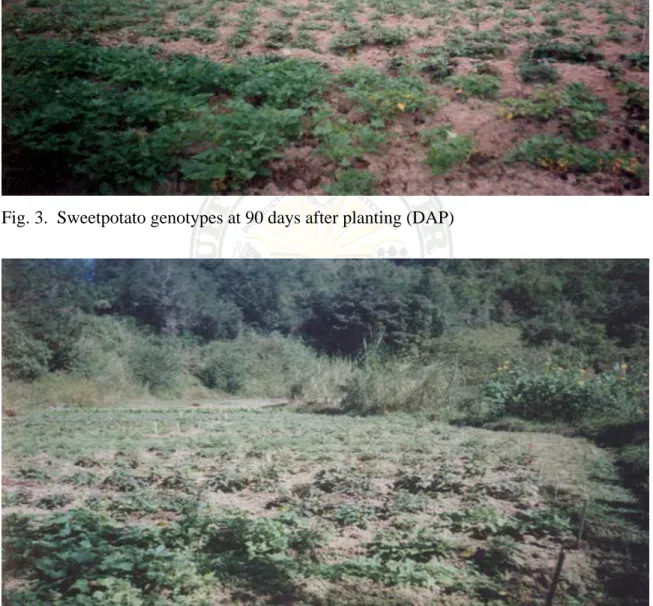
Highly significant differences were observed on the plant vigor of the eight sweetpotato genotypes at 60 and 90 DAP (Table 2). It was observed that Miracle OP Violet OP and Bengueta were the most vigorous except for Darwin OP, Kawitan OP and Kalbo-oy OP which were vigorous and moderately vigorous. Figure 1-4 present the plants at 30, 60, 90 and 120 DAP.
Table 2. Plant vigor of eight sweetpotato genotypes at 60 and 90 days after planting (DAP)
GENOTYPE PLANT VIGOR
60 DAP 90 DAP
Darwin OP 3.00c 3.67b
Kawitan OP 3.67bc 4.00b
Miracle OP 5.00a 5.00a
Peke Negro OP 4.33ab 5.00a
Violet OP 5.00a 5.00a
Wagwag OP 4.67a 5.00a
Bengueta (check) 5.00c 5.00a
Kalbo-oy (check) 3.67bc 4.67a
CV (%) 10.01 6.40
Means with the same letter are not significantly different at 5% level by DMRT.
Rating scale (1-5): 1 - Poor vigor; 2 – Less vigorous; 3 – Vigorous; 4 – Moderately vigorous, 5 – Highly vigorous
Fig. 1. Sweetpotato genotypes at 30 DAP
Fig . 2. Sweetpotato genotypes at 60 DAP
Fig. 3. Sweetpotato genotypes at 90 days after planting (DAP)
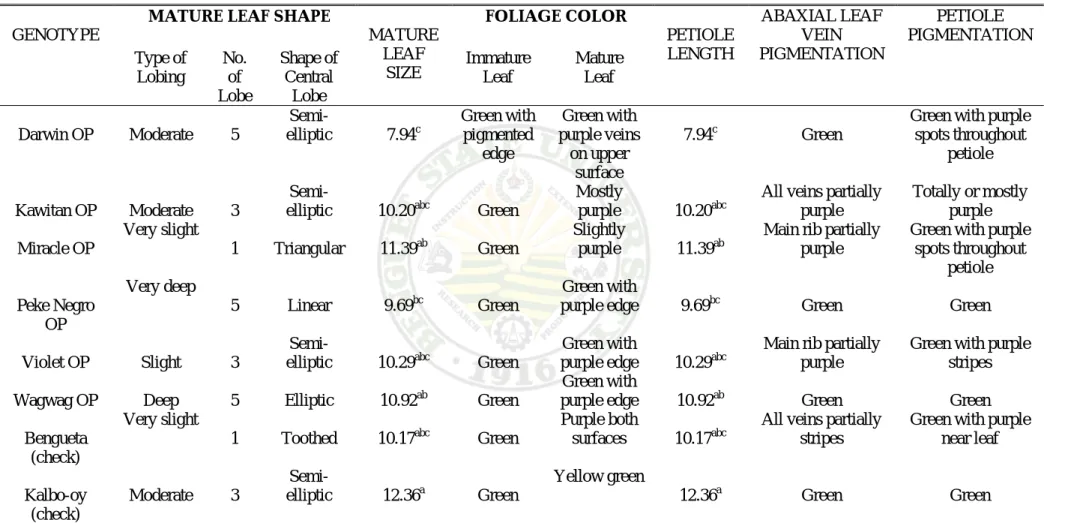
Fig. 4. Sweetpotato genotypes at 120 days after planting (DAP)
Plant Type
Most of the sweetpotato genotypes were spreading except for Miracle OP that was semi-erect and Bengueta that was extremely spreading.
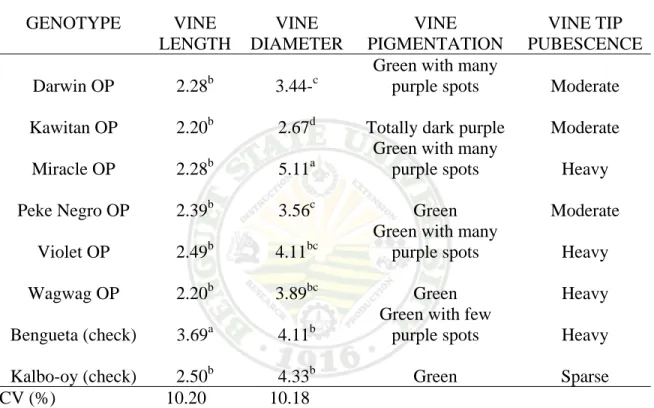
Leaf Characters Mature Leaf Shape
The eight sweetpotato genotypes varied in their type of leaf lobing, lobe number and shape of central lobe (Table 3).
Mature Leaf Size
Mature leaf size of eight sweetpotato genotypes are shown in Table 3. Significant differences were observed among the sweetpotato genotypes. Wagwag OP has the largest leaf of 11.12 cm which is comparable with Miracle OP and Violet OP with 10.36 cm and 10.19 cm respectively. On the other hand, Darwin OP has the smallest leaf of 8.43 cm.
Abaxial Leaf Vein Pigmentation
Abaxial leaf vein pigmentation of the eight sweetpotato genotypes are shown in Table 3. Green abaxial leaf vein pigmentation was observed from Darwin OP, Peke Negro OP, Wagwag OP and Kalbo-oy. On the other hand, main rib partially purple was observed from Miracle OP and Violet OP while Kawitan OP and Bengueta have abaxial leaf vein pigmentation of all the veins partially purple.
Petiole Pigmentation
Green petiole pigmentation was observed from Peke Negro OP, Wagwag OP and Kalbo-oy. Green with purple stripes was observed from Violet OP while Bengueta has green with purple near leaf petiole pigmentation. Darwin OP and Miracle OP have green with purple spots throughout petiole while Kawitan OP has totally or mostly purple petiole pigmentation (Table 3).
Foliage Color
The color of the mature and immature leaves of eight sweetpotato genotypes are shown in Table 3. Most of the genotypes have green mature leaf color except for Darwin OP with a mature leaf color of green with pigmented edge. However, the different sweetpotato genotypes showed variability in terms of immature leaf color.
Petiole Length
Petiole length of eight sweetpotato genotypes significantly differed (Table 3).
Kalbo-oy significantly gave the longest petiole comparable with Miracle OP and Wagwag OP while Darwin OP has the shortest petiole.
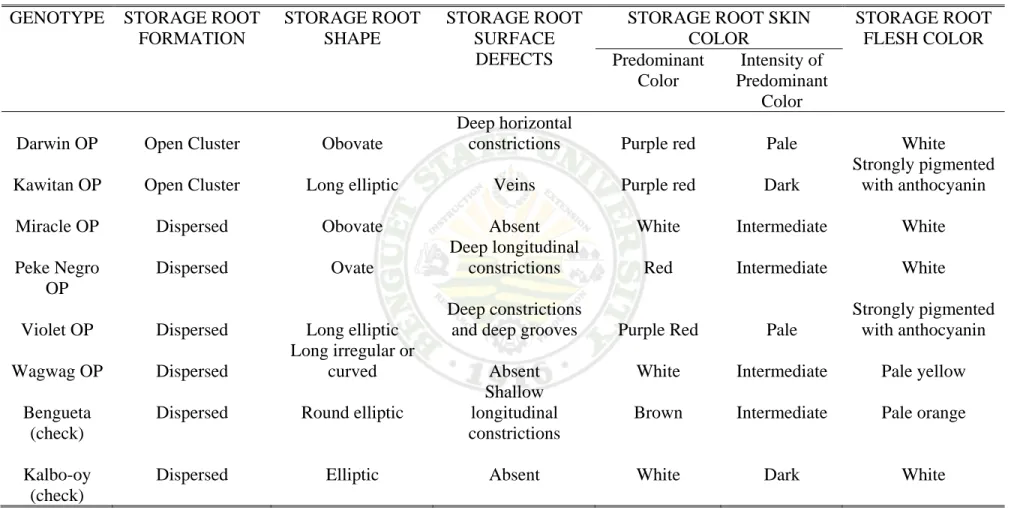
Vine Characters Vine Length
Results showed highly significant differences on the vine length of the eight sweet potato genotypes (Table 4). It was observed that Bengueta significantly had the longest vines as compared with the other genotypes.
Table 3. Leaf characters of eight sweetpotato genotypes
Means in a column followed by a common letter are not significantly different from each other at 5% level DMRT GENOTYPE
MATURE LEAF SHAPE
MATURE LEAF
SIZE
FOLIAGE COLOR
PETIOLE LENGTH
ABAXIAL LEAF VEIN PIGMENTATION
PETIOLE PIGMENTATION Type of
Lobing
No.
of Lobe
Shape of Central
Lobe
Immature Leaf
Mature Leaf
Darwin OP Moderate 5
Semi-
elliptic 7.94c
Green with pigmented
edge
Green with purple veins
on upper surface
7.94c Green
Green with purple spots throughout
petiole
Kawitan OP Moderate 3
Semi-
elliptic 10.20abc Green
Mostly
purple 10.20abc
All veins partially purple
Totally or mostly purple Miracle OP
Very slight
1 Triangular 11.39ab Green
Slightly
purple 11.39ab
Main rib partially purple
Green with purple spots throughout
petiole Peke Negro
OP
Very deep
5 Linear 9.69bc Green
Green with
purple edge 9.69bc Green Green
Violet OP Slight 3
Semi-
elliptic 10.29abc Green
Green with
purple edge 10.29abc
Main rib partially purple
Green with purple stripes
Wagwag OP Deep 5 Elliptic 10.92ab Green
Green with
purple edge 10.92ab Green Green
Bengueta (check)
Very slight
1 Toothed 10.17abc Green
Purple both
surfaces 10.17abc
All veins partially stripes
Green with purple near leaf
Kalbo-oy (check)
Moderate 3
Semi-
elliptic 12.36a Green
Yellow green
12.36a Green Green
Vine Diameter
Results showed highly significant differences on vine diameter of the eight sweetpotato genotypes (Table 4). Miracle OP significantly had the thickest vines followed by Kalbo-oy. Thin vines were observed from Darwin OP.
Table 4. Vine characters of the eight sweetpotato genotypes
GENOTYPE VINE LENGTH
VINE DIAMETER
VINE PIGMENTATION
VINE TIP PUBESCENCE Darwin OP 2.28b 3.44-c
Green with many
purple spots Moderate Kawitan OP 2.20b 2.67d Totally dark purple Moderate
Miracle OP 2.28b 5.11a
Green with many
purple spots Heavy Peke Negro OP 2.39b 3.56c Green Moderate
Violet OP 2.49b 4.11bc
Green with many
purple spots Heavy
Wagwag OP 2.20b 3.89bc Green Heavy
Bengueta (check) 3.69a 4.11b
Green with few
purple spots Heavy Kalbo-oy (check) 2.50b 4.33b Green Sparse CV (%) 10.20 10.18
Means with the same letter are not significantly different at 5% level by DMRT.
Vine Pigmentation
Peke Negro OP, Wagwag OP and Kalbo-oy were noted to have green vines.
Darwin OP and Miracle OP have green with many purple spots while green with many dark purple spots was observed from Violet OP, green with few purple spots was
observed from Bengueta and totally dark purple was observed from Kawitan OP (Table 4).
Vine Tip Pubescence
Table 4 shows the vine tip pubescence of eight sweetpotato genotypes.
Miracle OP, Violet OP, Wagwag OP and Bengueta has heavy vine tip pubescence while the rest of the sweetpotato genotypes have moderate vine tip pubescence except for Kalbo-oy, which has a sparse vine tip pubescence.
Storage Root Characters
Table 5 summarizes the storage root formation, storage root shape, storage root surface defects, storage root skin color and storage root flesh color of eight sweetpotato genotypes.
Storage Root Formation
Most of the sweetpotato genotypes have dispersed storage root formation. Peke Negro OP, Violet OP, Wagwag OP, Bengueta and Kalbo-oy have dispersed storage root formation while Darwin OP, Kawitan OP and Miracle OP have open cluster storage root formation.
Storage Root Shape
Storage root shape of eight sweetpotato genotypes varied. Darwin OP and Miracle OP have obovate shape while Peke Negro OP was ovate. Long elliptic storage root shape was observed from genotypes Kawitan OP and Violet OP while the rest,
Bengueta, Kalbo-oy and Wag-wag OP have round elliptic, elliptic and long irregular or curved storage root shape respectively.
Storage Root Surface Defects
Darwin OP, Peke Negro OP and Violet OP were observed to have deep horizontal constrictions, deep longitudinal constrictions, deep constrictions and deep grooves.
Kawitan OP shows shallow longitudinal constrictions while Kawitan OP has veins storage root surface defects. On the otherhand, absence of storage root surface defects were observed from Wagwag OP, Kalbo-oy and Miracle OP.
Storage Root Skin Color
It was observed that Darwin OP, Kawitan OP and Violet OP have a purple red skin color of storage roots. White skinned storage roots were observed from Miracle OP, Wagwag OP and Kalbo-oy. On the other hand, Peke Negro OP has red skinned storage roots while Bengueta has brown skinned storage roots of storage root. The intensity of storage root skin color differs among the genotypes.
Storage Root Flesh Color
The storage roots flesh color of the eight sweetpotato genotypes varies from white to strongly pigmented with anthocyanin. Darwin OP, Miracle OP, Peke Negro OP and Kalbo-oy have white flesh while Kawitan OP and Violet OP have a storage root flesh strongly pigmented with anthocyanin. Wagwag OP was observed to have a pale yellow flesh while Bengueta has a pale orange flesh.
Table 5. Storage root characters of the eight sweetpotato genotypes GENOTYPE STORAGE ROOT
FORMATION
STORAGE ROOT SHAPE
STORAGE ROOT SURFACE DEFECTS
STORAGE ROOT SKIN COLOR
STORAGE ROOT FLESH COLOR Predominant
Color
Intensity of Predominant
Color Darwin OP Open Cluster Obovate
Deep horizontal
constrictions Purple red Pale White
Kawitan OP Open Cluster Long elliptic Veins Purple red Dark
Strongly pigmented with anthocyanin
Miracle OP Dispersed Obovate Absent White Intermediate White
Peke Negro OP
Dispersed Ovate
Deep longitudinal
constrictions Red Intermediate White
Violet OP Dispersed Long elliptic
Deep constrictions
and deep grooves Purple Red Pale
Strongly pigmented with anthocyanin Wagwag OP Dispersed
Long irregular or
curved Absent White Intermediate Pale yellow
Bengueta (check)
Dispersed Round elliptic
Shallow longitudinal constrictions
Brown Intermediate Pale orange
Kalbo-oy (check)
Dispersed Elliptic Absent White Dark White
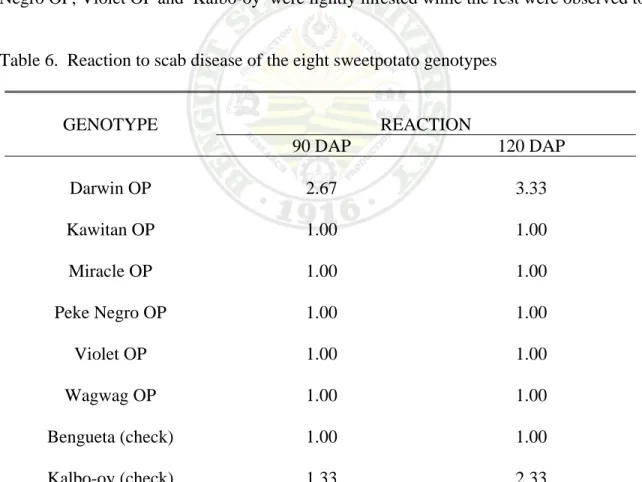
Disease Incidence and Insect Infestation Scab Disease Incidence
Table 6 shows the leaf scab damaged of the eight sweetpotato genotypes. It was observed that most of the genotypes were highly resistant at 90 and 120 days after planting except for Darwin OP that was least resistant.
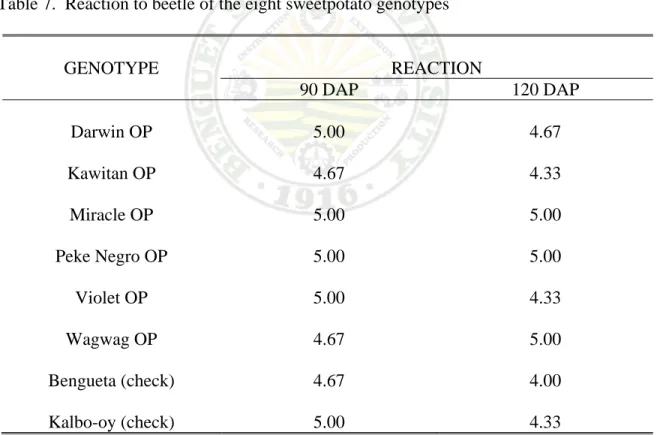
Insect (Beetle and Leaf Folder) Infestation
Medium light infestations to light infestation of beetles were observed among the eight sweetpotato genotypes evaluated. At 90 DAP, Darwin OP, Miracle OP, Peke Negro OP, Violet OP and Kalbo-oy were lightly infested while the rest were observed to
Table 6. Reaction to scab disease of the eight sweetpotato genotypes
GENOTYPE REACTION
90 DAP 120 DAP
Darwin OP 2.67 3.33
Kawitan OP 1.00 1.00
Miracle OP 1.00 1.00
Peke Negro OP 1.00 1.00
Violet OP 1.00 1.00
Wagwag OP 1.00 1.00
Bengueta (check) 1.00 1.00
Kalbo-oy (check) 1.33 2.33
Rating Scale (1-7): 1-Highly resistant; 3-Resistant; 5–Moderately resistant, 7-Susceptible
have a medium light infestation. At 120 DAP, most of the genotypes have medium light infestation except for Miracle OP, Peke Negro OP and Wagwag OP with light infestation.
On the other hand, all the genotypes were not infested with leaf folder (Table 7).
Yield and yield components Number and Weight of Marketable
Storage Roots
As shown in Table 8, there were significant differences among the genotypes in terms of number of marketable storage roots. Miracle OP produced the most numerous storage roots (65.00) followed by Wagwag OP (49.33). On the other hand, there were no
Table 7. Reaction to beetle of the eight sweetpotato genotypes
GENOTYPE REACTION
90 DAP 120 DAP
Darwin OP 5.00 4.67
Kawitan OP 4.67 4.33
Miracle OP 5.00 5.00
Peke Negro OP 5.00 5.00
Violet OP 5.00 4.33
Wagwag OP 4.67 5.00
Bengueta (check) 4.67 4.00
Kalbo-oy (check) 5.00 4.33
Rating Scale (1-5): 1-Heavy infestation; 2-Medium heavy infestation; 3-Medium infestation; 4-Medium light infestation, 5–Light infestation
Table 8. Number and weight of marketable storage roots of the eight sweetpotato genotypes
GENOTYPE MARKETABLE STORAGE ROOTS
Number Weight (kg/plant)
Darwin OP 17.67c 1.48
Kawitan OP 34.33bc 1.93
Miracle OP 65.00a 5.00
Peke Negro OP 35.67b 3.47
Violet OP 37.33b 3.15
Wagwag OP 49.33ab 4.25
Bengueta (check) 42.00b 3.67
Kalbo-oy (check) 38.67b 3.40
CV (%) 24.31 40.51
Means with the same letter are not significantly different at 5% level by DMRT.
significant differences among the sweetpotato genotypes in terms of weight of marketable storage roots. However, high marketable weight was obtained in Miracle OP (5.00 kg.)
Number and Weight of Non-Marketable Storage Roots
As shown in Table 9, significant differences were noted among the eight sweetpotato genotypes in terms of non-marketable storage roots. Violet OP produced the most numerous non-marketable storage roots with a mean of 83.00 as compared to
Kawitan OP (63.67), Peke Negro OP (62.67) and Miracle OP (60.00). In terms of non- marketable weight, results showed no significant differences. Nevertheless, genotype Miracle OP obtained the heaviest weight of non-marketable storage roots.
It was observed that the number of non-marketable storage roots was higher than the number of marketable storage roots and this could be attributed by improper sorting when the marketable storage roots were considered as non-marketable. This could explain the high CV obtained.
Table 9. Number and weight of non-marketable storage roots of the eight sweetpotato genotypes
GENOTYPE NON-MARKETABLE STORAGE ROOTS
Number Weight (kg/plant)
Darwin OP 40.67bc 0.92
Kawitan OP 63.67ab 1.35
Miracle OP 60.00ab 0.93
Peke Negro OP 83.00a 1.42
Violet OP 37.67bc 1.42
Wagwag OP 42.00bc 0.93
Bengueta (check) 30.33c 0.77
Kalbo-oy (check) 38.67b 0.65
CV (%) 28.93 35.29
Means with the same letter are not significantly different at 5% level by DMRT.
Storage Root Yield per Plant
Storage root yield per plant did not significantly differ among the eight sweetpotato genotypes (Table 10). Numerically, yield was higher in Miracle OP (5.93 kg) as compared with the other genotypes. Fewer yield was observed on the genotype Darwin OP (2.40 kg). Figure 5 and 6 show the storage roots harvested from the different genotypes.
Sensory Evaluation
Table 11 shows the consistency of boiled storage roots, color of boiled storage roots and sweetness of boiled storage roots of the eight sweetpotato genotypes evaluated.
Table 10. Storage root yield per plant of the eight sweetpotato genotypes
GENOTYPE STORAGE ROOT YIELD
(kg/plant)
Darwin OP 2.40
Kawitan OP 3.28
Miracle OP 5.93
Peke Negro OP 4.88
Violet OP 4.57
Wagwag OP 5.18
Bengueta (check) 4.43
Kalbo-oy (check) 4.05
CV (%) 27.78
Means with the same letter are not significantly different at 5% level by DMRT.
Fig. 5. Marketable storage roots of the eight sweetpotato genotypes: 1-Kalbo-oy (check), 2-Kawitan OP, 3-Miracle OP, 4-Darwin OP, 5-Wagwag OP, 6-Peke Negro OP, 7- Violet OP and Bengueta (check)
Fig. 6. Storage root yield per plant of the eight sweetpotato genotypes: 1-Kalbo-oy (check) OP; 2-Kawitan OP; 3-Miracle OP; 4-Darwin OP; 5-Wagwag OP;
6-Peke OP; 7-Violet OP, 8-Bengueta (check)
Results showed that the consistency of boiled storage roots of Kawitan OP, Miracle OP, Peke Negro OP and Violet OP were soft; Darwin OP was very soft; Wagwag OP and Bengueta were slightly hard while Kalbo-oy was hard.
Genotypes Darwin OP, Miracle OP, Peke Negro OP, Wagwag OP and Kalbo-oy had grey color of the boiled storage root while genotypes Kawitan OP and Miracle OP showed purple color. Only genotype Bengueta was observed to have a pale orange color.
As for the consistency of boiled storage roots, Kawitan OP, Miracle OP, Peke Negro OP and Violet OP were soft while Darwin OP was very soft as compared to Wagwag OP and Bengueta were slightly hard while Kalbo-oy was hard. Most of the genotypes were slightly sweet (Darwin OP, Kawitan OP, Miracle OP, Violet OP, Wagwag OP and Bengueta except Kalbo-oy that was moderately sweet and Peke Negro OP which was sweet as evaluated by the panelists.
Table 11. Sensory evaluation of boiled storage roots of the eight sweetpotato genotypes
GENOTYPE CONSISTENCY COLOR SWEETNESS
Darwin OP Very soft Grey Slightly sweet
Kawitan OP Soft Purple Slightly sweet
Miracle OP Soft Grey Slightly sweet
Peke Negro OP Soft Grey Sweet
Violet OP Soft Purple Slightly sweet
Wagwag OP Slightly hard Grey Slightly sweet Bengueta (check) Slightly hard Pale orange Slightly sweet Kalbo-oy (check) Hard Grey Moderately Sweet
Dry Matter Content
Dry matter content of storage roots of eight sweetpotato genotypes are shown in Table 12. Highly significant differences were noted among the sweetpotato genotypes.
Kawitan OP significantly obtained the highest dry matter content of storage roots (33.23%) followed by Peke Negro OP (29.27%) while Miracle OP (20.93%) and Darwin OP (20.23%) gave the lowest dry matter content of storage roots.
Harvest Index
Highly significant differences were observed among the eight sweetpotato genotypes (Table 13). Kawitan (OP) significantly gave the highest harvest index (1.64) as compared to the other genotypes while Darwin OP obtained the lowest harvest index (0.69).
Table 12. Dry matter content of the eight sweetpotato genotypes
GENOTYPE DRY MATTER CONTENT
(%)
Darwin OP 20.23f
Kawitan OP 33.23a
Miracle OP 20.93f
Peke Negro OP 29.27b
Violet OP 25.37d
Wagwag OP 23.27e
Bengueta (check) 22.63e
Kalbo-oy (check) 27.20c
CV (%) 2.74
Means with the same letter are not significantly different at 5% level by DMRT.
Table 13. Harvest index of the eight sweetpotato genotypes
GENOTYPE HARVEST INDEX
Darwin OP 0.69c
Kawitan OP 1.64a
Miracle OP 0.99bc
Peke Negro OP 1.07bc
Violet OP 1.18b
Wagwag OP 1.10b
Bengueta (check) 0.93bc
Kalbo-oy (check) 0.92bc
CV (%) 19.13
Means with the same letter are not significantly different at 5% level by DMRT
Return on Cash Expense
Table 14 shows the return on cash expense of the eight sweetpotato genotypes.
Results revealed that most of the sweetpotato genotypes gave a positive ROCE. Miracle OP gave the highest ROCE (61.8%) followed by Wagwag OP (41.36%) while negative ROCE was obtained from Darwin OP and Kawitan OP with a ROCE of –34.55 % and –104.55% respectively.
Table 14. Return on cash expense from the eight sweetpotato genotypes
GENOTYPE
TOTAL COST OF PRODUCTION
(Php)
TOTAL YIELD (Kg)
GROSS INCOME
(Php)
NET INCOME
(Php)
ROCE (%)
Darwin OP 110 7.20 72.00 -38.00 -34.55
Kawitan OP 110 9.85 98.50 -115.00 -104.55
Miracle OP 110 17.80 178.00 68.00 61.82
Peke Negro OP
110 14.65 146.50 36.50 33.18
Violet OP 110 13.70 137.00 27.00 24.55
Wagwag OP 110 15.55 155.50 45.50 41.36
Bengueta (check)
110 13.30 133.00 23.00 20.91
Kalbo-oy (check)
110 12.15 121.50 11.50 10.45
*Total expenses includes tools and fertilizer used; selling price (10.00/kilo)
39
SUMMARY, CONCLUSIONS AND RECOMMENDATION
Summary
The study was conducted at Poblacion, Kibungan, Benguet from October 2007- April 2008 to determine the agronomic characters of open-pollinated sweetpotato genotypes and; to determine the sweetpotato genotypes adapted in the locality.
Eight (8) sweetpotato genotypes were characterized and evaluated. The eight sweet potato genotypes have varied leaf, stem and storage root characters. Most of the sweetpotato genotypes were spreading except for Bengueta that was extremely spreading and Miracle OP that was semi-erect.
No significant differences were noted on the weight of marketable storage roots, weight of non-marketable storage roots and average storage root yield. However, numerically, Miracle OP produced the heaviest weight of marketable storage roots and average storage roots while Peke Negro OP and Violet OP produced the heaviest weight of non-marketable storage roots. In terms of the number of non-marketable storage roots, mature leaf size, and petiole length of the eight sweetpotato genotypes, significant differences were observed. Violet OP significantly had the highest number of non- marketable storage roots comparable to Kawitan OP, Miracle OP and Peke Negro OP.
Darwin OP produced the least number of non-marketable storage roots. For the mature leaf size and petiole length, Wagwag OP significantly had the largest leaf comparable to Miracle OP and Violet OP while Kalbo-oy had the longest petiole comparable to Miracle OP and Bengueta. Smallest leaf and shortest petiole was observed from Darwin OP.
Results also showed highly significant differences among the eight sweetpotato genotypes in terms of plant survival, plant vigor, number of marketable storage roots, dry
matter content, harvest index, vine length and vine diameter. In terms of plant vigor, Miracle OP, Peke Negro OP and Bengueta were highly vigorous while Darwin OP was least vigorous at 60 DAP. At 90 DAP, most of the sweetpotato genotypes were highly vigorous except for Darwin OP which was the least vigorous. Miracle OP gave the highest number of marketable storage roots while Darwin OP produced the least number of marketable storage roots. Kawitan OP has high dry matter content and harvest index among the eight sweetpotato genotypes.
Most of the sweetpotato genotypes were highly resistant to scab disease except for Darwin OP.
On the sensory evaluation of boiled storage roots, the color and consistency of boiled storage roots varied while for the sweetness of boiled storage roots, Peke Negro OP was rated as the sweetest, Kalbo-oy as moderately sweet and the rest were slightly sweet. Most of the sweetpotato genotypes showed positive ROCE.
Conclusions
Sweetpotato genotypes differed in their morphological characters.
Based on storage root yield, ROCE resistance to scab disease and vigor, Miracle OP, Peke Negro OP, Violet OP, Wagwag OP, Bengueta and Kalbo-oy are adapted at Poblacion, Kibungan, Benguet and can be grown profitably.
Recommendation
Miracle OP, Peke Negro OP, Violet OP, Wagwag OP are recommended at Poblacion, Kibungan, Benguet. Characterization of sweetpotato germplasm should be a continuing activity.
LITERATURE CITED
ALFONSO, J. I. 2006. Characterization, evaluation, diversity and cluster analysis of sweetpotato varieties in La Trinidad, Benguet. BS Thesis. Benguet State University La Trinidad, Benguet. P. 52.
HUAMAN, Z. 2008. Morphologic identification of duplicates in collection of Ipomoea batatas accessed at http//www.cipotato.org/training/materials/sweetpotato% 201- 3.asp.
IBPGR.1981.Germplasmdocumentation accessed at http//www.bioversityinternational.
org/themes/germplasmdocumentation/index.asp
MACKAY, K. T., M. K. PALOMAR and T. SANICO. 1989. Sweetpotato research and development for small farmers. SEAMO-SEAILCA College, Laguna, Philippines. P.325.
NORTHERN PHILIPPINE ROOT CROPS RESEARCH AND TRAINING CENTER.
1990. Assessment of pest production, utilization and processing techniques, losses and problems in sweetpotatoes. NPRCRTC, Benguet State University, La Trinidad, Benguet. P. 2.
NORTHERN PHILIPPINES ROOT CROP RESEARCH AND TRAINIUNG CENTER.
1990. Highland Sweetpotatoes: 2nd Ann OP; 7-Violet OP, 8-Bengueta ual Report (August 1989- July 1990). NPRCRTC. Benguet State University. La Trinidad, Benguet. P. 48.
RASCO, E. T. and V. P. AMANTE. 1994. Sweetppotato variety evaluation. Vol. 1.
Southeast Asian Program for Potato Research and Development. Los Baňos, Laguna, Philippines. P. 26.
REBUJIO, M. L. 2003. Morphological characterization diversity analysis and evaluation of sweetpotato genotypes. BS Thesis. Benguet State University, La Trinidad, Benguet.P.42.
SANGGAWA, J. A. 2004. Characterization and evaluation of “Kalbo-oy” strains collected from different sources. BS Thesis. Benguet State University, La Trinidad, Benguet. P. 27.
SHAGOL, C. C. 2001. Morphological characters associated with yield on sweetpotato.
BS Thesis. Benguet State University, La Trinidad, Benguet. P. 24.
APPENDICES
APPENDIX TABLE 1. Percentage survival (%) at 30 days after planting (DAP)
GENOTYPE BLOCK TOTAL MEAN
I II III
Darwin OP 100.00 100.00 86.67 286.67 95.56 Kawitan OP 86.67 86.67 86.67 260.01 86.67 Miracle OP 96.67 96.67 93.33 286.67 95.56 Peke Negro OP 100.00 100.00 100.00 300.00 100.00
Violet OP 100.00 96.67 96.67 293.34 97.78 Wagwag OP 96.67 93.33 100.00 290.00 96.67 Bengueta (check) 100.00 100.00 100.00 300.00 100.00 Kalbo-oy (check) 100.00 100.00 100.00 300.00 100.00 TOTAL 780.01 773.34 763.34 2316.69 96.53
ANALYSIS OF VARIANCE
SOURCE OF VARIATION
DEGREES OF FREEDOM
SUM OF SQUARES
MEAN OF SQUARES
COMPUTED F
TABULAR F 0.05 0.01
Treatment 7 410.4547 58.6364 5.95** 2.76 4.28
Block 2 17.5991 8.7995
Error 14 137.9343 9.8525
TOTAL 23 565.9881
** - highly significant Coefficient of Variation – 3.25%
Standard Error of the Mean – 1.81
APPENDIX TABLE 2. Plant vigor at 60 days after planting (DAP)
GENOTYPE BLOCK TOTAL MEAN
I II III
Darwin OP 2.00 3.00 4.00 9.00 3.00
Kawitan OP 3.00 4.00 4.00 11.00 3.67
Miracle OP 5.00 5.00 5.00 15.00 5.00
Peke Negro OP 4.00 5.00 4.00 13.00 4.33
Violet OP 5.00 5.00 5.00 15.00 5.00
Wagwag OP 4.00 5.00 5.00 14.00 4.67
Bengueta (check) 5.00 5.00 5.00 15.00 5.00 Kalbo-oy (check) 3.00 4.00 4.00 11.00 3.67 TOTAL 31.00 36.00 36.00 103.00 4.29
ANALYSIS OF VARIANCE
SOURCE OF VARIATION
DEGREES OF FREEDOM
SUM OF SQUARES
MEAN OF SQUARES
COMPUTED F
TABULAR F 0.05 0.01
Treatment 7 12.2917 1.7560 9.52** 2.76 4.28
Block 2 2.0833 1.0417
Error 14 2.5833 0.1845
TOTAL 23 16.9583
** - highly significant Coefficient of Variation – 10.01%
Standard Error of the Mean – 0.2480
APPENDIX TABLE 3. Plant vigor at 90 days after planting (DAP)
GENOTYPE BLOCK TOTAL MEAN
I II III
Darwin OP 3.00 4.00 4.00 11.00 3.67
Kawitan OP 4.00 4.00 4.00 12.00 4.00
Miracle OP 5.00 5.00 5.00 15.00 5.00
Peke Negro OP 5.00 5.00 5.00 15.00 5.00
Violet OP 5.00 5.00 5.00 15.00 5.00
Wagwag OP 5.00 5.00 5.00 15.00 5.00
Bengueta (check) 5.00 5.00 5.00 15.00 5.00 Kalbo-oy (check) 5.00 5.00 4.00 14.00 4.67
TOTAL 37.00 38.00 37.00 112.00 4.67
ANALYSIS OF VARIANCE
SOURCE OF VARIATION
DEGREES OF FREEDOM
SUM OF SQUARES
MEAN OF SQUARES
COMPUTED F
TABULAR F 0.05 0.01
Treatment 7 6.0000 0.8571 9.60** 2.76 4.28
Block 2 0.0833 0.0417
Error 14 1.2500
TOTAL 23 7.3333
** - highly significant Coefficient of Variation – 6.40%
Standard Error of the Mean – 0.1725
APPENDIX TABLE 4. Mature leaf size (cm)
GENOTYPE BLOCK TOTAL MEAN
I II III
Darwin OP 7.83 7.83 9.63 25.29 8.43c
Kawitan OP 8.37 8.63 10.50 27.50 9.17bc Miracle OP 10.00 9.50 11.57 31.07 10.36ab Peke Negro OP 9.77 10.20 9.40 29.37 9.79abc Violet OP 10.13 9.67 10.77 30.57 10.19ab Wagwag OP 9.87 10.93 12.57 33.37 11.12a Bengueta (check) 10.40 8.73 9.73 28.86 9.62bc Kalbo-oy (check) 9.17 8.83 8.90 26.90 8.97bc TOTAL 75.54 74.32 83.07 232.93 9.71
ANALYSIS OF VARIANCE
SOURCE OF VARIATION
DEGREES OF FREEDOM
SUM OF SQUARES
MEAN OF SQUARES
COMPUTED F
TABULAR F 0.05 0.01
Treatment 7 15.4397 2.2057 4.02* 2.76 4.28
Block 2 5.6147 2.8073
Error 14 7.6882 0.5492
TOTAL 23 28.7426
* - significant Coefficient of Variation – 7.64%
Standard Error of the Mean – 0.4278
APPENDIX TABLE 5. Petiole length (cm)
GENOTYPE BLOCK TOTAL MEAN
I II III
Darwin OP 8.60 7.10 8.13 23.83 7.94
Kawitan OP 10.00 8.83 11.77 30.60 10.20 Miracle OP 9.73 10.53 13.90 34.16 11.39 Peke Negro OP 9.67 9.63 9.77 29.07 9.69
Violet OP 11.50 8.27 11.10 30.87 10.29 Wagwag OP 10.86 10.27 11.63 32.76 10.92 Bengueta (check) 11.80 9.90 8.80 30.50 10.17 Kalbo-oy (check) 12.33 13.23 11.53 37.09 12.36 TOTAL 84.49 77.76 86.63 248.88 10.37
ANALYSIS OF VARIANCE
SOURCE OF VARIATION
DEGREES OF FREEDOM
SUM OF SQUARES
MEAN OF SQUARES
COMPUTED F
TABULAR F 0.05 0.01
Treatment 7 35.2117 5.0302 3.04* 2.76 4.28
Block 2 5.3562 2.6781
Error 14 23.1926 1.6566
TOTAL 23 63.7605
* - significant Coefficient of Variation –12.41%
Standard Error of the Mean – 0.7431
APPENDIX TABLE 6. Vine length (cm)
GENOTYPE BLOCK TOTAL MEAN
I II III
Darwin OP 1.96 2.70 2.17 6.83 2.28b
Kawitan OP 2.30 2.10 2.20 6.60 2.20b Miracle OP 2.00 2.33 2.50 6.83 2.28b Peke Negro OP 2.37 2.30 2.50 7.17 2.39b
Violet OP 2.67 2.17 2.63 7.47 2.49b
Wagwag OP 2.43 2.03 2.13 6.59 2.20b
Bengueta (check) Kalbo-oy (check)
3.93 2.63
3.33 2.17
3.80 2.70
11.06 7.50
3.69a 2.50b
TOTAL 20.29 19.13 20.63 60.05 2.50
ANALYSIS OF VARIANCE
SOURCE OF VARIATION
DEGREES OF FREEDOM
SUM OF SQUARES
MEAN OF SQUARES
COMPUTED F
TABULAR F 0.05 0.01
Treatment 7 5.1063 0.7295 11.20** 2.76 4.28
Block 2 0.1546 0.0773
Error 14 0.9122 0.0652
TOTAL 23 6.1732
** - highly significant Coefficient of Variation –10.20%
Standard Error of the Mean – 0.1474
APPENDIX TABLE 7. Vine diameter (mm)
GENOTYPE BLOCK TOTAL MEAN
I II III
Darwin OP 3.00 3.33 4.00 10.33 3.44c
Kawitan OP 3.00 2.00 3.00 8.00 2.67d
Miracle OP 5.00 5.00 5.33 15.33 5.11
Peke Negro OP 3.67 4.00 3.00 10.67 3.56c Violet OP 4.00 4.33 4.00 12.33 4.11bc Wagwag OP 3.67 4.00 4.00 11.67 3.89bc Bengueta (check) 4.33 4.00 4.00 12.33 4.11bc Kalbo-oy (check) 4.33 4.67 4.00 11.67 4.33b TOTAL 31.00 31.33 31.33 93.66 3.90
ANALYSIS OF VARIANCE
SOURCE OF VARIATION
DEGREES OF FREEDOM
SUM OF SQUARES
MEAN OF SQUARES
COMPUTED F
TABULAR F 0.05 0.01
Treatment 7 10.7630 1.5376 9.74** 2.76 4.28
Block 2 0.0091 0.0045
Error 14 2.2110 0.1579
TOTAL 23 12.9831
** - highly significant Coefficient of Variation –10.18%
Standard Error of the Mean – 0.2294
APPENDIX TABLE 8. Number of marketable storage roots (kg)
GENOTYPE BLOCK TOTAL MEAN
I II III
Darwin OP 9.00 11.00 33.00 53.00 17.67 Kawitan OP 19.00 32.00 52.00 103.00 34.33 Miracle OP 54.00 59.00 82.00 195.00 65.00 Peke Negro OP 33.00 45.00 29.00 107.00 35.67 Violet OP 31.00 28.00 53.00 112.00 37.33 Wagwag OP 45.00 42.00 61.00 148.00 49.33 Bengueta (check) 46.00 39.00 41.00 126.00 42.00 Kalbo-oy (check) 34.00 47.00 35.00 116.00 38.67 TOTAL 271.00 303.00 386.00 960.00 40.00
ANALYSIS OF VARIANCE
SOURCE OF VARIATION
DEGREES OF FREEDOM
SUM OF SQUARES
MEAN OF SQUARES
COMPUTED F
TABULAR F 0.05 0.01 Treatment 7 3824.0000 546.2857 5.78** 2.76 4.28
Block 2 880.7500 440.3750
Error 14 1323.2500 94.5179
TOTAL 23 6028.0000
** - highly significant Coefficient of Variation - 24.31%
Standard Error of the Mean – 5.6130
APPENDIX TABLE 9. Weight of marketable storage roots (kg)
GENOTYPE BLOCK TOTAL MEAN
I II III
Darwin OP 0.35 0.50 3.60 4.45 1.48
Kawitan OP 0.95 1.85 3.00 5.80 1.93
Miracle OP 3.20 4.10 7.70 15.00 5.00
Peke Negro OP 3.00 5.10 2.30 10.40 3.47
Violet OP 1.90 2.40 5.15 9.45 3.15
Wagwag OP 2.70 3.95 6.10 12.75 4.25
Bengueta (check) 3.50 2.90 4.60 11.00 3.67 Kalbo-oy (check) 2.95 4.90 2.35 10.20 3.40 TOTAL 18.55 25.70 34.80 79.05 3.29
ANALYSIS OF VARIANCE
SOURCE OF VARIATION
DEGREES OF FREEDOM
SUM OF SQUARES
MEAN OF SQUARES
COMPUTED F
TABULAR F 0.05 0.01 Treatment 7 27.4649 3.9236 2.20ns 2.76 4.28
Block 2 16.5831 8.2916
Error 14 24.9285 1.7806
TOTAL 23 24.9285
ns – not significant Coefficient of Variation – 40.51%
Standard Error of the Mean – 0.77
APPENDIX TABLE 10. Number of non-marketable storage roots (kg)
GENOTYPE BLOCK TOTAL MEAN
I II III
Darwin OP 48.00 45.00 29.00 122.00 40.67 Kawitan OP 54.00 62.00 75.00 191.00 63.67 Miracle OP 76.00 34.00 70.00 180.00 60.00 Peke Negro OP 64.00 30.00 94.00 188.00 62.67 Violet OP 86.00 78.00 85.00 249.00 83.00 Wagwag OP 21.00 44.00 48.00 113.00 37.67 Bengueta (check) 42.00 37.00 47.00 126.00 42.00 Kalbo-oy (check) 31.00 11.00 49.00 91.00 30.33 TOTAL 422.00 341.00 497.00 1260.00 52.50
ANALYSIS OF VARIANCE
SOURCE OF VARIATION
DEGREES OF FREEDOM
SUM OF SQUARES
MEAN OF SQUARES
COMPUTED F
TABULAR F 0.05 0.01 Treatment 7 6528.6667 932.6667 4.04* 2.76 4.28
Block 2 1521.7500 760.8750
Error 14 3229.5833 230.6845
TOTAL 23 11280.0000
* - significant Coefficient of Variation – 28.93%
Standard Error of the Mean – 8.7690
APPENDIX TABLE 11. Weight of non-marketable storage roots (kg)
GENOTYPE BLOCK TOTAL MEAN
I II III
Darwin OP 0.70 1.10 0.95 2.75 0.92
Kawitan OP 0.90 1.00 2.15 4.05 1.35
Miracle OP 0.80 0.80 1.20 2.80 0.93
Peke Negro OP 0.95 0.85 2.45 4.25 1.42
Violet OP 1.25 1.40 1.60 4.25 1.42
Wagwag OP 0.40 1.25 1.15 2.80 0.93
Bengueta (check) 0.70 0.65 0.95 2.30 0.77 Kalbo-oy (check) 0.85 0.25 0.85 1.95 0.65
TOTAL 6.55 7.30 11.30 25.15 1.05
ANALYSIS OF VARIANCE
SOURCE OF VARIATION
DEGREES OF FREEDOM
SUM OF SQUARES
MEAN OF SQUARES
COMPUTED F
TABULAR F 0.05 0.01
Treatment 7 1.9324 0.2761 2.02ns 2.76 4.28
Block 2 1.6302 0.8151
Error 14 1.9148 0.1368
TOTAL 23 5.4774
ns - not significant Coefficient of Variation – 35.29%
Standard Error of the Mean – 0.21
APPENDIX TABLE 12. Storage root yield per plant (kg)
GENOTYPE BLOCK TOTAL MEAN
I II III
Darwin OP 1.05 1.60 4.55 7.20 2.40
Kawitan OP 1.85 2.85 5.15 9.85 3.28
Miracle OP 4.00 4.90 8.90 17.80 5.93
Peke Negro OP 3.95 5.95 4.75 14.65 4.88
Violet OP 3.15 3.80 6.75 13.70 4.57
Wagwag OP 3.10 5.20 7.25 15.55 5.18
Bengueta (check) 4.20 3.55 5.55 13.30 4.43 Kalbo-oy (check) 3.80 5.15 3.20 12.15 4.05 TOTAL 25.10 33.00 46.10 104.20 4.34
ANALYSIS OF VARIANCE
SOURCE OF VARIATION
DEGREES OF FREEDOM
SUM OF SQUARES
MEAN OF SQUARES
COMPUTED F
TABULAR F 0.05 0.01 Treatment 7 25.7083 3.6726 2.52ns 2.76 4.28
Block 2 28.1258 14.0629
Error 14 20.36923 1.4549
TOTAL 23 74.2033
ns – not significant Coefficient of Variation – 27.78%
Standard Error of the Mean – 0.69
APPENDIX TABLE 13. Dry matter content (%)
GENOTYPE BLOCK TOTAL MEAN
I II III
Darwin OP 20.60 19.60 20.50 60.70 20.23 Kawitan Op 34.90 32.80 32.00 99.70 33.23 Miracle OP 20.80 21.10 20.90 62.80 20.93 Peke Negro OP 29.60 28.90 29.30 87.80 29.27 Violet OP 25.90 24.90 25.30 76.10 25.37 Wagwag OP 23.50 22.50 23.80 69.80 23.27 Bengueta (check) 24.10 21.90 21.90 67.90 22.63 Kalbo-oy (check) 27.80 27.60 26.20 81.60 27.20 TOTAL 207.20 199.30 199.90 606.4 25.27
ANALYSIS OF VARIANCE
SOURCE OF VARIATION
DEGREES OF FREEDOM
SUM OF SQUARES
MEAN OF SQUARES
COMPUTED F
TABULAR F 0.05 0.01 Treatment 7 414.7867 59.2552 123.25** 2.76 4.28
Block 2 4.8358 2.4179
Error 14 6.7308 0.4808
TOTAL 23 426.3533
** - highly significant Coefficient of Variation – 2.74%
Standard Error of the Mean – 0.40
APPENDIX TABLE 14. Harvest index
GENOTYPE BLOCK TOTAL MEAN
I II III
Darwin OP 1.02 0.02 1.03 2.07 0.69
Kawitan OP 1.74 1.56 1.61 4.91 1.64
Miracle OP 0.99 0.95 1.03 2.97 0.99
Peke Negro OP 1.05 1.08 1.08 3.21 1.07
Violet OP 1.20 1.17 1.17 3.54 1.18
Wagwag OP 1.09 1.09 1.12 3.30 1.10
Bengueta (check) 0.99 0.88 0.91 2.78 0.93 Kalbo-oy (check) 0.91 0.95 0.89 2.75 0.92
TOTAL 8.99 7.70 8.84 25.53 1.06
ANALYSIS OF VARIANCE
SOURCE OF VARIATION
DEGREES OF FREEDOM
SUM OF SQUARES
MEAN OF SQUARES
COMPUTED F
TABULAR F 0.05 0.01
Treatment 7 1.5860 0.2266 5.47** 2.76 4.28
Block 2 0.1244 0.0622
Error 14 0.5796 0.0414
TOTAL 23 2.2900
** - highly significant Coefficient of Variation – 19.13%
Standard Error of the Mean – 0.12
APPENDIX TABLE 15. Reaction to scab disease at 90 days after planting (DAP)
GENOTYPE BLOCK TOTAL MEAN
I II III
Darwin OP 5.00 2.00 1.00 8.00 2.67
Kawitan OP 1.00 1.00 1.00 3.00 1.00
Miracle OP 1.00 1.00 1.00 3.00 1.00
Peke Negro OP 1.00 1.00 1.00 3.00 1.00
Violet OP 1.00 1.00 1.00 3.00 1.00
Wagwag OP 1.00 1.00 1.00 3.00 1.00
Bengueta (check) 1.00 1.00 1.00 3.00 1.00 Kalbo-oy (check) 1.00 1.00 2.00 4.00 1.33
TOTAL 12.00 9.00 9.00 30.00 1.25
APPENDIX TABLE 16. Reaction to scab disease at 120 days after planting (DAP)
GENOTYPE BLOCK TOTAL MEAN
I II III
Darwin OP 7.00 2.00 1.00 10.00 3.332.67
Kawitan OP 1.00 1.00 1.00 3.00 1.00
Miracle OP 1.00 1.00 1.00 3.00 1.00
Peke Negro OP 1.00 1.00 1.00 3.00 1.00
Violet OP 1.00 1.00 1.00 3.00 1.00
Wagwag OP 1.00 1.00 1.00 3.00 1.00
Bengueta (check) 1.00 1.00 1.00 3.00 1.00 Kalbo-oy (check) 1.00 1.00 5.00 7.00 2.33
TOTAL 14.00 9.00 12.00 35.00 1.46
APPENDIX TABLE 17. Reaction to beetle at 90 days after planting (DAP)
GENOTYPE BLOCK TOTAL MEAN
I II III
Darwin OP 5.00 5.00 5.00 15.00 5.00
Kawitan OP 5.00 5.00 4.00 14.00 4.67
Miracle OP 5.00 5.00 5.00 15.00 5.00
Peke Negro OP 5.00 5.00 5.00 15.00 5.00
Violet OP 5.00 5.00 5.00 15.00 5.00
Wagwag OP 5.00 5.00 5.00 15.00 5.00
Bengueta (check) 5.00 5.00 4.00 14.00 4.67 Kalbo-oy (check) 4.00 5.00 5.00 14.00 4.67 TOTAL 39.00 40.00 38.00 117.00 4.88
APPENDIX TABLE 18. Reaction to beetle at 120 days after planting (DAP)
GENOTYPE BLOCK TOTAL MEAN
I II III
Darwin OP 5.00 5.00 4.00 14.00 4.67
Kawitan OP 4.00 5.00 4.00 13.00 4.33
Miracle OP 5.00 5.00 5.00 15.00 5.00
Peke Negro OP 5.00 5.00 5.00 15.00 5.00
Violet OP 4.00 5.00 4.00 13.00 4.33
Wagwag OP 5.00 5.00 5.00 15.00 5.00
Bengueta (check) 4.00 5.00 3.00 12.00 4.00 Kalbo-oy (check) 4.00 5.00 4.00 13.00 4.33 TOTAL 36.00 40.00 34.00 110.00 4.58