BANGSOYAO, EUNICE K. APRIL 2009. Effect of Inoculation on the Seed Yield of Garden Pea Accessions under Bangao, Buguias, Benguet condition. Benguet State University, La Trinidad Benguet.
Adviser: Danilo P. Padua, Ph.D.
ABSTRACT
These study was conducted to determine the effect of inoculation on the nodulation, growth and seed yield of garden pea; to determine the garden pea accessions that best responds to inoculation; to determine the interaction of inoculation and garden pea accessions; and to determine the profitability of using inoculant on the garden pea accessions under Bangao, Buguias, Benguet condition.
Rhizobium inoculation significantly affected nodule count and seed yield of the garden pea accessions. Among the six garden pea accessions inoculated, CGP 34 significantly outperformed the other accessions in terms of nodule count and CLG, CGP 34 and CGP 13 also produced the highest seed yield per plot. In all the parameters measured no significant interaction effects were observed between inoculation and the garden pea accessions except for the nodule count and total seed yield per plot. In terms of the return on cash expense, inoculation gave the highest return of 11.53%.
INTRODUCTION
There is money in garden pea (Pisum sativum). It is not only a popular vegetable but also commands a high market price which at times exceeds PhP 100 per kilo.
Garden pea, locally known “sweet pea” or “citzaro” is an annual legume grown for its edible pods and matured seeds. In Benguet where the weather is generally cool throughout the year, garden pea is not difficult to grow as this crop generally favor a relatively cool climate and, it yield in about three months (HARRDEC, 1996).
Garden pea is rich in nutritional value and good source of proteins and vitamins.
The fresh green pods contain about 0.3g fat, 57 calorie, 3.3g proteins, 13.0g carbohydrates and 35.0g minerals per 100g edible portion (Purseglove, 1972). The seeds are also processed into canned products while the by products and vines are used as animal feeds (Purseglove, 1972).
Legumes crops can symbiotically fix nitrogen in association with rhizobium. If the legume crop is used as green manure, considerable amounts of N can be supplied to the succeeding crop as the residues decompose (Badaruddin and Meyer, 1990: Welty et al.,1998).
Inoculation is known to have important role in legume production. Inoculation or introducing proper strain of bacteria to legume seeds intended for planting by adding rhizobium will allow the legume to secure nitrogen from the air (Pog-ok, 2001).
Pascua (1996) stated that inoculation increase the nitrogen content and there are benefits derived such as prevention of early starvation, the reduction of demand for soil nitrogen and the improvement of grain and protein yield.
Excessive or improper use of chemical fertilizers may lead to serious environmental problems. Most farmers apply high inputs of synthetic fertilizer to supply nitrogen which has a short term effect. Furthermore, synthetic fertilizers are causing problems to soil and water. Biofertilizers and microbial inoculants are viewed as a plausible alternative to chemical fertilizers as far as sustainable agriculture is concerned (Puyongan 1997). This study will provide information on minimizing inputs and reducing cost.
Inoculation or fertilization plus inoculation may increase N-content , N- accumulation of the leaves and stems, nodule count and vine length, plant height, nitrogen balance in the soil after harvest, dry matter production and pod setting percentage , marketable and non-marketable pods, pod yield and weight of seed of garden pea.
The study was conducted to:
1. determine the effect of rhizobium inoculation on the nodulation, growth and seed yield of garden pea accessions under Bangao, Buguias, Benguet condition;
2. determine the garden pea accessions that best responds to inoculation under Bangao, Buguias, Benguet condition;
3. determine the interaction effect of inoculation and garden pea accessions; and 4. determine the profitability of using inoculatns on the garden pea accessions under Bangao, Buguias, Benguet condition.
This study was conducted at Bangao, Buguias, Benguet Condition from November 2008 to March 2009.
REVIEW OR LITERATURE
Legumes and Rhizobia
Mckey (1994) stated that the ability to fix N2 in association with bacteria actually evolved in legumes in response to the demands of maintaining high leaf N concentration.
Legumes developed N-rich leaves to begin with because the efficiency of photosynthesis increases the tissue N concentration. Beijerinck (1988) stated that pure culture of the bacteria was shown to induce nodule when reinoculated on the same pea plant.
Manguiat et. al (1980) further noted that rhizobial inoculation significantly increased the nodule weight and number during the first cropping but the effect of rhizobial inoculation on nodulation was no longer detected during the succeeding legume crop.
Bishop et.al (1983) explained that the relationship between bacteria and the legume plants is considered a symbiotic one, two organisms living together for their mutual benefit. Legumes provide carbohydrates (food) and water to the bacteria in turn bacteria fixes nitrogen. FAO (1989) reported that inoculation of legumes with rhizobium increase nodulation, nitrogen fixation and yield of the crop. The same report shows that a combination of rhizobium and phosphate-solubilizing bacteria (PSB) substantially increased the yield nitrogen uptake, nodulation and nitrogenous activity in chickpea.
Assimilation of Biologically Fixed Nitrogen
Ludwig (1984) stated that nitrogen derived from N2 fixation in obtained first in the form of ammonia. Generally, this will be protonated to form ammonium (NH4+
) ions, which must be assimilated. This assimilation may be by the N2 fixing organism itself, in
which case the organism can feed directly on N2 and can correctly be termed a diazotroph. In legume symbiotic associations however, the fixed nitrogen is assimilated not by the prokaryotic symbiont but by the host plant. There is considerable evidence indicating that neither rhizobium nor rhizobium species can grow on the products of the N2 fixation, and this strictly they not diazotroph.
The ability of the legume crops to fix atmospheric nitrogen often result in a lower utilization of in organic nitrogen sources in the soil profile as compared to non fixing crops (Jensen, 1989). In this way in organic nitrogen in conserved for the following crop unless it is lost by volatilization, leaching or denitrification.
Nodulation and N2 - Fixation Activity
Nodulation comes about due to the symbiotic association between rhizobium bacteria and the legumes, the atmospheric nitrogen available for rhizobium species to its legumes host which, in turn, provide shelter and food to the bacteria. Nitrogen fixation occurs in root nodules and is mediated by resting cells of rhizobium utilizing a source energy supplied internally through the host (Pearson and Adams, 1976).Nitrogen fixation have high potential benefits to soil and high legume production (Peoples et.at 1989) .
Devlin and Witham (1983) stated that generally the fixation of nitrogen is inhibited by ammonia or nitrate. These compounds do not interfere with the mechanisms of nitrogen fixation, but merely are preferred to molecule as nitrogen source.
Alexander (1977) stated that because fixation serves as a means of obtaining nitrogen required for growth it is surprising that simple inorganic compounds inhibit nitrogen fixation. However, nitrogen depresses the internal carbohydrates supply and has retarding influence on nodulation.
5
Usually when mature nodules begin to lose their bacteriology active period and become old, new ones are formed in new root growth in most of the legumes, particularly in biennial and perennial and even in common bean. However, the ability to form new nodules to replace the old ones highly depends upon the rhizobial genotype and its interaction with the host genotype (Padua,1997).
Rhizobium, upon infection of the appropriate legume can cause the formation of nodules and participate in the symbiotic acquisition of nitrogen. The root nodules are important in nitrogen fixation, their development on the roots determine the survival of the plant particularly at a low level of nitrogen (Alexander, 1997). Moreover, if the proper strain is present and the nodules formed, the legume plants use little soil nitrogen (Chapman and Carter, 1976).
Black (1976) as cited by Ramos (1991) mentioned that root nodules of legumes are of various sizes and shapes, and they differ in effectiveness in fixing nitrogen. The best visual criterion of effectiveness is probably the color. Effective nodules have pink or reddish centers and ineffective nodules have a greenish white center. In addition, there is a tendency for effective nodules to be relatively larger in size, fewer in number in the main roots and ineffective nodules to be relatively small in size, larger in number and scattered on the lateral or secondary roots. Both the effective and ineffective nodules may occur on a single plant. The number per plant may range from none to hundreds.
Effect of Inoculation
Legumes have a good relationship with bacteria fixing atmospheric nitrogen for plant use. The amount of nitrogen fixed by the legumes depends on many factors:
condition of the soil like aeration, drainage, moisture content and amount of chemical
applied to the plants and the soil (Brady, 1985). Talusig (1996) stated that the growth of inoculated snap bean was significantly greater than those of uninoculated plants in terms of nodule count, nodule weight and final pH of the soil. There were significant interaction effect of snap bean and rhizobial strain on the weight of fresh leaves, stems, and roots and on the final pH of the soil. He also stated that the significantly greater nodulation of pole snap bean attribute to fibrous roots that bore more nodules. It is widely claimed that the N content of the plants tissue is significantly increased by inoculation this may also true to garden pea.
Hill (1994) also noted that legumes do not always nodulate when introduced in the soil. Even in soil which rhizobia are present, they may not be effective such as they may not produce much nitrogen. If fully effective, they may not be present in sufficient numbers to promote prompt and adequate nodulation. For these reasons, it had been found necessary for the farmers to introduce the rhizobia to the soil. This is done by seed inoculation when the pasture or crops is grown. Inoculation is desirable when there is doubt about the soil containing the bacteria in abundance. In contrast, the author also mentioned that most growers do not inoculate their seeds. They feel it is simpler to provide the nitrogen for legumes in fertilizer form rather than by inoculation.
Evaluated legumes that was inoculated produced the long vine, also had significantly heavier fresh and dry weight of pods which was not constructed as due to its greater yield potential but merely as a result of its earlier maturity, also has high number of root nodule that attribute to the greater fibrous roots that bore more nodules resulting to positive response to inoculation. It also increase soil pH, soil nitrogen and, plant nitrogen Puyongan (1997). High vigor, ability to withstand stress, diseases and pest, and
7 good marketable yield and desirable qualities in a variety, and that nutrition in health value maybe used to distinguish varieties in the future.
Land Preparation and Planting
A total land area of 180 m2 was prepared two to three weeks before sowing. The area was divided into three blocks. Each block was divided into 12 plots measuring 1m x 5 m. Two to three seeds were sown per hill at a distance of 20 cm between rows and hills.
The treatments were laid-out following the split-plot design with three replications.
The treatments are as follows:
Main plot (Inoculation)
Code Treatment
I1 Uninoculated I2 Inoculated
Subplot (Garden Pea Accessions)
Code Accessions Source
V1 CGP 13 BSU
V2 CGP 59 BSU
V3 CGP 110 BSU
V4 CGP 18A BSU
V5 CGP 34 BSU
V6 CLG (check) BSU
9
Seed Sterilization
Uniform and undamaged seeds were surface sterilized by immersing in (70%) alcohol for 2-3 minutes, then washed 5 times in sterile distilled water, surface sterilized by immersing them in Sodium hypochlorite (25%) for 5 minutes and then washed in sterile distilled water for at least six times (Somasegaran and Hoben, 1994).
Seed Inoculation
Sterilized seeds were mixed thoroughly with the inoculants using direct coating method of inoculation. Seeds were placed in a paper box then sufficient amount of inoculants was added to completely and uniformly coat the seeds. Seeds were spread on clean blotting paper and air dried.
Data Gathered:
1. Plant maturity
a. Number of days from sowing to emergence. This was recorded by counting the number of days from sowing to emergence.
b. Number of days from emergence to first flowering. This was recorded by counting the number of days from emergence to the time when at least 50% of the plants in the plot have fully opened flowers.
c. Number of days to pod setting. This was done by counting the number of days from flowering until the pods were fully developed.
d. Number of days from pod setting to first harvest. This was obtained by counting the number of days from pod setting to first harvest.
2. Nodules
a. Nodule count. This was gathered by counting the numbers of root nodule at 40 DAP.
b. Nodule weight. Plant samples were up rooted and washed carefully to facilitate the removal of the nodules.
1. Nodule fresh weight (g) – the nodule was gathered and weighed
2. Nodule dry weight (g) – nodules was air dried and oven dried at 40 0C before weighing.
3. Nitrogen content of the soil (%). Soils were gathered and brought to the Bureau of soils and water management San Fernando, La Union for the initial and final nitrogen content analysis.
4. Initial and Final pH of the soil. Soils were gathered and soil to the Bureau of soils and water management San Fernando, La Union for soil pH analysis.
5. Reaction to leaf miner and powdery mildew
a. Reaction to leaf miner. The resistance of different varieties of garden pea to leaf miner was rated at the peak of harvesting fresh pods following this rating (Buena, 2004).
Scale Percent infestation Description
1 No damage Highly resistant 2 1-25% of total leaves per plant Mildly resistant and per plot infested
3 25-50% of total leaves per plant Moderately resistant and per plot infested
4 51-75% of total leaves per plant Moderately susceptible and per plot infested
11 5 76-100% of total leaves per plant Very susceptible
and per plot infested
b. Reaction to powdery mildew. This was determined using the following Scale Percent infestation Description
1 No damage Highly resistant 2 1-25% of total leaves per plant mildly resistant
and per plot infested
3 25-50% of total leaves per plant Moderately resistant and per plot infested
4 51-75% of total leaves per plant Moderately susceptible and per plot infested
5 76-100% of total leaves per plant Very susceptible and per plot infested
6. Seed yield
a. Total seed yield per plot (g). This was gathered by getting the total weight of the seeds per plot.
b. Weight of 200 seeds (g). The weight of 200 seeds per treatment was recorded after five days of continuous sun drying.
7. Return On Cash Expense (ROCE). This was computed using the following formula:
Gross sales – Total expenses
ROCE =────────────────── x 100 Total cost of production
Data Analysis
All the quantitative data gathered were subjected to analysis of variance (ANOVA). The significance of difference among means was tested using the Duncan’s Multiple Range Test (DMRT) at 5% level of significance.
RESULTS AND DISCUSSSION
Days from Sowing to Emergence of Garden Pea as affected by Inoculation and Different Accessions
Inoculation. Table 1 shows no significant differences on the number of days from sowing to emergence of garden pea as affected by inoculation. This finding signifies that rhizobium inoculation neither enhances nor delay seed germination or emergence.
Accessions. Analysis revealed that there were highly significant differences on the days from sowing to emergence as affected by the different accessions. Majority of the accessions emerged at 7 days. Only CGP 59 and CGP 34 emerged after one day later.
Results show that the accessions have different response in the days from sowing to emergence.
Interaction Effect. No significant interaction existed between the inoculation and accessions of garden pea on the number of days from sowing to its emergence. This may be due to the same response of the different accessions to inoculation.
Number of Days from Emergence to Flowering
Inoculation. The number of days from emergence to flowering of garden pea as affected by inoculation is shown in Table 1. Analysis revealed that the number of days from emergence to flowering is not affected by inoculation.
Accessions. Analysis revealed marked differences on the days from emergence to first flowering as affected by the different accessions. It was noted that CGP 18A and CGP 13 were the first accessions to produce flowers in 37 days; followed about one week later by Chinese Light Green, CGP 59 and CGP 110, CGP 34 produced flower about two
weeks later. This signifies that different accessions have different characteristics in response of emergence to flowering.
Interaction effect. There were no significant differences on the interaction between the inoculation and accessions of garden pea on the number of days from emergence to first flowering.
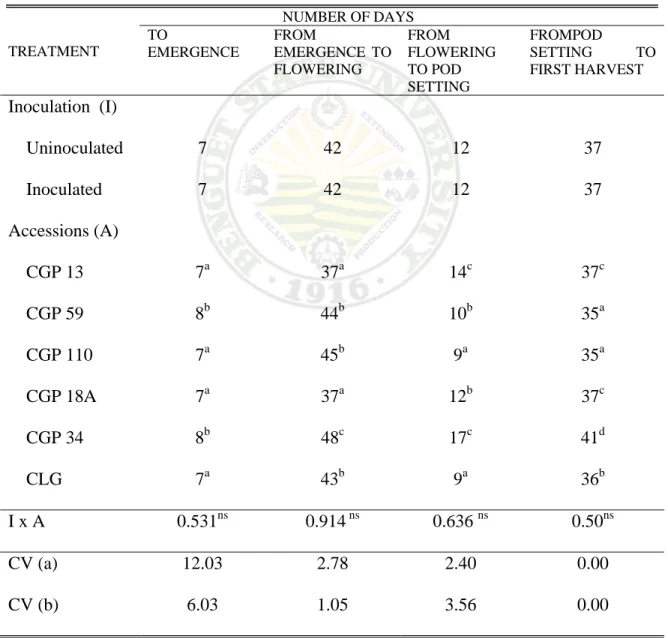
Table 1. Days from sowing to emergence, from emergence to first flowering, from flowering to pod setting, from pod setting to harvesting as affected by inoculation and garden pea accessions
TREATMENT
NUMBER OF DAYS TO
EMERGENCE
FROM
EMERGENCE TO FLOWERING
FROM FLOWERING TO POD SETTING
FROMPOD
SETTING TO FIRST HARVEST
Inoculation (I)
Uninoculated 7 42 12 37
Inoculated 7 42 12 37
Accessions (A)
CGP 13 7a 37a 14c 37c
CGP 59 8b 44b 10b 35a
CGP 110 7a 45b 9a 35a
CGP 18A 7a 37a 12b 37c
CGP 34 8b 48c 17c 41d
CLG 7a 43b 9a 36b
I x A 0.531ns 0.914ns 0.636 ns 0.50ns CV (a)
CV (b)
12.03 6.03
2.78 1.05
2.40 3.56
0.00 0.00
15
Number of Days from Flowering to Pod Setting
Inoculation. Table 1 also shows the number of days from flowering to pod setting of garden pea as affected by inoculation. No appreciable difference between the inoculated and uninoculated garden pea was observed.
Accessions. Differences were noted on the number of days from flowering to pod setting among the different accessions used (Table1 and Fig. 1). Chinese Light Green and CGP 110 produced pods the earliest at 9 days followed by CGP 59 and CGP 18A in 10 days and 12 days, respectively; lastly, CGP 13 and CGP 34 produced pods in 14 days and 17 days, respectively. The significant difference could be the effect of climate adaptation of the different accessions and their genetic characteristics.
Interaction Effect. No significant interaction was noted between inoculation and accessions on the number of days from flowering to emergence of garden pea.
Number of Days from Pod Setting to First Harvest
Inoculation. Table 1 shows no significant difference between inoculated and uninoculated garden peas in terms of the number of days from pod setting to first harvest.
It was noted that both inoculated and uninoculated garden peas were harvested 37 days after pod setting.
Accessions. The same table shows significant differences on the days from pod setting to first harvesting of the garden peas as affected by the different accessions. CGP 59 and CGP 110 were harvested 35 days after pod setting while the other strains were harvested from 37 days to 41 days after pod setting. This result suggests that CGP 59 and CGP 110 were better accessions in terms of pod setting to first harvest.
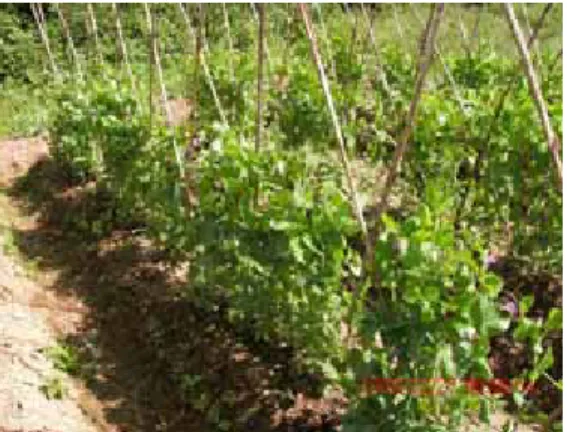
(a) Vegetative stage (b) Flowering stage
(c) Pod development
Figure 1. Plant stand at the different stages growth
17
Interaction effect. No significant interaction effect was noted between inoculant and accessions of garden peas on the number of days from pod setting to first harvest.
Nodule Count
Inoculation. Results revealed that inoculated garden peas significantly produced greater nodule count as compared to uninoculated garden peas (Table 2). This finding signifies that there is a significant effect of inoculation on the nodule count of garden pea.
It was noted that inoculated garden pea produced an average of 165 nodules no. per 5 plant at 40 DAP which is relatively higher than the uninoculated garden pea with a mean of 135 nodules only. Table 2 shows that CGP 34 was the better accession since it had the highest number of nodule which is 168 as compared with the other accessions that had the nodule number of 154 to 137 only.
The result shows that inoculation of garden pea before planting promotes nodulation. This is similar to the findings of Manguiat et al. (1980) and FAO (1989) that rhizobial inoculation significantly increased the nodule count of the legume plant. It also coincides with the statement of Sanchez (1976) that the practice of inoculating seeds with the appropriate rhizobial strain promotes nodulation. It is therefore beneficial to inoculate garden pea seed to ensure production of nodules.
Accessions. Analysis also revealed significant differences on the nodule count of garden pea as affected by the different accessions (Table 2). It was observed that CGP 34 produced the highest number of nodules at 40 DAP with a mean of 168 nodules as compared to the other accessions which produced nodules of only 137 to 144 nodules only.
The result may be attributed to the formation of more fibrous roots of CGP 34 with greater potential of producing more nodules. This confirms with the statement of Alexander (1977) as cited by Ramos (1991) that legumes with fibrous root character frequently have greater nodule count.
Interaction effect. No significant interaction effect between the inoculation and accessions of garden pea on the number of nodule count was observed.
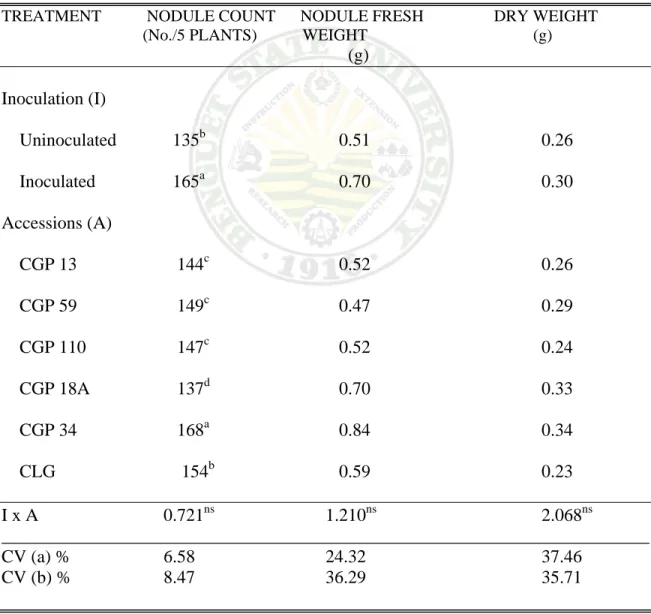
Table 2. Nodule count, nodule fresh weight and nodule dry weight at as affected by inoculation and garden pea accessions.
TREATMENT NODULE COUNT NODULE FRESH DRY WEIGHT (No./5 PLANTS) WEIGHT (g)
(g) Inoculation (I)
Uninoculated 135b 0.51 0.26 Inoculated 165a 0.70 0.30 Accessions (A)
CGP 13 144c 0.52 0.26
CGP 59 149c 0.47 0.29
CGP 110 147c 0.52 0.24 CGP 18A 137d 0.70 0.33 CGP 34 168a 0.84 0.34
CLG 154b 0.59 0.23
I x A 0.721ns 1.210ns 2.068ns
________________________________________________________________________
CV (a) % 6.58 24.32 37.46
CV (b) % 8.47 36.29 35.71
19
Nodule fresh weight
Inoculation. Table 2 shows the number of nodule weight of garden pea as affected by inoculation. Analysis revealed that there were no significant differences on the nodule weight for both inoculated and uninoculated garden pea. However, it was noted that inoculated garden pea produced a greater weight of 0.70 g as compared to uninoculated garden pea which produced a nodule weight of 0.51 g only. The difference on the nodule weight maybe attributed to the higher number and bigger size of nodules produced by inoculated garden pea as compared to uninoculated garden pea.
Accessions. The same table shows no significant differences on the nodule weight of garden pea as affected by the different accessions. It was noted that CGP 34 produced the heaviest nodule fresh weight of 0.84 g. followed by CGP 18A with 0.70 g and Chinese light green with 0.59 g, CGP 59 produced the lightest nodule fresh of 0.47 g only. This may be attributed to the differences on the genetic characteristics of the different accession in terms of nodulation as well as the number of nodules produced by the different varieties (Fig. 3).
Interaction effect. No significant differences were noted on the nodule weight of garden pea as affected by the interaction of inoculation and the different accessions.
Nodule Dry Weight
Inoculation. As shown in Table 2, no significant difference on the dry weight of nodules between the inoculated and uninoculated garden pea. Although inoculated garden pea appear to have produced a higher nodule dry weight of 0.30 g as compared to uninoculated garden pea with 0.26 g only.
(a) CGP 34 Inoculated
(b) CGP 34 Uninoculated
Figure 2. Root nodule at 40 DAP
21
Accessions. The different accessions of garden pea have no significant differences on the nodule dry weight as shown on Table 2. However, numerical data shows that CGP 34 produced the highest nodule dry weight of 0.34 g as compared to the other accessions whose nodule dry weight ranges from 0.23 g to 0.33 g only.
Interaction effect. Analysis revealed no significant differences on the nodule dry weight of garden pea at as affected by the interaction of inoculation and the different accessions. Numerical data indicates that the total weighted mean of the nodule dry weight of the garden pea as affected by inoculation and accessions is 0.28 grams.
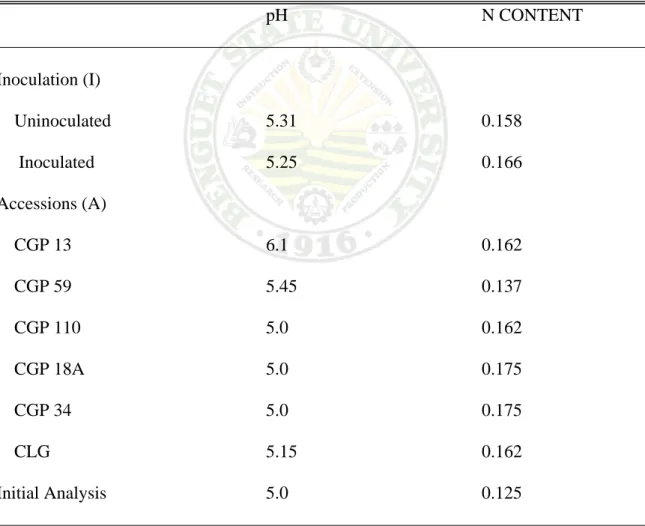
Final soil pH
Inoculation. Table 3 shows the final pH of the soil after harvest. It was noted that both uninoculated and inoculated garden pea have a final pH of 5.30 from the initial pH of 5.0. This indicates that inoculation was not significantly influenced the final pH of the and that any increase in soil pH maybe attributed to other factors.
Accessions. The final pH of the different accessions is shown in Table 3. CGP 13 had the highest final pH (6.10) while the other accessions has pH ranging from 5.00 to 5.45 only. This result shows that CGP 13 is the accession that has the potential to increase soil pH.
Final N Content
Inoculation. The final N-content of uninoculated and inoculated treatment is shown in Table 3. It was observe that inoculated treatment did not have any marked difference with the uninoculated treatment. It was noted through that there was an
increase on the soil nitrogen content after harvest. The inoculant used was able to nodulate the plants but it was not effective in producing much nitrogen.
Accessions. Among the different accessions, it was observed that CGP 34 and CGP 18A had the highest N-content of 0.18 while the least N content of 0.14 was exhibited by CGP 59. It was noted that CGP 34 had the highest number and weight of nodules indicating its greater potential to fix nitrogen. This explains partly why CGP 34 and CGP 18A exhibited relatively higher nitrogen content.
Table 3. Soil pH and soil nitrogen as affected by inoculation and garden pea accessions
pH N CONTENT
Inoculation (I)
Uninoculated 5.31 0.158
Inoculated 5.25 0.166
Accessions (A)
CGP 13 6.1 0.162
CGP 59 5.45 0.137
CGP 110 5.0 0.162
CGP 18A 5.0 0.175
CGP 34 5.0 0.175
CLG 5.15 0.162
Initial Analysis 5.0 0.125
23
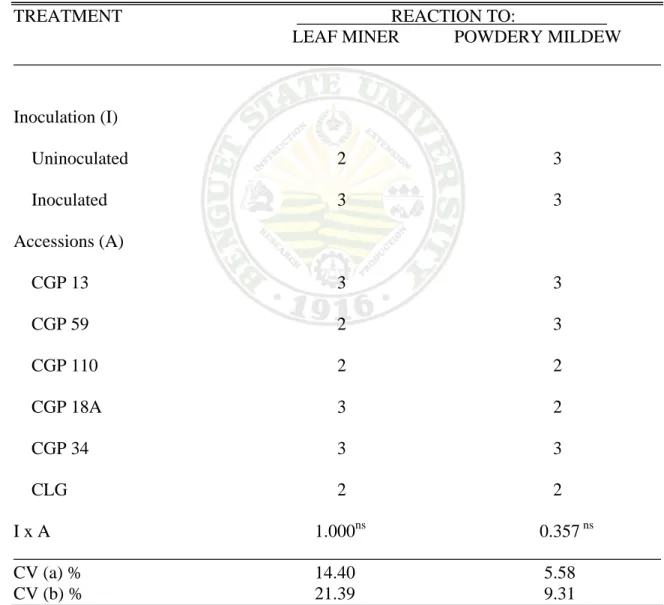
Reaction to Leaf Miner
Inoculation. Table 4 shows the reaction of garden pea to leaf miner as affected by inoculation. Data shows that uninoculated garden pea were mildly resistant to leaf miner while inoculated garden pea was moderately resistant to leaf miner. This implies that inoculation increase the resistance of garden pea to leaf miner.
Table 4. Resistance to leaf miner and powdery mildew as affected by inoculation and garden pea accessions.
TREATMENT REACTION TO:
LEAF MINER POWDERY MILDEW ________________________________________________________________________
Inoculation (I)
Uninoculated 2 3
Inoculated 3 3
Accessions (A)
CGP 13 3 3
CGP 59 2 3
CGP 110 2 2
CGP 18A 3 2
CGP 34 3 3
CLG 2 2
I x A 1.000ns 0.357 ns
________________________________________________________________________
CV (a) % 14.40 5.58 CV (b) % 21.39 9.31
Rating scale: 1- highly resistant, 2 mildly resistant, 3- moderately resistant, 4 moderately susceptible, 5- very susceptible
Accessions. Table 4 shows the reaction of the different garden pea accessions against leaf miner. CGP 13, CGP 18A and CGP 34 were moderately resistant while CGP 59, CGP 110 and CLG were noted to be mildly resistant to leaf miner.
Interaction effect. Did not have significant interaction effects on resistance to leaf miner.
Resistance to Powdery Mildew
Inoculation. Table 4 shows the reaction of garden pea to powdery mildew as affected by inoculation. It was noted that both inoculated and uninoculated garden peas were rated (3) moderately resistant to powdery mildew
Accessions. CGP 13, CGP 59 and CGP 34 were rated moderately resistant to powdery mildew (Table 4). Both CGP 110and CLG were rated mildly resistant together with CGP 18A.
Interaction effect. There were no significant effects of the interaction of inoculation and accessions on the resistance of garden pea to powdery mildew.
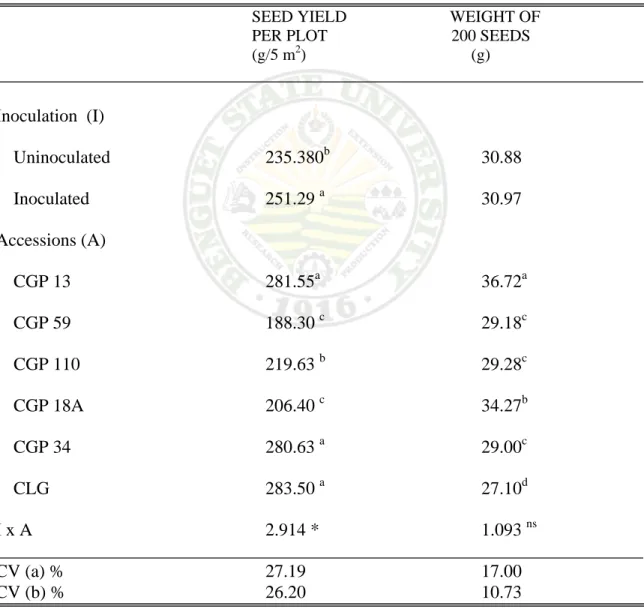
Total Seed Yield per Plot (g)
Inoculation. Table 5 shows that inoculated garden pea produced greater total seed yield per plot with a mean of 251.29 g as compared to uninoculated garden pea with a mean of 235.380 g only. This indicates the benefit that could be derived from inoculation.
Accessions. Analysis revealed significant differences on the total seed yield per plot of garden pea as affected by the different accessions (Table 5). It was noted that Chinese Light Green, CGP 13 and CGP 34 produced the highest total seed yield per plot
25
with means of 383.50 g, 281.55 g and 280.63 g, respectively. This finding signifies that the accessions used have varying potential on seed yield per plot of the garden pea.
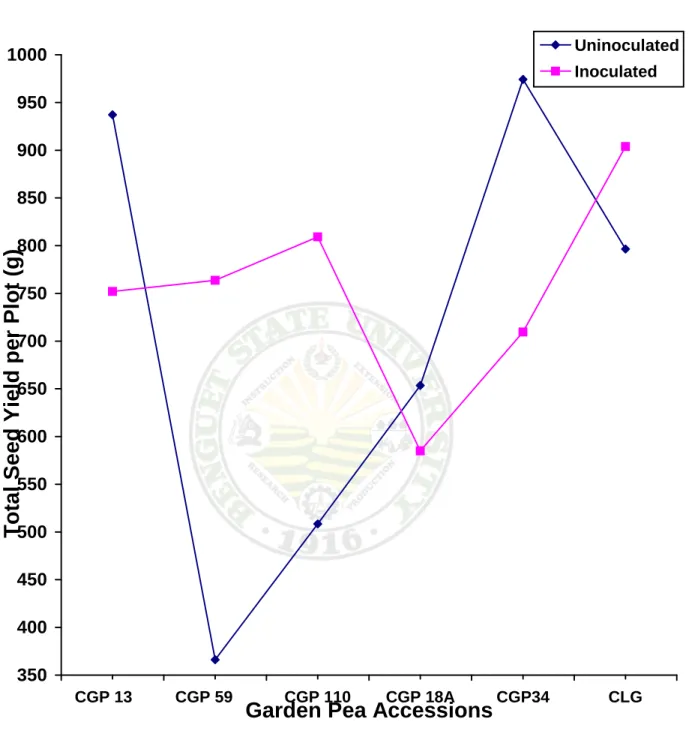
Interaction effect. A significant effect of interaction between inoculation and accession on the total seed yield per plot of garden peas was observed (Fig. 4). It was noted that uninoculated accessions attained both the highest and lowest seed yields while
Table 5. Total seed yield per plot (g) and total weight of 200 seeds per plot as affected by inoculation and garden pea accessions.
SEED YIELD WEIGHT OF PER PLOT 200 SEEDS
(g/5 m2) (g) ________________________________________________________________________
Inoculation (I)
Uninoculated 235.380b 30.88 Inoculated 251.29 a 30.97 Accessions (A)
CGP 13 281.55a 36.72a
CGP 59 188.30 c 29.18c
CGP 110 219.63 b 29.28c CGP 18A 206.40 c 34.27b
CGP 34 280.63 a 29.00c
CLG 283.50 a 27.10d
I x A 2.914 * 1.093 ns
________________________________________________________________________
CV (a) % 27.19 17.00
CV (b) % 26.20 10.73
27
Figure 4. The interaction effect of inoculation and garden pea accessions on the total seed yield per plot.
350 400 450 500 550 600 650 700 750 800 850 900 950 1000
CGP 13 CGP 59 CGP 110 CGP 18A CGP34 CLG
Garden Pea Accessions
Total Seed Yi el d per P lot (g)
Uninoculated Inoculated
the inoculated accessions yielded seeds on the average range. This result does not confirm with the finding on nodule count where CGP 34 had the highest nodule production.
Weight of 200 Seeds (g)
Inoculation. Table 5 shows no significant differences on the weight of 200 seeds of garden pea as affected by inoculation although the inoculated plants produced numerically heavier weight of 200seeds as compared to the uninoculated.
Accessions. Significant differences were noted on the weight of 200 seeds of garden pea as affected by accession (Table 4). Results showed that CGP 13 produced a mean of 36.72 g on the weight of 200 seeds which was relatively higher than the other accessions this signifies that the weight of seeds of garden pea differ from one accession to the other this may due to their seed size. Based on the results, CGP 13 produced the heaviest of 200 seeds due to the bigger size of seed while Chinese light green produced the lightest had the smaller seed size.
Interaction effect. No significant interaction effect between the inoculation and accessions of garden pea in terms of the weight of 200 seed weight.
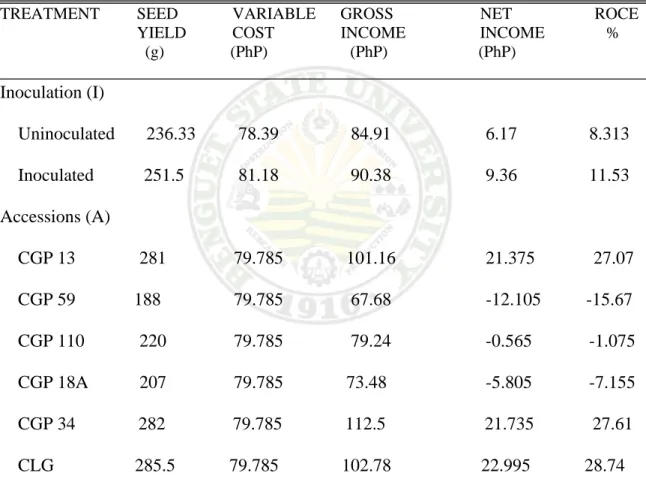
Return on Cash Expense (ROCE)
Inoculation. Table 6 show the result of return on cash expense (ROCE).
Inoculated plants had the greater seed yield of 251g, with the high gross income of PhP 90.38 and a net income of PhP 9.36. Also it was noted that inoculated plants reveal the highest return on cash expense of 11.528%, compared to the uninoculated plants with a 8.313% ROCE. Results show that inoculation of seed increased seed yield of garden pea.
29
Accession. Among the different accessions CLG, CGP 34 and CGP 13 yielded seeds of 285.5 g, 282 g and 281 g respectively. The lowest seed yield was attained from CGP 59 of 188 g seed weight. Also it was noted that the same accessions attain the highest seed weight and highest return on cash expense of 28.74, 27.61 and 27.07. This is due to the high seed yield of production.
Table 6. Return on Cash Expenses of six garden pea accessions as affected by inoculation.
TREATMENT SEED VARIABLE GROSS NET ROCE YIELD COST INCOME INCOME % (g) (PhP) (PhP) (PhP)
________________________________________________________________________
Inoculation (I)
Uninoculated 236.33 78.39 84.91 6.17 8.313 Inoculated 251.5 81.18 90.38 9.36 11.53 Accessions (A)
CGP 13 281 79.785 101.16 21.375 27.07 CGP 59 188 79.785 67.68 -12.105 -15.67 CGP 110 220 79.785 79.24 -0.565 -1.075 CGP 18A 207 79.785 73.48 -5.805 -7.155 CGP 34 282 79.785 112.5 21.735 27.61 CLG 285.5 79.785 102.78 22.995 28.74 Variable costs include labor cost, seeds, pesticide, stick, inoculant and twines.
Selling price were based at PhP 360.00 / kilo
Summary
Effect of Inoculation
The effect of inoculation and six accessions of garden pea were studied under open field condition. The six accessions were CGP 13, CGP 59, CGP 110, CGP 18A, CGP 34 and CLG while the two accessions were inoculated and uninoculated.
Findings revealed that the effect of inoculation on some parameters did not differ significantly. Specifically, analysis revealed that the number of days from sowing to emergence, from emergence to flowering, from flowering to pod setting, from pod setting to first harvesting of garden pea as affected by inoculation were not significantly different from each other.
Also analysis revealed no significant differences on the nodule count, nodule fresh weight and nodule dry weight of nodules for both inoculated and uninoculated garden pea. Soil pH and soil nitrogen generally slightly increased after harvest but differences among the treatments were not substantial.
In terms of leaf miner and powdery mildew reaction of garden pea, inoculation had no significant influences.
Findings also revealed no significant differences on the weight of 200 seeds of garden pea. However, it was noted that there is significant on the total seed yield per plot as affected by inoculation.
32
Effect of Accession
On the days from sowing to emergence majority of the accessions emerged in 7 days except for CGP 59 and CGP 34 which emerged a day later. Almost similar was trend observed on days from emergence to flowering where CGP 18A and CGP 13 were the first to produce flower. On the other hand CLG and CGP 110 produced pods earlier at a days from flowering. From pod setting to harvesting of garden pea seeds, only slight differences were noted.
Significant differences were observed on the nodule count of garden pea as affected by the different accessions with CGP 34 producing the highest number of nodules.
CLG, CGP 13 and CGP 34 appear to produce the highest total seed yield per plot but they were not statistically different from the rest.
For the interaction, majority of the parameters were not significantly different from each other. However, highly significant effect of interaction between inoculation and accession on the total seed yield per plot of garden pea was observed.
Conclusion
Inoculation of seed before planting helps to enhance more nodules and give high seed yield of garden pea. CGP 34, CLG and CGP 13 were the best accessions that respond to inoculation in terms of nodulation and seed yield. Significant interaction observed on the total seed yield per plot. Inoculation noted to have the highest return on cash expenses of 28.72, 27.61 and 27.07.
Recommendation
Based on the results of the study, inoculation is effective under open field condition. Application of proper inoculant to seed before planting is recommended to obtain higher yield.
LITERATURE CITED
ALEXANDER, M. 1977. Introduction to Soil Microbiology. 2nd ed. New York: John Willy and Sons. Inc. Pp. 315-322.
BISHOP, D.D., L.P. CARTER; S. R. CHAMPMAN and W.F BARBETT. 1983. Crop Science and food production. New York: McGraw-Hill Book Co. Pp.39-41
BRADY, N.C. 1985. Nature and Properties of Soils. 8th Ed. New York: McMillan Pub.Co. Pp. 39-41
BUENA C.G. 2004. Seed production of garden pea (Pisum sativum) applied with dolomite and coconut coir dust. BS Thesis. Benguet State University, La Trinidad, Benguet. Pp. 1-2
DEVLIN, R. M. and F.H WITHAM. 1983. Plant Physiology. 4th ed. Boston: Prindle, Weber and Schimidt. Pp. 157-162
HIGHLAND AGRICULTURE RESEARCH DEVELOPMENT CONSORTIUM (HARRDEC) 1996. Highland Garden Pea Techno guide. Benguet State University. La Trinidad, Benguet. Pp. 2,3
HILL, M. S 1994. Inoculation and Coating of Grass and Legumes Seeds. Seed Technology Center (Massey University Palmeston North, New Zealand) 1 (1):2-5 JENSEN. E. S 1989. Role of pea cultivation in the nitrogen economy of soils and
succeeding crops in legumes in farming system (P. Plaquartand R, Hagar, Eds).
Kluwer, Dordrecht. Pp. 3,15
MANGUIAT. T.J. P.M. MENDOZA and S.N. TILO 1985. Influence of the legumes Rhizobia symbiosis on the economy of legumes based cropping system. Phil.
Agric. Jour 6: Pp.44-45
PADUA, D.P. 1997. The role of plant-rhizobial genotypes in biological nitrogen fixation in common bean (Phaseolus vulgaris L.) PhD. Dissertation. University of Gent, Gent Belgium. Pp. 26-27
PASCUA M.D. 1996. Nodulation and nitrogen fixation of two snap bean varieties as affected by different rhizobial strain, BS Thesis. La Trinidad, Benguet. Pp. 11-12, 14-15,38
PUYONGAN B. A. 1997. evaluation of different rhizobial strain for Biological nitrogen fixation ability in two varieties of snap bean.BS Thesis. Benguet State University, La Trinidad, Benguet. Pp. 5, 20, 40,41
RAMOS, R.B. 1991. Compatibility of different rhizobial strains to the three snap bean varieties. BS Thesis. Benguet State University, La Trinidad, Benguet Pp. 5,11 TALUSIG, A. T. 1996. Potential of snap bean entries for biological nitrogen fixation. BS
Thesis. Benguet State University. La Trinidad, Benguet. Pp 4, 27, 40
TIPAYNO, M.T. 2006. Organic characters of five bush snap bean varieties inoculated with BIO N and VITAL N. BS Thesis. Benguet State University. La Trinidad, Benguet. P.4.
APPENDICES
Appendix 1. Days from sowing to emergence
TREATMENT
REPLICATION
I II II TOTAL MEAN
UN INOCULATED
CGP 13 7 7 7 21 7
CGP 59 8 8 8 24 8
CGP 110 7 7 7 21 7
CGP 18A 7 8 7 22 7
CGP34 8 8 8 24 8
CLG 7 7 7 21 7
SUB-TOTAL 44 45 44 133 7
INOCULATED
CGP 13 7 7 7 21 7
CGP 59 8 8 8 24 8
CGP 110 7 7 7 21 7
CGP 18A 7 7 7 21 7
CGP34 8 8 8 24 8
CLG 7 7 7 21 7
SUB-TOTAL 44 44 44 132 7
TOTAL 88 89 88 265 2.44
TWO WAY TABLE TREATMENT GARDEN PEA ACCESSIONS
UNINOCULATED INOCULATED TOTAL MEAN
C GP 13 21 21 42 2.33
CGP 59 24 24 48 2.66
CGP 110 21 21 42 2.33
CGP 18A 21 21 42 2.33
CGP34 24 24 48 2.66
CLG 21 21 42 2.33
TOTAL 132 132 264
MEAN 22 22 2.44
ANALYSIS OF VARIANCE SOURCE OF
VARIATION
DEGREE OF FREEDOM
SUM OF SQUARES
MEAN OF SQUARES
COMPUTED F
TABULATED F
.05 .01 Replication 2 0.889 0.444 0.571ns 19.00 99.00 Main plot (A) 1 0.028 0.028 0.036ns 18.51 98.41
Error (a) 2 1.556 0.778
Sub – plot (B) 5 11.806 2.361 13.281** 2.71 4.10
AxB 5 0.472 0.094 0.531ns 2.71 4.10
Error (b) 20 3.556 0.178
TOTAL 35 18.306
ns – not significant CV (a) = 12.60%
** - highly significant CV (b) = 6.03%
37
Appendix 2. Days from emergence to first flowering.
TREATMENT REPLICATION
I II II TOTAL MEAN
UNINOCULATED
CGP 13 37 37 37 111 37
CGP 59 44 44 44 132 44
CGP 110 45 45 45 135 45
CGP 18A 39 39 38 116 38
CGP34 48 48 48 143 48
CLG 43 42 43 128 43
SUB-TOTAL 256 255 255 765 42.5
INOCULATED
CGP 13 37 37 37 111 37
CGP 59 44 44 44 132 44
CGP 110 45 45 45 135 45
CGP 18A 39 39 39 117 39
CGP34 48 48 48 143 48
CLG 43 42 43 128 43
SUB-TOTAL 256 255 256 766 42.56 TOTAL 512 510 511 1533 14.18
TWO WAY TABLE TREATMENT GARDEN PEA ACCESSIONS
UNINOCULATED INOCULATED TOTAL MEAN
CGP 13 111 111 222 12.34
CGP 59 132 132 264 14.67
CGP 110 135 135 270 15
CGP 18A 116 117 233 12.94
CGP34 143 143 286 15.89
CLG 128 128 256 14.22
TOTAL 765 766 1531
MEAN 42.5 42.56 14.18
ANALYSIS OF VARIANCE SOURCE OF
VARIATION
DEGREE OF FREEDOM
SUM OF SQUARES
MEAN OF SQUARES
COMPUTED F
TABULATED F
.05 .01 Replication 2 0.722 0.361 0.265ns 19.00 99.00 Main plot (A) 1 0.111 0.111 0.082ns 18.51 98.41
Error (a) 2 2.722 1.361
Sub – plot (B) 5 509.889 101.978 524.457** 2.71 4.10
AxB 5 0.889 0.178 0.914ns 2.71 4.10
Error (b) 20 3.889 0.194
TOTAL 35 518.222
ns – not significant CV (a) = 2.78%
** - highly significant CV (b) = 1.05%
39 Appendix 3. Days from flowering to pod setting
TREATMENT REPLICATION
I II III TOTAL MEAN
Uninoculated
CGP 13 13 14 14 41 14
CGP 59 10 10 10 30 10
CGP 110 9 9 10 28 9
CGP 18A 12 12 12 36 12
CGP34 17 17 17 51 17
CLG 9 8 9 26 9
SUB-TOTAL 70 70 72 212 12
INOCULATED
CGP 13 13 14 14 41 14
CGP 59 10 10 10 30 10
CGP 110 9 9 10 28 9
CGP 18A 12 12 12 36 12
CGP34 17 17 17 51 17
CLG 9 8 9 26 9
SUB-TOTAL 70 70 72 212 12
TOTAL 140 140 144 424 4
TWO WAY TABLE TREATMENT GARDEN PEA ACCESSIONS
UNINOCULATED INOCULATED TOTAL MEAN
CGP 13 41 41 82 5
CGP 59 30 30 60 3
CGP 110 28 28 56 3
CGP 18A 36 36 72 4
CGP34 51 51 102 6
CLG 26 26 52 3
TOTAL 212 212 424
MEAN 12 12 4
ANALYSIS OF VARIANCE SOURCE OF
VARIATION
DEGREE OF FREEDOM
SUM OF SQUARES
MEAN OF SQUARES
COMPUTED F
TABULATED F
.05 .01 Replication 2 2.167 1.083 13.00ns 19.00 99.00 Main plot (A) 1 0.250 0.250 3.00ns 18.51 98.41
Error (a) 2 0.167 0.083
Sub – plot (B) 5 287.917 57.583 314.091** 2.71 4.10
AxB 5 0.583 0.117 0.636ns 2.71 4.10
Error (b) 20 3.667 0.183
TOTAL 35 294.750
ns – not significant CV (a) = 2.40%
** - highly significant CV (b) = 3.56%
41 Table 4. Days from pod setting to first harvest
REPLICATION
TREATMENT I II III TOTAL MEAN
UNINOCULATED
CGP 13 37 37 37 111 37
CGP 59 35 35 35 105 35
CGP 110 35 35 35 105 35
CGP 18A 37 37 37 111 37
CGP34 41 41 41 123 41
CLG 36 36 36 108 36
SUB-TOTAL 221 221 221 663 37
INOCULATED
CGP 13 37 37 37 111 37
CGP 59 35 35 35 105 35
CGP 110 35 35 35 105 35
CGP 18A 37 37 37 111 37
CGP34 41 41 41 123 41
CLG 36 36 36 108 36
SUB-TOTAL 221 221 221 663 37
TOTAL 442 442 442 1226 12
TWO WAY TABLE TREATMENT GARDEN PEA ACCESSIONS
UNINOCULATED INOCULATED TOTAL MEAN
CGP 13 111 111 222 12
CGP 59 105 105 210 12
CGP 110 105 105 210 12
CGP 18A 111 111 222 12
CGP34 123 123 246 14
CLG 108 108 116 6
TOTAL 663 663 1226
MEAN 37 37 12
ANALYSIS OF VARIANCE SOURCE OF
VARIATION
DEGREE OF FREEDOM
SUM OF SQUARES
MEAN OF SQUARES
COMPUTED F
TABULATED F
.05 .01 Replication 2 0.167 0.083 3.00ns 19.00 99.00 Main plot (A) 1 0.028 0.028 1.00ns 18.51 98.41
Error (a) 2 0.056 0.028
Sub – plot (B) 5 469.250 93.850 1689.30** 2.71 4.10
AxB 5 0.139 0.028 0.50ns 2.71 4.10
Error (b) 20 1.111 0.056
TOTAL 35 470.750
ns – not significant CV (a) = 0.35%
** - highly significant CV (b) = 0.49%
43 Appendix 5. Nodule count at 40 DAP
TREATMENT
REPLICATION
B I B II B II TOTAL MEAN
UNINOCULATED
CGP 13 132 120 132 384 128
CGP 59 129 137 129 395 131.67
CGP 110 123 134 131 388 139.33
CGP 18A 159 120 114 393 131
CGP34 157 163 136 456 152
CLG 124 139 150 413 137.67
SUB-TOTAL 824 813 792 2429 136.61
INOCULATED
CGP 13 183 155 144 482 160.67
CGP 59 166 165 166 497 165.67
CGP 110 161 169 164 494 164.67
CGP 18A 165 144 122 431 143.67
CGP34 199 185 178 562 187.33
CLG 169 174 169 512 170.67
SUB-TOTAL 1043 992 943 2978 165.45
TOTAL 1867 1805 1735 5407 50.34
TWO WAY TABLE TREATMENT GARDEN PEA ACCESSIONS
UNINOCULATED INOCULATED TOTAL MEAN
CGP 13 384 482 866 48.11
CGP 59 395 497 892 49.56
CGP 110 388 494 882 49
CGP 18A 393 431 824 45.79
CGP34 456 562 1018 56.57
CLG 413 512 925 51.39
TOTAL 24.29 27.78 54.07
MEAN 134.95 165.45 50.35
ANALYSIS OF VARIANCE SOURCE OF
VARIATION
DEGREE OF FREEDOM
SUM OF SQUARES
MEAN OF SQUARES
COMPUTED F
TABULATED F
.05 .01 Replication 2 726.889 363.444 3.734ns 19.00 99.00 Main plot (A) 1 8372.250 8372.250 86.016* 18.51 98.41
Error (a) 2 194.667 97.333
Sub – plot (B) 5 3643.472 728.694 4.511** 2.71 4.10 AxB 5 581.917 116.383 0.721ns 2.71 4.10 Error (b) 20 3230.444 161.522
TOTAL 35 16749.639
ns – not significant CV (a) = 6.58%
** - highly significant CV (b) = 8.47%
* - significant
45 Appendix 6. Nodule fresh weight at 40 DAP
TREATMENT
REPLICATION
I II III TOTAL MEAN
UNINOCULATED
CGP 13 0.43 0.34 0.65 1.42 0.47
CGP 59 0.55 0.46 0.56 1.57 0.52
CGP 110 0.2 0.48 0.56 1.24 0.41
CGP 18A 0.63 0.3 0.43 1.36 0.45
CGP34 0.56 0.95 0.68 2.19 0.73
CLG 0.48 0.45 0.49 1.42 0.47
SUB-TOTAL 2.85 2.98 3.37 9.2 0.16
INOCULATED
CGP 13 0.56 0.64 0.49 1.69 0.56
CGP 59 0.45 0.27 0.51 1.23 0.41
CGP 110 0.52 0.66 0.7 1.88 0.63
CGP 18A 1.58 0.49 0.77 2.84 0.95
CGP34 0.79 1.16 0.91 2.86 0.95
CLG 0.68 0.66 0.78 2.12 0.71
SUB-TOTAL 4.58 3.88 4.16 12.62 0.23
TOTAL 7.43 6.86 7.53 21.82 0.07
TWO WAY TABLE
TREATMENT
GARDEN PEA ACCESSIONS
UNINOCULATED INOCULATED TOTAL MEAN
CGP 13 1.42 1.69 3.11 0.17
CGP 59 1.57 1.23 2.8 0.16
CGP 110 1.24 1.88 3.12 0.17
CGP 18A 1.36 2.84 4.2 0.23
CGP34 2.19 2.86 5.05 0.28
CLG 1.42 2.12 3.54 0.21
TOTAL 9.2 12.62 21.82
MEAN 0.16 0.23 0.07
\
ANALYSIS OF VARIANCE SOURCE OF
VARIATION
DEGREE OF FREEDOM
SUM OF SQUARES
MEAN OF SQUARES
COMPUTED F
TABULATED F
.05 .01 Replication 2 0.022 0.011 0.495ns 19.00 99.00 Main plot (A) 1 0.325 0.325 14.763ns 18.51 98.41
Error (a) 2 0.044 0.022
Sub – plot (B) 5 0.595 0.119 2.429ns 2.71 4.10
AxB 5 0.296 0.059 1.210ns 2.71 4.10
Error (b) 20 0.979 0.049
TOTAL 35 2.261
ns – not significant CV (a) = 24.32%
CV (b) = 36.29%
47 Appendix 7. Nodule dry weight at 40 DAP
TREATMENT
REPLICATION
I II II TOTAL MEAN
UNINOCULATED
CGP 13 0.19 0.2 0.26 0.65 0.22
CGP 59 0.35 0.49 0.24 1.08 0.36
CGP 110 0.12 0.28 0.21 0.61 0.20
CGP 18A 0.28 0.14 0.28 0.7 0.23
CGP34 0.32 0.6 0.2 1.12 0.37
CLG 0.18 0.16 0.2 0.54 0.18
SUB-TOTAL 1.44 1.87 1.39 4.7 0.26
INOCULATED
CGP 13 0.41 0.32 0.16 0.89 0.30
CGP 59 0.28 0.13 0.21 0.65 0.22
CGP 110 0.28 0.3 0.24 0.82 0.27
CGP 18A 0.55 0.28 0.42 1.25 0.42
CGP34 0.23 0.41 0.28 0.92 0.31
CLG 0.26 0.25 0.31 0.82 0.27
SUB-TOTAL 2.01 1.69 1.62 5.35 0.30
TOTAL 3.45 3.56 3.01 10.06 0.09
TWO WAY TABLE
TREATMENT
GARDEN PEA ACCESSIONS
UNINOCULATED INOCULATED TOTAL MEAN
CGP 13 0.65 0.89 1.54 0.09
CGP 59 1.08 0.65 1.73 0.10
CGP 110 0.61 0.82 1.43 0.08
CGP 18A 0.7 1.25 1.96 0.11
CGP34 1.12 0.92 2.04 0.11
CLG 0.54 0.82 1.36 0.08
TOTAL 4.7 5.35 10.06
MEAN 0.26 0.30 0.09
ANALYSIS OF VARIANCE SOURCE OF
VARIATION
DEGREE OF FREEDOM
SUM OF SQUARES
MEAN OF SQUARES
COMPUTED F
TABULATED F
.05 .01 Replication 2 0.015 0.008 0.706ns 19.00 99.00 Main plot (A) 1 0.012 0.012 1.086ns 18.51 98.41
Error (a) 2 0.022 0.011
Sub – plot (B) 5 0.065 0.013 1.264ns 2.71 4.10
AxB 5 0.106 0.210 2.068ns 2.71 4.10
Error (b) 20 0.205 0.010
TOTAL 35 0.425
ns – not significant CV (a) = 37.46%
CV (b) = 35.71%
49
Appendix 8. Resistance to leaf miner
REPLICATION
TREATMENT I II III TOTAL MEAN
UNINOCULATED
CGP 13 3 3 3 9 3
CGP 59 3 3 2 8 2
CGP 110 2 2 3 7 2
CGP 18A 3 3 2 8 3
CGP34 3 3 3 9 3
CLG 2 2 2 6 2
SUB-TOTAL 16 16 15 47 2
INOCULATED
CGP 13 3 3 3 9 3
CGP 59 3 3 2 8 3
CGP 110 2 2 3 7 2
CGP 18A 3 3 2 8 3
CGP34 3 3 3 9 3
CLG 2 2 2 6 2
SUB-TOTAL 16 16 15 47 3
TOTAL 32 32 30 94 1
TWO WAY TABLE
TREATMENT
GARDEN PEA ACCESSIONS
UNINOCULATED INOCULATED TOTAL MEAN
CGP 13 9 9 18 1
CGP 59 8 8 16 0.89
CGP 110 7 7 14 0.78
CGP 18A 8 8 16 0.89
CGP34 9 9 18 1
CLG 6 6 12 0.67
TOTAL 47 47 94
MEAN 2 3 1
ANALYSIS OF VARIANCE SOURCE OF
VARIATION
DEGREE OF FREEDOM
SUM OF SQUARES
MEAN OF SQUARES
COMPUTED F
TABULATED F
.05 .01 Replication 2 0.167 0.083 1.000ns 19.00 99.00 Main plot (A) 1 0.250 0.250 3.000ns 18.51 98.41
Error (a) 2 0.167 0.083
Sub – plot (B) 5 3.583 0.717 3.909* 2.71 4.10
AxB 5 0.917 0.183 1.000ns 2.71 4.10
Error (b) 20 3.667 0.183
TOTAL 35 8.750
ns – not significant CV (a) = 14.40%
* - significant CV (b) = 21.39%
51 Appendix 9. Resistance to powdery mildew
TREATMENT
REPLICATION
I II III TOTAL MEAN
UNINOCULATED
CGP 13 3 3 3 9 3
CGP 59 3 3 3 9 3
CGP 110 2 2 2 6 2
CGP 18A 2 3 2 7 3
CGP34 3 3 3 9 3
CLG 2 2 2 6 2
SUB-TOTAL 15 16 15 46 3
INOCULATED
CGP 13 3 3 3 9 3
CGP 59 3 3 3 9 3
CGP 110 2 2 2 6 2
CGP 18A 2 3 2 7 3
CGP34 3 3 3 9 3
CLG 2 2 2 6 2
SUB-TOTAL 15 16 15 46 3
TOTAL 30 32 30 92 1
TWO WAY TABLE TREATMENT GARDEN PEA ACCESSIONS
UNINOCULATED INOCULATED TOTAL MEAN
CGP 13 9 9 18 9
CGP 59 9 9 18 9
CGP 110 6 6 12 6
CGP 18A 7 7 14 7
CGP34 9 9 18 9
CLG 6 6 12 6
TOTAL 46 46 92
MEAN 3 3 1
ANALYSIS OF VARIANCE SOURCE OF
VARIATION
DEGREE OF FREEDOM
SUM OF SQUARES
MEAN OF SQUARES
COMPUTED F
TABULATED F
.05 .01 Replication 2 0.389 0.194 7.000ns 19.00 99.00 Main plot (A) 1 0.028 0.028 1.000ns 18.51 98.41
Error (a) 2 0.056 0.028
Sub – plot (B) 5 6.806 1.361 17.500** 2.71 4.10
AxB 5 0.139 0.028 0.357ns 2.71 4.10
Error (b) 20 1.553 0.078
TOTAL 35 8.972
ns – not significant CV (a) = 5.58%
** - highly significant CV (b) = 9.31%
53 Appendix 10. Total seed yield per plot (g)
TREATMENT
REPLICATION
I II III TOTAL MEAN
UNINOCULATED
CGP 13 362.8 210 364.4 937.2 312.4 CGP 59 110.2 138.4 117.5 366.1 122.03 CGP 110 189.2 125.8 193.5 508.5 169.5 CGP 18A 218.3 177 258.2 653.5 217.83
CGP34 204.2 289.5 480.6 974.3 324.77
CLG 293 146.2 357.3 796.5 265.5
SUB-TOTAL 1377.7 1086.9 1771.5 4236.1 235.34 INOCULATED
CGP 13 215.7 204.4 332 752.1 250.70 CGP 59 123.7 315.2 324.8 763.7 254.57 CGP 110 288.7 227.6 293 809.3 269.77 CGP 18A 122.5 239.1 223.3 584.9 194.97
CGP34 192.5 223.3 293.7 709.5 236.5
CLG 320.5 217.1 366.2 903.8 301.27
SUB-TOTAL 1263.6 1426.7 1833 4523.3 251.30
TOTAL 2641.3 2513.6 3604.5 8759.4 81.11
TWO WAY TABLE TREATMENT GARDEN PEA ACCESSIONS
UNINOCULATED INOCULATED TOTAL MEAN
CGP 13 937.2 752.1 1689.3 93.85
CGP 59 366.1 763.7 1129.8 62.77
CGP 110 508.5 809.3 1317.8 73.21
CGP 18A 653.5 584.9 1238.4 68.8
CGP34 974.3 709.5 1683.8 93.54
CLG 796.5 903.8 1700.3 94.46
TOTAL 4236.1 4523.3 8759.4
MEAN 235.5 251.30 81.11
ANALYSIS OF VARIANCE
SOURCE OF VARIATION
DEGREE OF FREEDOM
SUM OF SQUARES
MEAN OF SQUARES
COMPUTED F
TABULATED F
.05 .01 Replication 2 59248.767 29624.384 6.767ns 19.00 99.00 Main plot (A) 1 2280.063 2280.063 0.521ns 18.51 98.41
Error (a) 2 8755.382 4377.691
Sub – plot (B) 5 56517.561 11303.512 2.781* 2.71 4.10 AxB 5 59222.766 1184.553 2.914* 2.71 4.10 Error (b) 20 81288.124 4064.406
TOTAL 35 267312.663
ns – not significant CV (a) = 27.19%
* - significant CV (b) = 26.20%
55 Appendix 11. Total weight of 200 seeds (g)
TREATMENT
REPLICATION
I II III TOTAL MEAN
UNINOCULATED
CGP 13 34.9 32.7 36.1 103.7 34.57
CGP 59 25.7 29.7 31.6 87 29
CGP 110 32.3 33.4 24.9 90.6 30.2
CGP 18A 37.00 35.6 35.7 108.3 36.1
CGP34 28.4 28.2 31.4 88 29.33
CLG 28.1 24.2 25.9 78.2 26.07
SUB-TOTAL 186.4 183.8 185.6 555.8 30.88
INOCULATED
CGP 13 46.3 33.00 37.3 116.6 38.87
CGP 59 27.1 28.6 32.4 88.1 29.37
CGP 110 31.4 26.2 27.5 85.1 28.37 CGP 18A 33.4 31.4 32.5 97.3 32.43
CGP34 31.7 25.1 29.2 86 28.67
CLG 37 24.3 23.1 84.4 28.13
SUB-TOTAL 206.9 168.6 182 557.7 30.97
TOTAL 393.3 352.4 367.6 1113.5 10.31
TWO WAY TABLE
TREATMENT
GARDEN PEA ACCESSIONS
UNINOCULATED INOCULATED TOTAL MEAN
CGP 13 103.7 116.6 220.3 12.24
CGP 59 87 88.1 175.1 9.73
CGP 110 90.6 85.1 175.7 9.75
CGP 18A 108.3 97.3 205.6 11.42
CGP34 88 86 174 9.67
CLG 78.2 84.4 162.6 9.03
TOTAL 555.8 557.7 1113.5
MEAN 30.88 30.97 10.31
ANALYSIS OF VARIANCE SOURCE OF
VARIATION
DEGREE OF FREEDOM
SUM OF SQUARES
MEAN OF SQUARES
COMPUTED F
TABULATED F
.05 .01 Replication 2 71.232 35.616 1.289ns 19.00 99.00 Main plot (A) 1 0.080 0.080 0.003ns 18.51 98.41
Error (a) 2 55.274 27.637
Sub – plot (B) 5 412.649 82.530 7.497** 2.71 4.10 AxB 5 60.138 12.028 1.093ns 2.71 4.10 Error (b) 20 220.174 11.009
TOTAL 35 819.548
ns – not significant CV (a) = 17%
** - highly significant CV (b) = 10.73%