TIPAYNO, MELBA T. APRIL 2006. Agronomic Characters of Five Bush Snapbeans Varieties Inoculated with Bio N and Vital N. Benguet State University, La Trinidad, Benguet.
Adviser: Leoncia L. Tandang, PhD
ABSTRACT
Five bush snapbeans varieties were inoculated and observed for their agronomic characters. The study was conducted at Benguet State University-Institute of Plant Breeding Highland Crops Research Station from December 2005 to February 2006.
The study aimed to determine the response of bush snapbeans varieties to different inoculants; to determine which among the inoculants used will give favorable results in bush snapbean production; and to determine the interaction effect between inoculation and variety on the agronomic character of bush snapbean.
Inoculation had no significance effect in all the agronomic characters measured in the study in bush snapbean production. Highly significant differences among the five varieties of bush snapbean evaluated were observed on the number of flowers per cluster, number of pods per plant, pod length and pod width. The number of pods per cluster among the five varieties of bush snapbeans differed significantly. Torrent was significantly the highest ranking variety based on the aforementioned agronomic characters. No significant interaction between inoculations and the variety was noted in all the characters considered except for the number of flower per cluster. BBL 274 got the
on the ROCE, higher profit could be realized by using Bio N as inoculant. Growing Torrent inoculated with Vital N is recommended for profitable bush snapbean production.
Page
Bibliography………. i
Abstract………… ………. . i
Table of Contents ………. iii
INTRODUCTION……… 1
REVIEW OF LITERATURE ……….. 4
MATERIALS AND METHODS……….. 7
RESULTS AND DISCUSSION……… 12
Days to emergence………. 12
Days from planning to flowering……… 12
Number of flower per cluster……… 12
Number of days to pod setting……….. 14
Days from planting to first harvest……… 14
Days from planting to last harvest ……… 16
Numbers of pods per cluster ……… 15
Number of pods per plant ………. 16
Length of pods at harvest ………. 18
Width of pods at harvest ……… 18
Weight of marketable pods ……… 19
Weight of non-marketable pods ……… 20
Total yield per slot ……… 20
Computed yield per hectare……… 22
Reaction to bean rust………... 23
Reaction to pod borer ………. 25
Return to Cash Expense (ROCE) ……… 26
SUMMARY, CONCLUSION AND RECOMMENDATION………. 28
LITERATURE CITED ………. 30
APPENDICES ……….. 32
INTRODUCTION
Snapbean (Phaseolus vulgaris L.) is a common source of plant protein for human diet as well as feed supplement for animals. It is also rich in vitamins and soluble carbohydrates. Snapbean thrives well in cool medium to high altitude in tropical countries. Further, it is one of the farmer’s main sources of income (Pog-ok, 2001).
This crop has the ability to fix nitrogen from the atmosphere through the action of nitrogen -fixing bacteria present in its roots known as Rhizobium. This ability of legumes gives them the advantage over any other crops for enabling to supply themselves partially with nitrogen and helps in the maintenance of soil fertility level (Pog-ok, 2001).
Continuous cultivation of soils due to continuous cropping will deplete its nutrients especially nitrogen. Nitrogen is easily lost through leaching, crop removal, denitrification and volatilization processes. Because of these factors that affect nitrogen loss, most farmers apply nitrogenous fertilizer to cover up losses and increase production.
Some researchers however have shown that continuous and excessive application of nitrogenous fertilizers increases soil acidity, a result that renders most nutrient elements in the soil unavailable for plant use (Piha and Munns, 1987).
Inoculation is known to have important role in legume production. Inoculation or introducing proper strain of bacteria to legume seeds intended for planting by adding Rhizobium will create the legume to secure nitrogen from the air (Pog-ok, 2001).
According to Butler (1955), inoculation should be practiced to hasten the trapping of the atmospheric nitrogen. Inoculation introduces to the plant the bacteria, Rhizobium which is capable of trapping atmospheric nitrogen for plant use at early stage.
The bacteria that multiply and grow on the roots of legumes change the nitrogen in the soil air biochemically into a fixed form attached to the root nodules.
There are many benefits derived from effective inoculation such as the reduction of demand for soil nitrogen, prevention of early nitrogen starvation and improvement of the grain and protein yield (PCCARRD, 1975).
Proper inoculation also improves or maintains fertility of the soil and lessens the need of nitrogen fertilizer. Also, seed inoculation lessens input of production aside from giving possible favorable effects on the fertility of the soil for succeeding crops (PCCARRD, 1975).
The economic and environmental cost of the heavy use of chemical nitrogen fertilizer in agriculture is a global concern. Sustainability mandates that alternatives to nitrogen fertilizers. Nitrogen inputs, through Biological Nitrogen Fixation (BNF) helps reduce fertilizer use and potential or legume varieties will therefore be an important component of sustainable agricultural systems (Atos, 1997).
With the rising world1 population and the declining supply of fossils required to manufacture nitrogen fertilizer, it may be necessary to rely more on microorganisms associated with legume to supply plant need for nitrogen. To satisfy the demand for snap beans, it is time to evaluate the response of common varieties of bean to inoculation to lessen cost of production, waste of time, labor and to increase productivity of the crop (Puyongan, 1997).
The study could help local farmers in selecting snapbean varieties with higher biological nitrogen fixation to promote better profits.
The study was undertaken to determine the response of the bush snapbean varieties to different inoculants; to determine which among the inoculants would give favorable results in bush snapbeans production; to determine the interaction effect between the inoculant and the variety on agronomic characters of bush snapbeans.
The study was conducted at Benguet State University-Institute of Plant Breeding Highland Crops Research Station from October 2005 to March 2006.
REVIEW OF LITERATURE
Inoculation was found to increase nodulation, bacteroid and leghemoglubin contents in the nodules (Kumar, 1976), nodule weight yield (Sali, 1981; Tilo, 1977), bean yield (Tilo, 1977; Nahaul, 1980), percent nitrogen in seed (Sali, 1981) nitrogen uptake by plants (Nahaul, 1980), number of pods per plant, number of seed per pod, and consequently, increased yield (Navarro, 1984). Krootha (1971) reported that inoculation with rhizobium increased the yield and nitrogen content of the legumes at all pH levels.
Legumes and Rhizobium
Legumes are crucial to the balance of nature. They convert nitrogen from the air into ammonia, a soluble form of nitrogen, which is readily utilized by plants. Thus, the nitrogen contributions of legumes can be vital for maintaining soil productivity over long periods. A leguminous crop can add up to 500 kg nitrogen to the soil per hectare a year in association with Rhizobium (NAS, 1979).
Nitrogen fixation occurs within the roots nodules where the symbiotic bacteria rhizobium lives. The active nodules contain a red pigment, like hemoglobin of the blood of higher animals, which is essential to the biochemical phenomenon of nitrogen fixation (Iswaran, 1974).
Merestela (1989) stated that the symbiotic association of Rhizobium and legume to form nitrogen-fixing mechanism is a symbiont selective process in which only certain combination of host Rhizobium pairing characteristics of nodule formation is expressed at the early stage of root initiation process. Moreover, A.W. Faizah, et. al. (1989) explained
that growing legumes in agricultural system reflect their potential capacity to fix large amounts of atmospheric nitrogen and formation of symbiosis between legume and Rhizobium species is dependent on many factors such as calcium level and nitrate content
of the soil.
Manguiat, et. al. (1985) further noted that rhizobial inoculation significantly increase the nodule weight and number during the first cropping but the effect of rhizobial inoculation on nodulation was no longer detected during the succeeding legume crop.
The ability of legume crops to fix atmospheric nitrogen often results in a lower utilization of inorganic nitrogen sources in the soil profile as compared to non-fixing crops. In this way, inorganic nitrogen is conserved for the following crops unless it is lost by volatilization, leaching, or denitrification (Jensen, 1989; Evans, 1991)
As cited by Fiarawan (2001) on her study of rice bean, she noted that in terms of plant height, pod yield and seed yield, there is significant interaction affect between the rhizobial strains and rice bean varieties. The variety inoculated with TAL 899 or TAL 117 produced the best potential for nodulation, nitrogen fixation and yield production.
Inoculation of legume seed is usually recommended in order to obtain the highest rate of fixation.
Amok (2003) found that snapbean plants applied with organic fertilizer performed better than the plants without fertilizer in terms of 100 seed weight, nodule count, fresh and dry weight of leaves and yield performances.
In 1990, Tandang recommended Blue Lake, BSU # 1, Patig, Burik and Alno for commercial production in Cordillera Region and Regions I, II, III and X of the
Philippines. Atos (1987) as cited by Manuel (1997) evaluated the growth and yield performance of five pole snapbean cultivars. Results showed that Stonehill (“Patig”) and Blue Lake, Prime Pak yielded the most.
MATERIALS AND METHODS
An area of 245 m2 was thoroughly prepared and divided into three blocks. Each block contained sixteen plots including border plot with a dimension of 1 x 5 m2. The experiment was laid out following 3 x 5 factor factorial in split plot design with three replications. Three seeds were sown per hill in a double row plot following a distance of 30 cm between hills. Crop protection and other management practices were employed from planting up to last harvesting when necessary.
Treatments: Inoculants were assigned to the main plot as follows:
Main plot (Inoculation)
T1 – no inoculation (control)
T2 – Vital N (Azospirillum – based fertilizer) T3 – Bio-N
Vital N is a wettable powder containing dried new strains of Azospirillum sp., vitamins and minerals. It was developed for seed/seedling inoculation. Azospirillum spp are free-living bacteria growing around roots and reported to fix atmospheric nitrogen, promote plant growth by producing IAA for root proliferation and cytokinins for shoot growth. They can also solubilize soil phosphorous and potassium.
Inoculation and planting. Seeds were moistened with just enough water before inoculation. The seeds and the inoculants were mixed thoroughly until seeds were uniformly coated. Afterwards, seeds were spread on a clean bond paper separately and air dried just before planting.
Snap bean varieties were assigned to the sub-plot as follows:
Sub –plot (Varieties) V1 – Torrent V2 – BBL 274 V3 – HAB 63 V4 – HAB 323 V5 – Landmark
Data gathered
The data gathered were the following:
1. Days to emergence. This was recorded when 75% of the plants per plot have emerged.
2. Days from planting to flowering. This was obtained by counting the number of days from planting up to the time when 50% of the plant per plot started to produce flowers.
3. Number of flower per cluster. This was the number of flower per cluster that was developed per plant. It was taken from three sample clusters per plot.
4. Number of days to pod setting. This was the number of days when 50 % of the flower break up and pod measures one inch long.
5. Days from planting to first harvest. This was recorded by counting the number of days from planting to first harvest.
6. Days from planting to last harvest. This was recorded by counting the number of days from planting to last harvest.
7. Number of pod set per cluster. This was recorded from three sample clusters per plant per plot used in gathering number of flower per cluster.
8. Number of pods per plant. This was gathered using the formula.
Total no. of pods harvested per plot Number of pods per plant =---
Total no. of plants harvested per plot
9. Length of pods at harvest (cm). Ten random sample pods were obtained per treatment and were measured from pedicel end to distal end using a foot ruler.
10. Width of pods at harvest (cm). This was measured from the ten samples used in getting the length of pod from its middle portion using a foot ruler.
11. Weight of marketable pods (kg). This was the weight of marketable pods harvested per plot. Marketable pods are free from disease and insect damage and not deformed.
12. Weight of non-marketable pods per plot (kg). All deformed, undersized, and abnormal pods were discarded and weighed.
13. Total yield per plot (kg). This was the total weight of marketable and non- marketable pods from the first to last harvest per plot.
14. Computed yield per hectare (t). This was obtained by using the data on yield per plot in kg/3m3 x 3.33, which is a factor to be used to convert yield in kg/3m2 to ton per hectare.
15. Number of nodules per plant per treatment. This was the number of nodules per plant per treatment
16. Reaction to Bean Rust. This was recorded using the rating scale by Agayao in 2002 as follows:
Scale Description Remarks
1 No infection High resistance 2 1-2% total plant/plot is
infected
Mild resistance
3 25-5-% of the total
plant/plot is infected
Moderate resistance
4 51-75% of the total
plant/plot is infected
Susceptible
5 76-100% of the total
plant/plot is infected
Very susceptible
17. Reaction to Pod Borer. This was rated using the rating scale used by Agayao in 2002 as follows:
Scale Description Remarks
1 No infestation High resistance 2 1-2% total plant/plot is
infested
Mild resistance
3 25-5-% of the total
plant/plot is infested
Moderate resistance
4 51-75% of the total
plant/plot is infested
Susceptible
5 76-100% of the total
plant/plot is infested
Very susceptible
18. Return on Cash Expense (ROCE). This was obtained using the following formula per plot basis.
Gross sales – Total expense
ROCE =--- X 100
Total Expense
All quantitative data were analyzed using the Analysis of Variance for 3 X 5 factor factorial in Split-plot Design with three replications. The significance of differences among treatment means was tested using DMRT at 95% level of significance.
RESULTS AND DISCUSSION
Days to Emergence
Effect of inoculation. Inoculation did not affect the number of days to emergence.
All treatments emerged eight days after planting (DAP).
Effect of variety. Similarly, all the varieties tested emerged eight DAP.
Interaction effect. No interaction effect between inoculants and varieties on the days to emergence was observed.
Days from Planting to Flowering.
Effect of inoculation. All inoculation treatment induced flowering at 38 DAP.
Effect of variety. All varieties responded similarly as to the days from planting to flowering. Flowering was observed 38 DAP.
Interaction effect. No interaction effect between inoculant and variety on the days to flowering was observed. Inoculation did not affect the number of days to flowering.
Number of Flowers per Cluster.
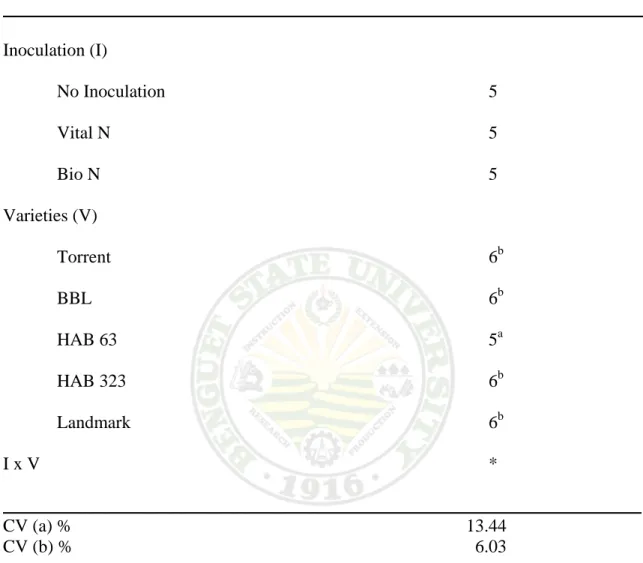
Effect of inoculation. Table 1 shows no significant differences on the number of flowers per cluster among the inoculants used. All inoculated plants had five flowers per cluster.
Table 1. Number of flower per cluster of five bush snapbeans varieties as affected by inoculation.
TREATMENT NO. FLOWERS PER CLUSTER ________________________________________________________________________
Inoculation (I)
No Inoculation 5
Vital N 5
Bio N 5
Varieties (V)
Torrent 6b
BBL 6b
HAB 63 5a
HAB 323 6b
Landmark 6b
I x V *
_______________________________________________________________________
CV (a) % 13.44
CV (b) % 6.03
_______________________________________________________________________
Means within the column, followed by the same letter are not significantly different from each other within a factor at 95% level of significance using DMRT.
Effect of variety. Significant differences were observed on the number of flowers per cluster among the five varieties of bush snapbeans evaluated. Torrent, BBL 274, HAB 323 and Landmark had six flowers per cluster. HAB 63 had significantly fewer flower per cluster (5).
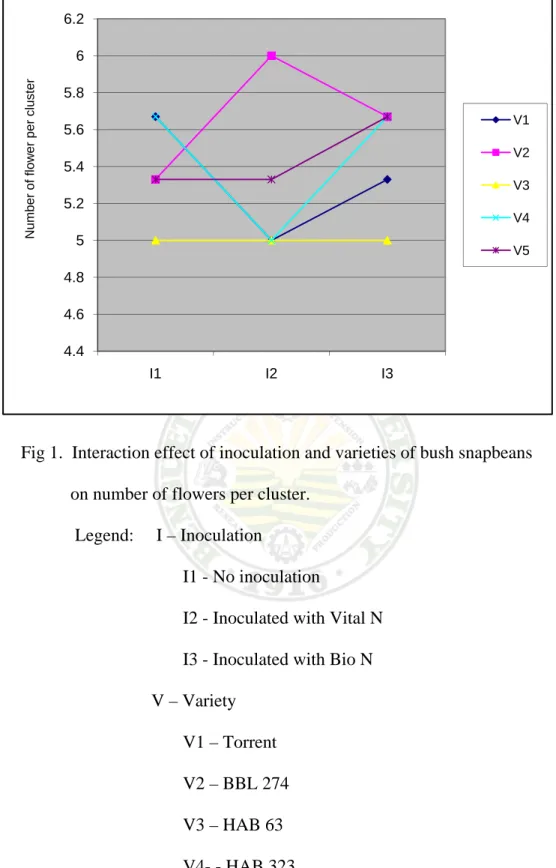
Interaction effect. Different varieties respond differently to different inoculation treatments. Torrent and HAB 323 in uninoculated plots produced the highest number of flowers per cluster, followed by BBL 274 and Landmark. Using Vital N, BBL 274 gave the highest number of flowers per cluster followed by Landmark. HAB 323 and Torrent and HAB 63 had significantly fewer flowers per cluster. Using Bio N, BBL 274, HAB 323 and Landmark similarly had high number of flowers per cluster followed by Torrent.
HAB 63 responded similarly in all the inoculation treatments (Fig 1).
Number of Days to Pod Setting.
Effect of inoculation. All treatments were observed to take 47 DAP to pod setting. Result of statistical analysis indicates that inoculation did not significantly affect the number of days to pod setting in bush snapbeans.
Effect of variety. Similarly, the varieties had 47 DAP to pod setting.
Interaction effect. No interaction effect was observed between inoculant and variety.
Days from Planting to First Harvest
Effect of inoculation. All inoculation treatments were first harvested at 57 DAP.
Effect of variety. All varieties were also first harvested at 57 DAP.
Interaction effect. No interaction effect was observed between inoculant and variety.
Fig 1. Interaction effect of inoculation and varieties of bush snapbeans on number of flowers per cluster.
Legend: I – Inoculation
I1 - No inoculation
I2 - Inoculated with Vital N I3 - Inoculated with Bio N V – Variety
V1 – Torrent
V2 – BBL 274
V3 – HAB 63
V4- - HAB 323
V5 – Landmark
4.4 4.6 4.8 5 5.2 5.4 5.6 5.8 6 6.2
I1 I2 I3
Number of flower per cluster
V1 V2 V3 V4 V5
Days from Planting to Last Harvest
Effect of inoculation. All inoculation treatments were last harvested at 74 DAP.
Effect of variety. Similarly, all the five varieties were last harvested at 74 DAP.
Interaction effect. No interaction effect on days from planting to last harvesting was observed between inoculant and variety.
Number of Pods per Cluster.
Effect of inoculation. No significant differences were observed on the number of pods per cluster.
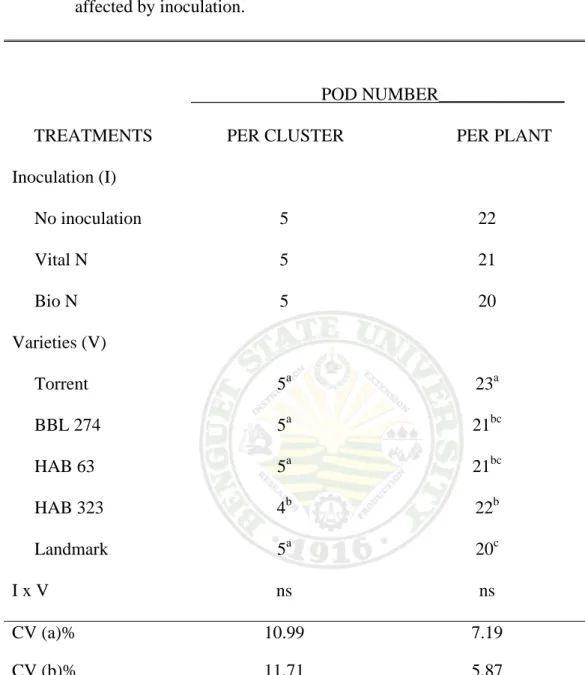
Effect of variety. Torrent, BBL 274, HAB 63 and Landmark had significantly greater number of pods per cluster than HAB 323 that produced the significantly fewer number of pods per cluster (Table 2).
Interaction effect. Statistically, no significant difference was observed between the inoculant and variety on the number of pods per cluster (Table 2).
Number of Pods per Plant.
Effect of inoculation. No significant differences were observed on the number of pods per plant.
Effect of variety. Highly significant differences were observed in the number of pods per plant. Torrent had significantly the highest number of pods per plant than HAB 323, BBL 274 and HAB 63 (Table 2).
Interaction effect. No significant interaction effect was observed between the inoculant and the variety on the number of pods per plant.
Table 2. Number of pods per cluster and per plant of five variety of bush snapbean as affected by inoculation.
Means with common letter are not significance different at 95% level of significance using DMRT.
TREATMENTS
POD NUMBER______________
PER CLUSTER PER PLANT Inoculation (I)
No inoculation 5 22
Vital N 5 21
Bio N 5 20
Varieties (V)
Torrent 5a 23a
BBL 274 5a 21bc
HAB 63 5a 21bc
HAB 323 4b 22b
Landmark 5a 20c
I x V ns ns
CV (a)% 10.99 7.19
CV (b)% 11.71 5.87
Length of Pods at Harvest.
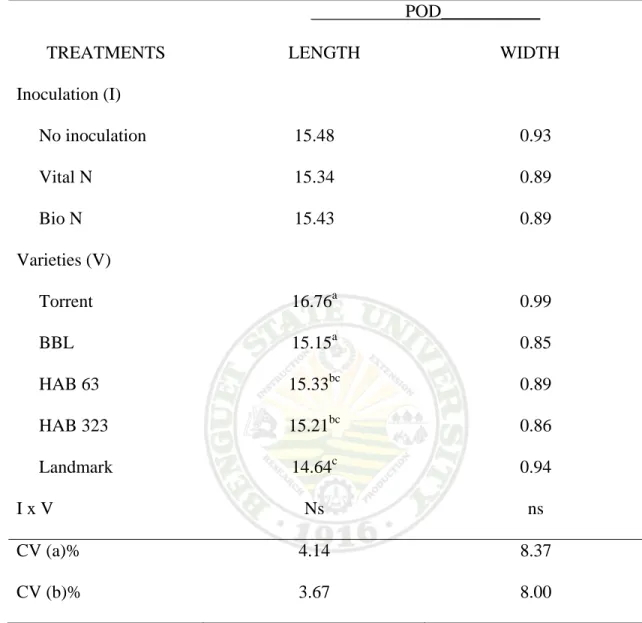
Effect of inoculation. No significant differences were observed among the inoculation treatments on the length of pods. It ranged only from 15.34 to 15.48 cm (Table 3).
Effect of variety. Highly significant differences among the varieties tested were observed on the length of pods (Table 3). Torrent registered the longest pods (16.76 cm), followed by BBL 274 of 15.15 and was comparable to HAB 63 and HAB 323.
Landmark recorded the shortest (14.64 cm).
Interaction effect. No significant interaction was observed among the inoculants and the variety on the length of pods.
Width of Pods at Harvest.
Effect of inoculation. Inoculation had no significant effect on the width of pods of bush snapbeans (Table 3).
Effect of variety. Statistics showed no significant differences on the width of pods among the varieties tested.
Interaction effect. No interaction effect between the inoculant and the variety was observed.
Table 3. Length and width of pods of five varieties of bush snapbeans as affected by Inoculation.
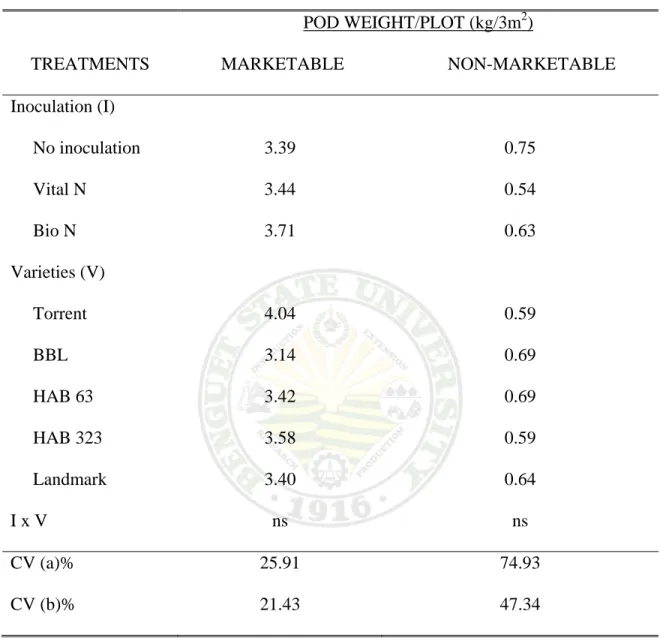
Weight of Marketable Pods
Effect of inoculation. Inoculation did not significantly affect the weight of marketable pods (Table 4).
TREATMENTS
POD___________
LENGTH WIDTH Inoculation (I)
No inoculation 15.48 0.93
Vital N 15.34 0.89
Bio N 15.43 0.89
Varieties (V)
Torrent 16.76a 0.99
BBL 15.15a 0.85
HAB 63 15.33bc 0.89
HAB 323 15.21bc 0.86
Landmark 14.64c 0.94
I x V Ns ns
CV (a)% 4.14 8.37
CV (b)% 3.67 8.00
Effect of variety. No significant differences were observed among the five varieties of bush snapbeans. Torrent was observed to have the highest weight (4.04 kg) and was comparable to HAB 63, HAB 323 and Landmark.
Interaction effect. No significant interaction was observed between the inoculant and the variety.
Weight of Non-marketable Pods
Effect of inoculation. No significant differences were observed among the inoculation treatments on the weight of non-marketable pods. Non marketable yield ranged from 0.54 to 0.75 kg (Table 4)
Effect of variety. Among the varieties, Torrent and HAB 323 gave the least weight of non-marketable pods ranging from 0.59 to 0.69 kg (Table 4).
Interaction effect. No significant interaction effect was noted between the variety and inoculation on the weight of non-marketable pods
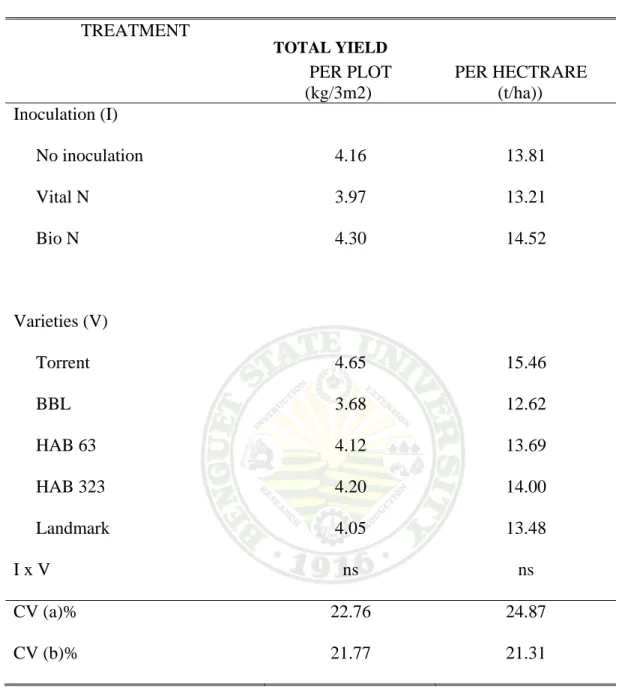
Total Yield per Plot.
Effect of inoculation. There was no significant difference on the total yield per plot (Table 5) ranging from 3.97 to 4.30 kg.
Effect of variety. There was no significant difference on the total yield per plot.
Torrent produced the highest yield of 4.65 and BBL 274 produced the lowest (Table5).
Interaction effect. No significant interaction effect was noted between the variety and inoculant on the total yield per plot.
Table 4. Weight of marketable pods per plot of five variety of bush snapbean as affected By inoculation
Computed Yield per Hectare.
Effect of inoculation. No significant differences were observed among the inoculation treatments ranging from 13.21 to 14.52 t/ha (Table 5).
TREATMENTS
POD WEIGHT/PLOT (kg/3m2)
MARKETABLE NON-MARKETABLE Inoculation (I)
No inoculation 3.39 0.75
Vital N 3.44 0.54
Bio N 3.71 0.63
Varieties (V)
Torrent 4.04 0.59
BBL 3.14 0.69
HAB 63 3.42 0.69
HAB 323 3.58 0.59
Landmark 3.40 0.64
I x V ns ns
CV (a)% 25.91 74.93
CV (b)% 21.43 47.34
Effect of variety. Among the varieties, Torrent gave the highest yield per hectare of 15.46 t/ha. It was followed by HAB 323. However, no significant differences were noted among the five varieties evaluated (Table 5).
Interaction effect. No significant interaction effect between inoculation and the variety of bush snapbean was noted on computed yield per hectare (Table 5).
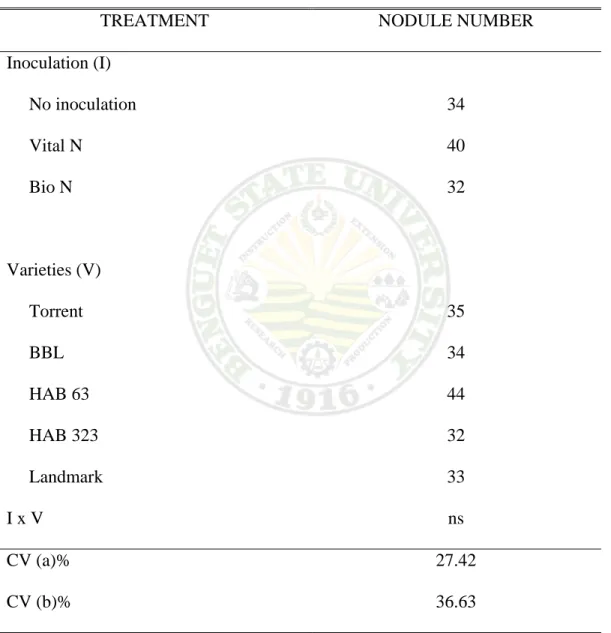
Nodules per Plant per Treatment.
Nodulation was assessed at 40 DAP. The number of nodules that were formed in the roots of the two sample plants was counted separately per treatment.
Effect of inoculation. No significant differences among the three treatments were noted on the number of nodules per plant (Table 6). Inoculation did not significantly induce nodulation in bush snapbean. However, numerically, Vital N inoculated plants registered the highest number of nodules per treatment.
Effect of variety. Result showed that there was no significant difference on the nodule score among the varieties used. The number of nodules per plant among the varieties, ranged from 32 to 44 (Table 6).
Interaction effect. No significant interaction effect was noted between the inoculant and the variety on the number of nodules per plant.
The presence of nodules in uninoculated plots indicates the presence of native strains, which might have been introduced by the cultivation of snapbeans in the area.
Continuous cultivation might have allowed population build up of the native strains.
Table 5. Total yield per plot and computed yield per hectare.
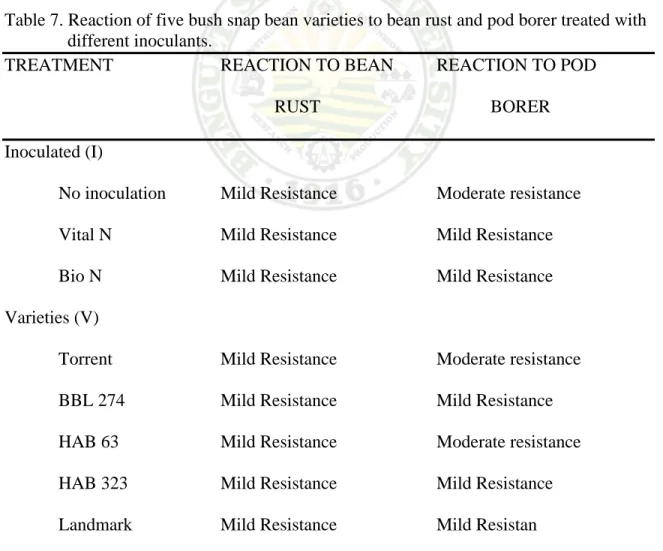
Reaction to Bean Rust
Effect of Inoculation. Regardless of inoculation, all treatments and varieties tested exhibited mild resistance to bean rust (Table 7).
Effect of variety. All the varieties tested exhibited mild resistance to bean rust.
TREATMENT
TOTAL YIELD
PER PLOT PER HECTRARE (kg/3m2) (t/ha)) Inoculation (I)
No inoculation 4.16 13.81
Vital N 3.97 13.21
Bio N 4.30 14.52
Varieties (V)
Torrent 4.65 15.46
BBL 3.68 12.62
HAB 63 4.12 13.69
HAB 323 4.20 14.00
Landmark 4.05 13.48
I x V ns ns
CV (a)% 22.76 24.87
CV (b)% 21.77 21.31
Interaction effect. No significant interaction between the inoculant and the variety.
Table 6. Number of nodules per plant of five variety of bush snapbean as affected by inoculation
TREATMENT NODULE NUMBER
Inoculation (I)
No inoculation 34
Vital N 40
Bio N 32
Varieties (V)
Torrent 35
BBL 34
HAB 63 44
HAB 323 32
Landmark 33
I x V ns
CV (a)% 27.42
CV (b)% 36.63
Reaction to Pod borer
Visual rating for the resistance to pod borer among the five varieties of bush snap bean was done.
Effect of Inoculation. Mild resistance was visibly observed on the inoculated plots, while in the control, it was observed to exhibit moderate resistance (Table 7).
Effect of variety. BBL 274, HAB 323 and Landmark were mildly resistant, Torrent and HAB 63 were moderately resistant (Table 7).
Interaction effect. No interaction effect was observed between the variety and the inoculant.
Table 7. Reaction of five bush snap bean varieties to bean rust and pod borer treated with different inoculants.
TREATMENT REACTION TO BEAN REACTION TO POD
RUST BORER
Inoculated (I)
No inoculation Mild Resistance Moderate resistance Vital N Mild Resistance Mild Resistance Bio N Mild Resistance Mild Resistance Varieties (V)
Torrent Mild Resistance Moderate resistance BBL 274 Mild Resistance Mild Resistance HAB 63 Mild Resistance Moderate resistance HAB 323 Mild Resistance Mild Resistance Landmark Mild Resistance Mild Resistan
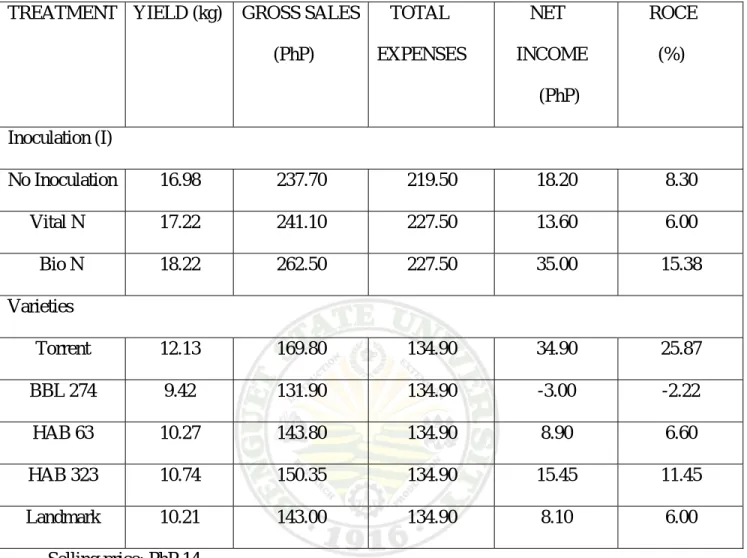
Return on cash expense (ROCE)
Effect of inoculation. Among the inoculation treatments, Bio N had the highest economic return (15.38%).
Effect of variety. Torrent showed the highest return on cash expense (25.87%) followed by HAB 323 (Table 8).
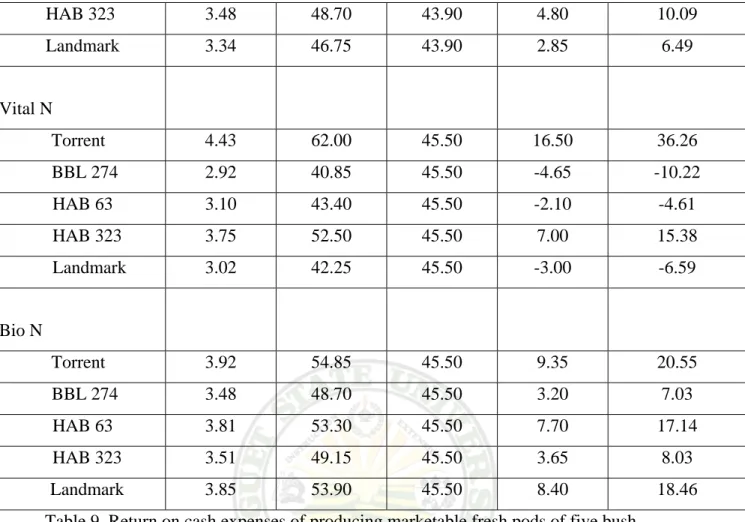
Interaction effect. Based on treatment combination, Torrent inoculated with Vital N registered the highest return on cash expense (Table 8).
Table 8. Return on cash expenses of producing marketable fresh pods of five bush snapbeans varieties as affected inoculation.
Selling price: PhP 14
Total; expenses include labor, fertilizers, seeds and inoculants TREATMENT YIELD (kg) GROSS SALES
(PhP)
TOTAL EXPENSES
NET INCOME (PhP)
ROCE (%)
Inoculation (I)
No Inoculation 16.98 237.70 219.50 18.20 8.30
Vital N 17.22 241.10 227.50 13.60 6.00
Bio N 18.22 262.50 227.50 35.00 15.38
Varieties
Torrent 12.13 169.80 134.90 34.90 25.87
BBL 274 9.42 131.90 134.90 -3.00 -2.22
HAB 63 10.27 143.80 134.90 8.90 6.60
HAB 323 10.74 150.35 134.90 15.45 11.45
Landmark 10.21 143.00 134.90 8.10 6.00
TREATMENT YIELD (kg) GROSS SALES (PhP)
TOTAL EXPENSES
NET INCOME (PhP)
ROCE (%) Control
Torrent 3.78 52.90 43.90 9.00 20.50
BBL 274 3.02 42.25 43.90 -1.65 -3.75
HAB 63 3.36 47.00 43.90 3.10 7.06
Table 9. Return on cash expenses of producing marketable fresh pods of five bush snapbean as affected inoculation.
Selling price: Php 14
Total expenses include labor, fertilizers, seeds, and inoculants
HAB 323 3.48 48.70 43.90 4.80 10.09
Landmark 3.34 46.75 43.90 2.85 6.49
Vital N
Torrent 4.43 62.00 45.50 16.50 36.26
BBL 274 2.92 40.85 45.50 -4.65 -10.22
HAB 63 3.10 43.40 45.50 -2.10 -4.61
HAB 323 3.75 52.50 45.50 7.00 15.38
Landmark 3.02 42.25 45.50 -3.00 -6.59
Bio N
Torrent 3.92 54.85 45.50 9.35 20.55
BBL 274 3.48 48.70 45.50 3.20 7.03
HAB 63 3.81 53.30 45.50 7.70 17.14
HAB 323 3.51 49.15 45.50 3.65 8.03
Landmark 3.85 53.90 45.50 8.40 18.46
SUMMARY, CONCLUSION AND RECOMMENDATION
Summary
This study aimed to determine the response of five bush snapbean varieties to different inoculants, to determine which among the inoculants used will give favorable results in bush snapbean production and to determine the interaction effect between inoculation and the variety on the agronomic characters of bush snapbeans, and to evaluate the economic importance of inoculation in bush snapbean production. This was conducted from December 2005 to February 2006 at Benguet State University-Institute for Plant Breeding Highland Crop Research Station.
Inoculation had no significant effect in all the agronomic characters measured in this study in bush snapbean production. Highly significant differences among the five varieties of bush snapbean evaluated were observed on the number of flowers per cluster, number of pods per plant, pod length and pod width. The number of pods per cluster among the five varieties of bush snapbeans differed significantly. Torrent was significantly the highest ranking variety based on the aforementioned agronomic characters. No significant interaction between inoculation and the variety was noted in all the characters considered except for the number of flowers per cluster. BBL 274 got the significantly highest number of flowers per cluster when inoculated with Vital N. Based on the ROCE, higher profit could be realized by using Bio N as inoculant. Growing Torrent inoculated with Vital N was the best among the treatment combinations in terms of yield and ROCE.
Conclusion
The agronomic characters of bush snapbean were not significantly affected by inoculation. Inoculation of Bio N gave higher return on cash expense (15.38%) than Vital N and the control.
The five varieties of bush snapbeans significantly differed only in number of flowers per cluster, number of pods per cluster, number of pods per plant, pod length and pod width. Among the varieties studied based on agronomic characters measured, Torrent was the significantly highest and also exhibited the highest ROCE (25.87%).
Among the treatment combinations tested, Torrent inoculated with Bio N, Vital N and uninoculated recorded the highest ROCE. More than 20% ROCE could be realized by growing Torrent without inoculation and with Bio N inoculation. However, growing Vital N inoculated Torrent resulted in higher ROCE of more than 36%.
.
Recommendation
Based on return on cash expense (ROCE), Bio N can be recommended because it gave the highest economic return among the inoculants used. Among the varieties tested, Torrent can be recommended as commercial variety because it registered the highest profit and performed well in La Trinidad, Benguet. The treatment combination of Vital N and Torrent is highly recommended for pod production to get higher ROCE.
LITERATURE CITED
AGAYAO, M. 2002. Seeds production of bush beans in a farmer’s field as affected by different organic fertilizers. BS Thesis. BSU, La Trinidad, Benguet. Pp.10-11.
AMOK, M. 2003. Nodulation and seed yield of new varieties of snapbean as influenced by organic fertilizer. BS Thesis.BSU, La Trinidad, Benguet. Pp.15, 17, 27-28.
ATOS, C. 1997. Growth and yield performance of five bean cultivars. BS Thesis.BSU, La Trinidad, Benguet. P.5.
BUTLER, E .J. 1955. Plant Pathology. The Lowa State College Press, Inc. Pp.16-17.
EVANS, J. 1991. Wheat response after temperate crop legumes in South Eastern Australia. Australian Journal of Agricultural Research. Pp. 43, 155-156.
FAIZAH, A. W., B.I. RERKASEM and D. F. HERRIDGE. 1989. Methods for evaluating nitrogen fixation by nodulated legumes in the field. Peoples, M.B. ACIAR.
Pp. 2-7.
FIARAWAN, K. 2001. Nodulation of rice bean (Vigna umbellata) under La Trinidad condition. BS Thesis.BSU, La Trinidad,. Benguet. P21.
ISWARAN, V. 1973. Inoculate grain legumes with Rhizobium for higher yields. Sci., 14 (1): 13 -14.
JENSEN, E.S. 1989. The roll of pea cultivation in the nitrogen economy of soils and succeeding crops. In Legumes in Farming Systems. Pp. 3-15.
KROOTAH, P. 1971. Effect on pH on the growth of rhizobia and N fixation in some Rhizobium – legume association. MS Thesis. University of the Philippines. Los Baños, Laguna. P. 93
KUMAR, S. 1976. Response of different genotypes of soybean to inoculation with various composite cultures of Rhizobium japonicum. Panthagar J. Res. 1(1): 30- 32.
MANGUIAT, T.J., D.M., MENDOSA, and S.M. TILO 1985. Influence of Legume Rhizobia Symbiosis on the Nitrogen Economy of a Legume based on a cropping system. Phils. J. 68 (7) 36-38.
MANUEL, R. S. 1997. Response of bush snapbean cv. Bush Blue Lake 274 to the frequency of nitrogen fertlizer application during vegetative growth. BS Thesis.
Benguet State University, La Trinidad, Benguet. Department of Crop Science.
MERESTELA, T. M. 1989. Symbiotic nitrogen fixation in some cultivated legumes in the Philippine. PhD. Dissertation. University of Tokyo, Japan. P. 119.
MERESTELA, T., Y. MARUYAMA, E. DAYAP, R. RAMOS and D. PADUA 1993.
Host cultivar and rhizobial strain interaction effects on N2 – fixation in pole beans. (Phaseolus vulgaris L.) Benguet State University. Grad. School Res. J. Pp.
25-33.
NAHAUL, C. H. 1980. Effect of inoculation and different rates of lime on the growth and yield of Baguio Bean. BS Thesis. MSAC, La Trinidad, Benguet. P. 53.
NATIONAL ACADEMY OF SCIENCE. 1979. Tropical Legume Resources for the Future. Washington, D. C. US Government Printing Office. Pp. 5-6.
NAVARRO, L. D. 1984. Response of inoculation and tillage practices. MS Thesis.
Mountain State Agricultural College, La Trinidad, Benguet. P. 81.
PCARRD, 1975. The Philippine Recommends for Vegetables Los Baños, Laguna.
University of the Philippines, College of Agriculture p. 13.
PIHA, M. I. and D. N. MUNNS. 1987. Nitrogen fixation potentials of beans compared with other grain legumes under controlled conditions. Plant and soil. Pp. 98, 168- 182.
POG-OK, J. F. 2001. On farm evaluation of potential varieties of pole snapbean at Pico, La Trinidad, Benguet.BS Thesis. BSU, La Trinidad, Benguet. P. 1.
PUYONGAN, A. 1997. Evaluation of different rhizobial strains for biological nitrogen fixation ability in two varieties of snapbeans. (Phaseolus vulgaris L.) , BS Thesis.
Benguet State University, La Trinidad, Benguet.
SALI, H. 1981. The effect of level of CaCO3, inoculation beans, lime and phosphorous on the growth and nodulation of ipil-ipil cultivars in three soils. Abstract Bibliography of Forage, Pasture and Grassland Researches. P. 26.
TANDANG, L. L. 1990. Promising varieties if snapbean in the highlands. A paper presented during the highlights at Regional Science Development Center. BSU, La Trinidad, Benguet.
TILO, S. N. 1977. Effects of inoculation, lime and phosphorous on the growth of ipl-ipil cultivars in three soils. Abstract Bibliography of Forage, Pasture and Grassland Researches. P. 26.
APPENDICES Appendix Table 1. Number of flowers per cluster
TREATMENT BLOCK
I II III TOTAL MEAN
No inoculation
Torrent 6 5 6 17.00 5.67
BBL 274 5 5 6 16.00 5.67
HAB 63 5 5 5 15.00 5.00
HAB 323 6 5 6 17.00 5.67
Landmark 5 5 6 16.00 5.33
Vital N
Torrent 5 5 5 15.00 5.00
BBL 274 6 6 6 18.00 6.00
HAB 63 5 5 5 15.00 5.00
HAB 323 5 5 5 15.00 5.00
Landmark 5 6 5 16.00 5.33
Bio N
Torrent 6 5 5 16.00 5.33
BBL 274 6 5 6 17.00 5.67
HAB 63 5 5 5 15.00 5.00
HAB 323 6 5 6 17.00 5.67
Landmark 6 5 6 17.00 5.67
I x V TWO-WAY TABLE
INOCULANTS VARIETIES
TOR BBL 63 323 LND TOTAL MEAN Control 5.67 5.33 5.00 5.67 5.33 27 5.4
Vital N 5.00 6.00 5.00 5.00 5.33 26.33 5.27
Bio N 5.33 5.67 5.00 5.67 5.67 27.34 5.47
TOTAL 16 17 15 16.34 16.33
MEAN 5.33 5.67 5.00 5.45 5.44
ANALYSIS OF VARIANCE SOURCE OF
VARIATION
DEGREES OF FREEDOM
SUM OF SQUARES
MEAN SQUARE
COMPUTED F
TABULAR F _____________
0.05 0.01
Replication 2 1.377 0.688
Factor A 2 0.311 0.155 0.30ns 6.94 18.00
Error (a) 4 2.088 0.522
Factor B 4 2.133 0.533 5.05** 2.78 4.22
AB 8 21.33 0.266 2.53* 2.36 3.36
Error (b) 24 2.533 0.105
TOTAL 44 10.577
**-highly significant
*-significant ns-non-significant
Coefficient of variation (a) = 13.44%
Appendix Table 1. Number of pods per cluster
TREATMENT BLOCK
I II III TOTAL MEAN
No inoculation
Torrent 6 6 5 17.00 5.67
BBL 274 4 5 5 14.00 4.67
HAB 63 5 5 6 16.00 5.33
HAB 323 4 4 5 13.00 4.33
Landmark 5 5 4 14.00 4.67
Vital N
Torrent 6 5 5 16.00 5.33
BBL 274 5 4 4 13.00 4.33
HAB 63 5 5 5 15.00 5.00
HAB 323 4 5 5 14.00 4.67
Landmark 5 4 5 14.00 4.67
Bio N
Torrent 5 5 5 15.00 5.00
BBL 274 4 6 6 15.00 5.00
HAB 63 5 5 5 16.00 5.33
HAB 323 4 4 5 13.00 4.33
Landmark 5 5 5 15.00 5.00
I x V TWO-WAY TABLE
INOCULANTS VARIETIES
TOR BBL 63 323 LND TOTAL MEAN Control 5.67 4.67 5.33 4.33 4.67 24.67 4.93
Vital N 5.33 4.33 5.00 4.67 4.67 24.00 4.80
Bio N 5.00 5.00 5.33 4.33 5.00 24.66 4.93
TOTAL 16 14 15.66 13.33 14.34
MEAN 5.33 4.67 5.22 4.44 4.78
ANALYSIS OF VARIANCE SOURCE OF
VARIATION
DEGREES OF FREEDOM
SUM OF SQUARES
MEAN SQUARE
COMPUTED F
TABULAR F _____________
0.05 0.01
Replication 2 0.311 0.155
Factor A 2 0.177 0.088 0.31ns 6.94 18.00
Error (a) 4 1.155 0.288
Factor B 4 5.111 1.277 3.90* 2.78 4.22
AB 8 1.822 0.277 0.69ns 2.36 3.36
Error (b) 24 7.866 0.327
TOTAL 44 16.444
*-significant ns-non-significant
Coefficient of variation (a) = 10.99%
Coefficient of variation (b) = 11.71%
Appendix Table 3. Number of pods per plant
TREATMENT BLOCK
I II III
TOTAL MEAN
No inoculation
Torrent 28 24 22 74.00 24.67
BBL 274 20 21 20 61.00 20.33
HAB 63 24 20 21 65.00 21.67
HAB 323 25 21 22 68.00 22.67
Landmark 20 22 20 62.00 20.67
Vital N
Torrent 26 22 23 71.00 23.67
BBL 274 22 20 22 64.00 21.33
HAB 63 24 21 21 66.00 22.00
HAB 323 24 20 20 64.00 21.33
Landmark 20 20 21 61.00 20.33
Bio N
Torrent 20 20 21 61.00 20.33
BBL 274 21 21 20 62.00 20.67
HAB 63 20 19 20 59.00 19.67
HAB 323 22 20 21 63.00 21.00
Landmark 20 20 20 30.00 20.00
I x V TWO-WAY TABLE
INOCULANTS VARIETIES TOR BBL 63 323 LND
TOTAL MEAN Control 24.67 20.33 21.67 22.67 20.67 110.01 22.00 Vital N 23.67 21.33 22.00 21.33 20.33 108.66 21.73 Bio N 20.33 20.67 19.67 21.00 20.00 101.67 20.33
TOTAL 68.67 62.33 63.34 65.00 61.00
MEAN 22.89 20.78 21.11 21.67 20.33
ANALYSIS OF VARIANCE SOURCE OF
VARIATION
DEGREES OF FREEDOM
SUM OF SQUARES
MEAN SQUARE
COMPUTED F
TABULAR F _____________
0.05 0.01
Replication 2 1.377 0.688
Factor A 2 0.311 0.155 5.10ns 6.94 18.00
Error (a) 4 2.088 0.522
Factor B 4 2.133 0.533 5.56** 2.36 4.22
AB 8 21.33 0.266 1.85ns 2.36 3.36
Error (b) 24 2.533 0.105
TOTAL 44 10.577
**-highly significant ns-non-significant
Coefficient of variation (a) = 7.19%
Coefficient of variation (b) = 5.87%
Appendix Table 2. Length of pods at harvest (cm)
TREATMENT BLOCK
I II III TOTAL MEAN
No inoculation
Torrent 17.07 16.45 16.78 50.30 16.77
BBL 274 15.18 15.39 15.14 45.71 15.24
HAB 63 15.74 15.75 15.19 46.68 15.56
HAB 323 15.18 14.62 15.20 45.00 15.00
Landmark 15.05 15.20 14.26 44.51 14.84
Vital N
Torrent 17.47 16.60 16.39 50.46 16.82
BBL 274 15.04 13.89 15.60 44.53 14.84
HAB 63 15.78 14.98 14.09 44.80 14.93
HAB 323 15.48 14.60 16.42 46.50 15.50 Landmark 15.34 14.53 14.01 43.88 14.63
Bio N
Torrent 16.63 16.11 17.35 50.09 16.70
BBL 274 15.45 15.69 15.00 46.14 15.38
HAB 63 15.45 15.45 15.61 46.51 15.50
HAB 323 15.65 14.64 15.10 45.39 15.13 Landmark 13.49 14.91 15.00 43.40 14.47
I x V TWO-WAY TABLE
INOCULANTS VARIETIES
TOR BBL 63 323 LND
TOTAL MEAN Control 16.77 15.24 15.56 15.00 14.84 77.41 15.48 Vital N 16.82 14.84 14.93 15.50 14.63 76.72 15.34 Bio N 16.70 15.38 15.50 15.13 14.47 77.18 15.44
TOTAL 50.29 45.46 45.99 45.63 43.94
MEAN 16.76 15.15 15.33 15.21 14.65
ANALYSIS OF VARIANCE SOURCE OF
VARIATION
DEGREES OF FREEDOM
SUM OF SQUARES
MEAN SQUARE
COMPUTED F
TABULAR F _____________
0.05 0.01
Replication 2 2.844 1.422
Factor A 2 0.311 0.155 0.81ns 6.94 18.00
Error (a) 4 0.355 0.088
Factor B 4 0.755 0.188 17.68** 2.78 4.22
AB 8 1.244 0.155 0.65ns 2.36 3.36
Error (b) 24 4.800 0.200
TOTAL 44 10.311
**-highly significant ns-non- significant
Coefficient of Variation (a) = 4.14%
Coefficient of Variation (b) = 3.67%
Table 6. Width of pods at harvest (cm)
TREATMENT BLOCK
I II III
TOTAL MEAN
No inoculation
Torrent 1 1 1 3.0 1.00
BBL 274 0.9 0.95 0.9 2.75 0.92
HAB 63 0.9 0.95 0.85 2.70 0.90
HAB 323 0.9 0.85 0.9 2.65 0.88
Landmark 1 1 0.9 2.9 0.97
Vital N
Torrent 1.1 1 0.95 3.05 1.02
BBL 274 0.8 0.79 0.85 2.44 0.81
HAB 63 0.95 0.8 0.79 2.54 0.85
HAB 323 0.87 0.78 0.9 2.55 0.85
Landmark 1 0.96 0.9 2.86 0.95
Bio N
Torrent 1 0.94 1 2.94 0.98
BBL 274 1 0.85 0.6 2.45 0.82
HAB 63 1.1 0.8 0.89 2.79 0.93
HAB 323 0.9 0.79 0.85 2.54 0.85
Landmark 0.88 0.95 0.9 2.73 0.91
I x V TWO-WAY TABLE
INOCULANTS VARIETIES TOR BBL 63 323 LND
TOTAL MEAN Control 1.00 0.92 0.90 0.88 0.97 4.67 0.93
Vital N 1.02 0.81 0.85 0.85 0.95 4.48 0.90
Bio N 0.98 0.82 0.93 0.85 0.91 4.49 0.90
TOTAL 1.96 2.55 2.68 2.66 2.83 1.96
MEAN 0.65 0.85 0.89 0.89 0.94 0.65
ANALYSIS OF VARIANCE SOURCE OF
VARIATION
DEGREES OF FREEDOM
SUM OF SQUARES
MEAN SQUARE
COMPUTED F
TABULAR F _____________
0.05 0.01
Replication 2 0.047 0.023
Factor A 2 0.014 0.007 1.17ns 6.94 18.00
Error (a) 4 0.023 0.006
Factor B 4 0.140 0.035 6.57** 2.78 4.22
AB 8 0.027 0.003 0.64ns 2.36 3.36
Error (b) 24 0.128 0.005
TOTAL 44 44 0.379
**-highly significant ns- non-significant
Coefficient of Variation (a) = 8.37%
Coefficient of Variation (b) = 8.00%
Table 7. Weight of marketable pods (kg)
TREATMENT BLOCK
I II III
TOTAL MEAN
No inoculation
Torrent 5.49 2.04 3.81 11.34 3.78
BBL 274 2.78 2.48 3.79 9.05 3.02
HAB 63 4.06 3.30 2.72 10.08 3.36
HAB 323 4.00 2.55 3.90 10.45 3.48
Landmark 3.00 3.42 3.61 10.03 3.34
Vital N
Torrent 5.02 4.00 4.28 13.30 4.43
BBL 274 2.75 3.02 2.98 8.75 2.92
HAB 63 3.98 3.28 2.04 9.30 3.10
HAB 323 4.02 4.20 3.04 11.26 3.75
Landmark 3.52 3.02 2.52 9.06 3.02
Bio N
Torrent 3.33 4.01 4.52 11.76 3.92
BBL 274 2.38 3.56 4.50 10.44 3.48
HAB 63 4.51 3.60 3.27 11.44 3.81
HAB 323 4.02 2.76 3.75 10.53 3.51
Landmark 4.27 4.25 3.03 11.55 3.85
I x V TWO-WAY TABLE
INOCULANTS VARIETIES
TOR BBL 63 323 LND
TOTAL MEAN
Control 3.78 3.02 3.36 3.48 3.34 16.98 3.40
Vital N 4.43 2.92 3.10 3.75 3.02 17.22 3.44
Bio N 3.92 3.48 3.81 3.51 3.85 18.75 3.71
TOTAL 12.13 9.42 10.27 10.74 10.21
MEAN 4.04 3.14 3.42 3.58 3.40
ANALYSIS OF VARIANCE SOURCE OF
VARIATION
DEGREES OF FREEDOM
SUM OF SQUARES
MEAN SQUARE
COMPUTED F
TABULAR F _____________
0.05 0.01
Replication 2 2.029 1.015
Factor A 2 0.882 0.441 0.53ns 6.94 18.00
Error (a) 4 3.326 0.832
Factor B 4 4.027 1.007 1.77ns 2.36 4.22
AB 8 2.335 0.292 0.51ns 2.36 3.36
Error (b) 24 13.660 0.569
TOTAL 44 44 26.260
ns- non-significant
Coefficient of Variation (a) =25.91%
Coefficient of Variation (b) =21.43%
Appendix Table 4. Weight of non-marketable pods (kg)
TREATMENT BLOCK I II III
TOTAL MEAN
No inoculation
Torrent 1.5 0.75 0.75 3 1
BBL 274 0.6 1.6 0.8 3 1
HAB 63 0.5 0.5 0.75 1.75 0.58
HAB 323 0.8 0.75 0.5 2.05 0.68
Landmark 0.3 0.5 0.7 105 0.5
Vital N
Torrent 0.5 0.5 0.25 1.25 0.42
BBL 274 0.3 0.25 0.75 1.3 0.43
HAB 63 0.75 0.25 0.77 1.52 0.51
HAB 323 0.5 0.8 1.00 2.3 0.77
Landmark 0.5 0.8 1.00 2.3 0.77
Bio N
Torrent 0.3 0.5 0.25 1.05 0.35
BBL 274 0.2 0.75 1.00 1.95 0.96
HAB 63 0.25 1.7 0.78 2.73 0.91
HAB 323 0.5 0.75 0.5 1.75 0.58
Landmark 0.25 1.00 0.75 2.00 0.67
I x V TWO-WAY TABLE
INOCULANTS VARIETIES
TOR BBL 63 323 LND
TOTAL MEAN Control 1.0 1.0 0.58 0.68 0.5 3.76 0.75
Vital N 0.42 0.43 0.59 0.51 0.77 2.72 0.54
Bio N 0.35 0.65 0.91 0.58 0.67 3.16 0.63
TOTAL 1.77 2.08 2.08 1.77 1.94
MEAN 0.59 0.69 0.69 0.59 0.63
ANALYSIS OF VARIANCE SOURCE OF
VARIATION
DEGREES OF FREEDOM
SUM OF SQUARES
MEAN SQUARE
COMPUTED F
TABULAR F 0.05 0.01
Replication 2 0.367 0.183
Factor A 2 0.335 0.168 0.72ns 6.94 18.00
Error (a) 4 0.929 0.232
Factor B 4 0.098 0.024 0.27ns 2.78 4022
AB 8 1.287 0.161 1.74ns 2036 3.36
Error (b) 24 2.221 0.092
TOTAL 44 5.238
ns- non-significant
Coefficient of Variation (a) = 74.93%
Coefficient of Variation (b) = 47.34%
Appendix Table 5. Total Yield per plot (kg/3m 2)
TREATMENT BLOCK
I II III
TOTAL MEAN
No inoculation
Torrent 7.09 2.79 4.56 14.44 4.81
BBL 274 3.28 4.08 4.59 11.95 3.98
HAB 63 4.56 3.8 3.47 11.91 3.97
HAB 323 4.8 3.3 4.4 15.50 4.17
Landmark 3.3 3.92 4.31 11.53 3.84
Vital N
Torrent 5.52 4.5 4.53 14.55 4.85
BBL 274 2.78 3.27 3.73 9.78 3.26
HAB 63 4.73 3.53 2.81 12.78 4.26
HAB 323 4.52 4.45 3.81 12.78 4.26
Landmark 4.02 3.82 3.52 11.36 3.79
Bio N
Torrent 3.53 4.51 4.77 12.86 4.29
BBL 274 2.58 4.31 5.5 11.39 3.80
HAB 63 4.76 5.3 4.05 14.11 4.70
HAB 323 4.52 3.51 4.53 12.56 4.19
Landmark 4.52 5.25 3.78 13.55 4.52
I x V TWO-WAY TABLE
INOCULANTS VARIETIES
TOR BBL 63 323 LND
TOTAL MEAN Control 4.81 3.98 3.97 4.17 3.84 20.77 4.15
Vital N 4.85 3.2 3.69 4.36 3.79 19.85 3.97
Bio N 4.29 3.80 4.70 4.19 4.52 21.5 4.3
TOTAL 13.95 11.04 12.36 12.62 12.15
MEAN 4.65 3.68 4.12 4.21 4.05
ANALYSIS OF VARIANCE SOURCE OF
VARIATION
DEGREES OF FREEDOM
SUM OF SQUARES
MEAN SQUARE
COMPUTED F
TABULAR F _____________
0.05 0.01
Replication 2 0.887 0.443
Factor A 2 0.815 0.407 0.46ns 6.94 18.00
Error (a) 4 3.552 0.888
Factor B 4 4.361 1.090 1.34ns 2.78 4.22
AB 8 3.274 0.409 0.50ns 2.36 3.36
Error (b) 24 19.501 0.813
TOTAL 44 32.389
ns- non-significant
Coefficient of Variation (a) = 22.76%
Coefficient of Variation (b) = 21.77%
Table 8. Computed yield per hectare (t/ha)
TREATMENT BLOCK
I II III
TOTAL MEAN
No inoculation
Torrent 23.61 9.29 15.8 48.08 16.03
BBL 274 10.92 13.59 15.28 39.79 13.26
HAB 63 15.18 12.65 11.56 39.39 13.13
HAB 323 15.98 10.99 14.65 41.62 13.87 Landmark 10.99 13.05 14.35 38.39 12.80
Vital N
Torrent 18.38 14.99 15.08 48.45 16.15 BBL 274 9.26 70.89 12.42 32.57 10.86
HAB 63 15.75 11.75 9.36 36.86 12.29
HAB 323 15.05 14.82 12.69 42.58 14.19 Landmark 13.39 12.72 11.72 37.83 12.61
Bio N
Torrent 11.75 15.02 15.88 42.65 14.22 BBL 274 8.59 14.35 18.32 41.26 13.75
HAB 63 15.85 17.65 13.49 46.99 15.66
HAB 323 15.05 11.63 15.08 41.82 13.94 Landmark 15.05 17.48 12.59 45.12 15.04
I x V TWO-WAY TABLE
INOCULANTS VARIETIES
TOR BBL 63 323 LND
TOTAL MEAN Control 16.03 13.26 13.13 13.87 12.80 69.09 13.82 Vital N 16.15 10.86 12.29 14.19 12.61 66.1 13.22 Bio N 14.22 13.75 15.66 13.94 15.04 72.61 14.52
TOTAL 46.4 37.87 41.08 42.00 40.45
MEAN 15.47 12.62 13.69 14.00 13.48
ANALYSIS OF VARIANCE SOURCE OF
VARIATION
DEGREES OF FREEDOM
SUM OF SQUARES
MEAN SQUARE
COMPUTED F
TABULAR F _____________
0.05 0.01
Replication 2 6.414 3.207
Factor A 2 12.793 6.397 0.54ns 6.94 18.00
Error (a) 4 47.448 11.862
Factor B 4 38.616 9.654 1.11ns 2.78 4.22
AB 8 38.324 4.791 0.55ns 2.36 3.36
Error (b) 24 209.130 8.714
TOTAL 44 352.727
ns- non-significant
Coefficient of Variation (a) = 24.87%
Coefficient of Variation (b) = 21.31%
Appendix Table 10. Number of nodules per plant
TREATMENT BLOCK
I II III
TOTAL MEAN
No inoculation
Torrent 35 24 42 101.00 33.67
BBL 274 39 17 24 80.00 26.67
HAB 63 66 35 40 141.00 47.00
HAB 323 35 32 21 38.00 29.33
Landmark 26 13 68 107.00 35.67
Vital N
Torrent 44 33 30 107.00 35.67
BBL 274 57 25 60 142.00 47.33
HAB 63 50 52 53 155.00 51.67
HAB 323 35 67 38 110.00 36.67
Landmark 32 29 30 91.00 30.33
Bio N
Torrent 22 34 51 107.00 35.67
BBL 274 36 18 32 86.00 28.67
HAB 63 45 39 19 103.00 34.33
HAB 323 38 35 17 90.00 30.00
Landmark 21 35 44 100.00 33.33
I x V TWO-WAY TABLE
INOCULANTS VARIETIES
TOR BBL 63 323 LND
TOTAL MEAN Control 33.67 26.67 47.00 29.33 35.67 172.34 34.47 Vital N 35.67 47.33 51.67 36.67 30.33 201.67 40.33 Bio N 35.67 28.64 34.33 30.00 33.33 162 32.4
TOTAL 105.01 102.67 133 96 99.33
MEAN 35.00 34.22 44.33 32 33.11
ANALYSIS OF VARIANCE SOURCE OF
VARIATION
DEGREES OF FREEDOM
SUM OF SQUARES
MEAN SQUARE
COMPUTED F
TABULAR F _____________
0.05 0.01
Replication 2 613.200 306.600
Factor A 2 508.133 254.066 2.65ns 6.94 18.00 Error (a) 4 383.866 95.966
Factor B 4 878.355 219.588 1.28ns 2.78 4.22
AB 8 903.644 112.955 0.66ns 2.36 3.36
Error (b) 24 4111.600 171.316
TOTAL 44 7398.800
ns-non-significant
Coefficient of Variation (a) = 27.42%
Coefficient of Variation (b) = 36.63%