TONGED, ONOFRE C. OCTOBER 2007. Evaluation of Bush Snapbean Varieties Under Poblacion, Sablan, Benguet Condition. Benguet State University, La Trinidad, Benguet.
Adviser: Guerzon A. Payangdo, MSc.
ABSTRACT
Ten bush snapbean varieties were evaluated to determine their growth and seed yield and identify which of these varieties would perform best under Poblacion, Sablan, Benguet condition.
Bush snapbean varieties significantly varied on the number of days to flowering, plant height at maturity, number of flowers per cluster, pods per cluster, length and width of pods harvest, number of marketable and non-marketable seeds and computed seed yield.
“Lipstican”, Maroon and Contender were the earliest to produce flower and China 804 was the tallest at maturity. Maroon and China 804 produced the most number of flowers and pods per cluster. “Lipstican” and Contender significantly produced the heaviest marketable seed and had the highest return on cash expense.
Varieties of Contender, “Lipstican”, Maroon and china 804 had the best growth and seed yield performance and most profitable under Poblacion, Sablan, Benguet condition.
Page
Bibliography. . . i
Abstract. . . i
Table of Contents .. . . ii
INTRODUCTION . . . 1
REVIEW OF LITERATURE . . . 3
MATERIALS AND METHODS . . . 7
RESULTS AND DISCUSSION . . . 12
Meteorological Data . . . 12
Days to Emergence . . . 12
Days to Flowering, Planting to First Harvest and Last Harvest . . . 12
Days to Maturity and Plant Height at Maturity . . . 13
Number of Flowers Per Cluster, Pods Per Cluster and Days to Pod Setting. . . 16
Number of Clusters Per Plant and Pods Per Plant . . . 17
Percentage Pod Set . . . 17
Length and Width of Pods at Harvest . . . 18
Weight of Marketable and Non-Marketable Seed Yield Per Plot . . . 18
Number of Seeds Per Pod . . . 21
Total seed yield per pot Pod . . . 21
Computed Seed Yield Per Plot and Per Hectare . . . 22
Insect and Disease Incidence . . . 22
SUMMARY, CONCLUSIONS AND RECOMMENDATIONS
Summary . . . 24 Conclusion . . . 25 Recommendation . . . 25
Bush snapbean, scientifically known as Phaseolus vulgaris is one of the vegetable legumes grown in many parts of Cordillera region. It is not only grown for its economic value but also for nutrients as it is a good source of proteins, vitamins and others that are important for human health (Celoy, 1999).
The bush snapbean is locally called by Kankana-ey of Benguet as “Tokdo-an” is bushy and determinate; hence it does not require trellising. Bush bean is grown for their tender pods or seeds, and commercially grown in highlands of Cordillera. They are considered as one of the good crop in Benguet and Mountain Province as nourishing vegetable since it is an important source of fiber, riboflavin, niacin, phosphorous, calcium and iron (Loakan, 2003). Moreover, the crops are grown for economic value.
This varietal evaluation was done to identify varieties that are suitable, high yielding, early maturing, resistance to insect pest and diseases. The identified varieties could be an alternate to some of the low yielding farmers’ variety.
At present, farmers in the locality are not planting bush snapbean since the main crop produce is rice. Sometimes, when water is available especially during dry season, farmers plant pechay, pole snapbeans, cucumber and others that are early maturing as crop substitute to rice. Because of these practices, it is advisable to introduce and encourage farmers to plant other cash crops like bush snapbean for a better profit.
The use of high yielding varieties is the cheapest means of increasing yield (Rosario, 1974). Furthermore, varietal evaluation is the process in crop breeding program which provides comparison of promising lines developed by breeder. It is only through
varietal evaluation that a breeder observes the performance of developed lines in terms of yield, quality, adaptability and resistance to pest and disease.
The objectives of the study were; to determine the growth and seed yield of different bush snapbean varieties and identify the best performing bush snapbean under Poblacion, Sablan, Benguet condition.
This study was conducted at Poblacion, Sablan, Benguet from March to June 2007.
REVIEW OF LITERATURE
The Plant
Bush snapbean varieties belong to Leguminosae family which are dwarf and determinate plant. Varieties of bush bean are dwarf and that does not require trellis for support due to its determinate growth habit and early maturing. Bush snapbean is a warm temperate season annual crop grown for fresh pods, which are harvested while they are still tender with small seeds. Flat or oval and stringless pods are preferred for the fresh market. On the other hand, round-podded varieties with white seeds are preferred for canning (Purseglove, 1978).
A study by PCARRD (1983) showed that vegetable legumes have trifoliate leaves. The leaflets are ovate, oblong or oblong lancolate and vary in size from small to large. The flowers vary also in size and in color depending on varieties. Calyxes are generally green and purple. The corolla is white, yellow, purple and blue. It was further stated that the characteristics also varies with varieties.
Varietal Evaluation
Varietal evaluation gathers data on plant characteristics, yield performance and pod quality. Hence, we can obtain high yielding and improve varieties that are known to plants important role in boosting production (Regmi, 1990). Moreover, Bautista and Mabesa (1977) stated that the variety to be selected should be high yielding, pest and disease resistant, and early maturing so that production would entail less expense, and ensure more profit. Selecting the right variety will minimize problems associated with water and fertilizer management.
Reily and Shry (1991) reported that variety must be adapted to the area in which it is grown. Different varieties which are grown under the same method of culture have a great variation in the yielding ability. A variety that yields will in one region is not a guarantee that it will perform well in another region.
High yielding and improved cultivars are known to play an important role in boosting production. Large numbers of indigenous and exotic accessories of various plant species are evaluated and the number of cultivars are selected and recommended for mass growing (Bitaga, 2002).
AVRDC (1990) reported that the closest source of varieties for testing are the farmers, who produce their own seeds. They are also excellent sources of information about the characteristics of what they are using. Secondly, there are several local seeds traders. Another source is government institutions, such as universities and the Department of Agriculture, which are involved in variety development. In addition, the most important decisions to commercial grower must use each season for the selection of variety. Observation on plant performance, characteristics and yield can be noted and recorded by using a few number of varieties for evaluation.
Yield performance of any variety is affected by environmental factors like soil condition, climate and incidence of pest and diseases (PCARRD, 1989). Diseases are some major problems of snap beans throughout the world. As mentioned by Sunil (1990), varietal evaluation is a process of crop breeding programs which provides comparison of promising lines developed by a breeder. It is only through varietal evaluation that a breeder can see the yield, quality, adaptability, insect pest and disease resistance and stress tolerance.
Suitable areas for Bush Snapbean Production
The flowering of “green matured” pods start 60 days from planting under La Trinidad condition. In warmer area it is earlier to mature while in higher elevations takes longer period with cooler temperature. Harvesting is dependent on the variety used, location and temperature. Seeds are harvested after the pods are mature and when seed moisture content is approximately 16-20 %. Harvesting and handling low-moisture beans (less than 14%) may result in mechanical and seed loss (Kudan, 1991).
It is reported that beans grows best on soils that hold water well and have a good air and water filtration. Soil should have a pH of 5.8 to 6.6. Pacher (2002) stated that bush beans are warm temperature season vegetables that will not tolerate frost. It requires adequate amount of moisture. Temperatures are important for rapid growth. Good pod set, and early maturity.
Bush snapbean grow best in areas with temperature between 15 to 21 degree celcius. However this crop can tolerate warmer temperature up to 25 degree Celsius (HARRDEC, 2000). Growth and yield of snap bean are also best in high elevation. Yield was significantly low in lower elevation, and maturity was longer in higher elevation than in lower elevation (Bantog, 1993).
Ware and Swiader (2002) said that for rapid, uniform emergence, bean seeds should be planted in warm soils. Bush beans grow best on soils that have a temperature range from 60 to 85 degree Fahrenheit (°F) with an optimum of 80oF for seed germination. Below 50oF and above 95oF will slow down the growth and maturation of the crop. If you grow beans in cool, wet soil germination will be delayed, and seed may rot, which can also produce low yield.
Planting Distance, Fertilizer and Irrigation
Beans should be planted the whole year round. It is commonly direct seeded in the rows for easy cultivation. Seeding rates may differ depending on seed size, percentage germination, irrigation and row spacing. The planting distance is 20x20 cm both ways with two to three seed per hill is best for snap bean production. Seeds planted during dry season should be covered with soil equal to the tripled size of seeds planted.
During rainy season, less soil is needed to avoid rotting of seeds (HARRDEC, 1989).
In seed production, Ap-apid (1991) found out that the wider the spacing between hills, the heavier were the marketable seeds produced per plant with 10 cm. distance due to high competition for light and nutrients among plant per unit area. Similarly, Ingles (1990) found out that density of two seeds per hill at a distance of 20cm to 30cm between hills yielded the heaviest seeds per plot.
Irrigation is an essential requirement in the farm when rainfall is not secured.
Without the selection of seeds, application of adequate fertilizers, insect pest and disease control and the practice of improved cultural management could ensure production of crops with maximum economic returns (Aquision, 1996).
MATERIALS AND METHODS
An area of 300 sq. m. was properly cleaned and prepared into raise beds. The area was divided into three blocks consisting of ten plots per blocks measuring 1m x10 m. The experiment was laid out using randomized complete block design (RCBD) with three replications.
The bush snapbean varieties are as follows;
Variety Source
V1- Maroon (check) Sablan V2- HAB 63 BSU V3- HAB 323 BSU V4- BBL 274 BSU V5- Torrent BSU V6- Landmark BSU V7- Greencrop BSU V8- Contender BSU V9- China 804 BSU V10- “Lipstican” Kalinga
To ensure growth and yield, cultural management practices such as irrigation, weeding, fertilizer application, side dressing and hilling-up, insect and disease control were properly employed.
Data Gathered
A. Maturity
1. Days to emergence. This was taken by counting the number of days from planting up to the time when at least 50% of the plants per plot emerged.
2. Days to flowering. This was recorded by counting the number of days from planting up to the time when at least 50% of the plants set flowers.
3. Days from planting to first harvest. This was recorded by counting the days from planting to first harvesting.
4. Days from planting to last harvest. This was recorded by counting the days from planting to last harvesting.
5. Days to maturity. This was recorded by counting the number of days from planting up to the time when pods turned yellowish in color.
6. Plant height at maturity (cm). This was taken by measuring ten sample plants per plot from base to shoot tip by random at maturity.
B. Growth Parameters
1. Number of flower per cluster. This was recorded by counting the flower per cluster that develops per plant from ten sample plants per plot.
2. Number of days to pod setting. This was recorded by counting the days when 50% of the flower breaks up and pod measured 1 inch long.
3. Number of pods per cluster. This was recorded by counting the number of pods per cluster per plant.
Total number of pods per cluster Total number of flower per cluster
Total number of pods harvested per plot Total number of plants harvested per plot 4. Number of cluster per plant. This was recorded by counting the number of clusters per plant.
5. Percentage pod set (%). This was determined using the data in numbers 1 and 3.
Percentage pod (%) = x100
6. Number of pods per plant. This was recorded using these formula.
Number of pods per plant = x100
7. Length of pod at harvest (cm). Ten random sample pods will be obtained per treatment and pod length was measured from pedicel end to distal end using a foot ruler.
8. Width of pod at harvest (cm). This was measured from the ten sample pods used in getting the length of pod from its middle portion using foot ruler.
C. Yield components
1. Weight of marketable seed yield per plot (kg). This was the total weight of marketable seeds harvested per plot after threshing, cleaning and removing deformed or insect and disease damaged seeds.
2. Weight of non-marketable seed yield per plot (kg). This was the total weight of non-marketable seeds harvested per plot. Seeds was considered non-marketable when they are malformed/ abnormal and damaged by pest beyond control.
3. Number of seeds per pod. This was taken by counting the number of seeds from ten sample plants per treatment taken at random.
x 10,000
4. Total seeds yield per plot (kg). This was taken by weighing and recording the dry seeds harvested per plot including non-marketable.
5. Computed seed yield per hectare (kg) . This was computed based on the yield per plot using this formula:
Yield (kg/ha) = Total yield/ plot Plot size (m2)
6. Insect and Disease Incidence. This was taken by assessing the degree of damage caused by specific insect and disease to the crop.
a. Pod Borer (Jose,2004)
Scale Percent Infestation Description
1 No infection Highly resistance 2 1-25% of the plant/plot infested ` Mild resistance 3 26-50% of the plant/plot infested Moderate resistance 4 51-75% of the plant/plot infested Susceptible
5 76-100% of the plant/plot infested Very susceptible b. Bean rust (Jose, 2004)
Scale Percent Infestation Description
1 No infection Highly resistance 2 1-25% of the plant/plot infested Mild resistance 3 26-50% of the plant/plot infested Moderate resistance 4 51-75% of the plant/plot infested Susceptible
5 76-100% of the plant/plot infested Very susceptible
x 100
7. Return on Cash Expense (ROCE). This was analyzed using this formula:
ROCE = NET income Total production cost Analysis of Data
All quantitative data were analyzed using Analysis of Variance (ANOVA) for RCBD. The significance of difference among treatment means was tested using Duncan’s Multiple Range Test (DMRT) at 5% level of significance.
RESULTS AND DISCUSSION
Meteorological Data During the Conduct of the Study
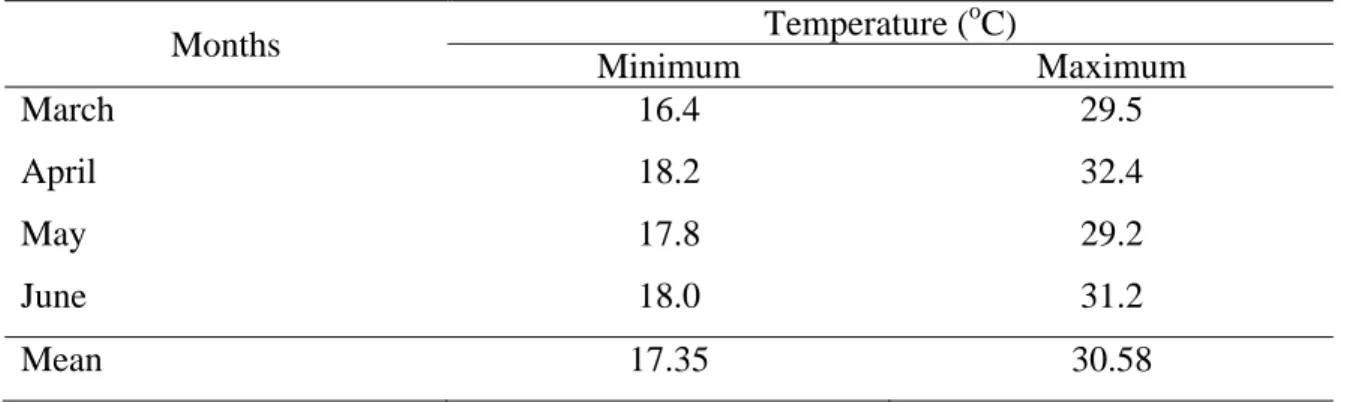
Table 1 shows the minimum and maximum temperature of the month during the conduct of the study. This temperature ranges was appropriate since legume crops like bush snapbean perform well at 16 0C to 31 0C.
Days to Emergence
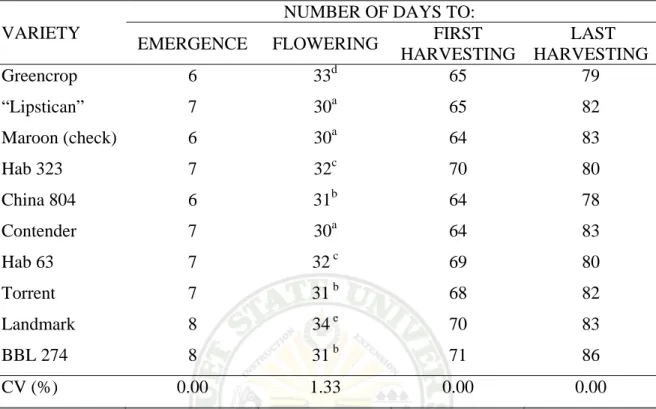
Greencrop, Maroon and China 804 were the earliest to emerge in six days followed by the rest which emerge seven days after planting except for Landmark and BBL 274 which was the latest to emerge at eight days from planting, although result indicates no significant differences.
Days to Flowering, Planting to First Harvest to the Last Harvest
Based on the statistical analysis of the data obtained from the different varieties in terms of the number of days to emergence, no significant differences were obtained. As to the number of days to flowering, significant differences were among the varieties, Table 1. Minimum and maximum temperature of the month during the conduct of the
study
Months Temperature (oC)
Minimum Maximum
March 16.4 29.5
April 18.2 32.4
May 17.8 29.2
June 18.0 31.2
Mean 17.35 30.58
Table 2. Number of days to emergence, days to flowering, days from planting to first harvesting and last harvesting of ten varieties of bush snapbean varieties evaluated
VARIETY
NUMBER OF DAYS TO:
EMERGENCE FLOWERING FIRST HARVESTING
LAST HARVESTING
Greencrop 6 33d 65 79
“Lipstican” 7 30a 65 82
Maroon (check) 6 30a 64 83
Hab 323 7 32c 70 80
China 804 6 31b 64 78
Contender 7 30a 64 83
Hab 63 7 32c 69 80
Torrent 7 31b 68 82
Landmark 8 34e 70 83
BBL 274 8 31b 71 86
CV (%) 0.00 1.33 0.00 0.00
Means with the same letter are not significantly different at 5% level by DMRT.
Landmark was latest to flower. While on the number of days to the first and last harvest, no significant differences were noted.
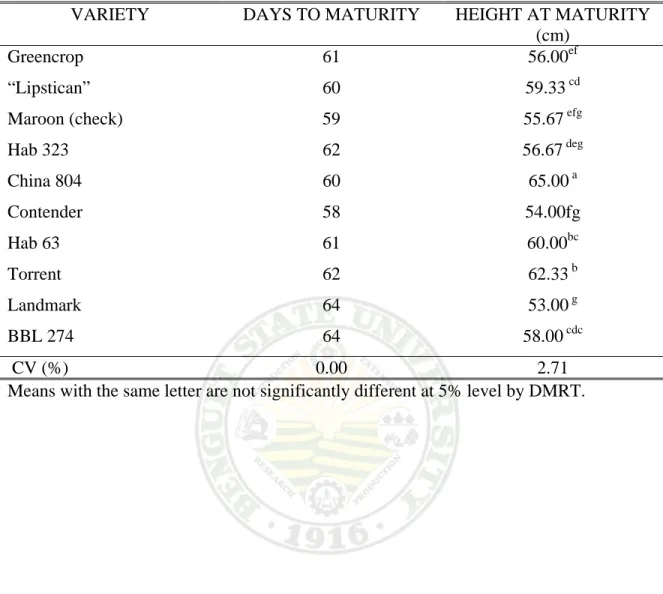
Days to maturity, plant height at maturity
Table 3 shows the number of days to maturity with no significant differences noted among the treatments. Although numerically, Contender was the earliest to mature.
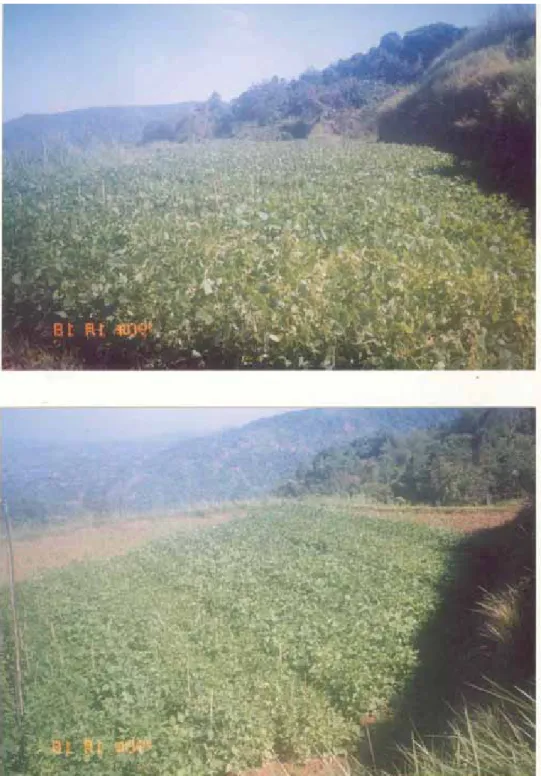
On plant height at maturity, China 804 was the tallest followed by Torrent and the shortest was Landmark. The significant differences existed among the varieties was attributed to the genetic characteristics. Fig. 1 shows the plants at maturity.
Table 3. Number of days to maturity and plant height at maturity of ten bush snapbean varieties evaluated
VARIETY DAYS TO MATURITY HEIGHT AT MATURITY (cm)
Greencrop 61 56.00ef
“Lipstican” 60 59.33 cd
Maroon (check) 59 55.67 efg
Hab 323 62 56.67 deg
China 804 60 65.00 a
Contender 58 54.00fg
Hab 63 61 60.00bc
Torrent 62 62.33 b
Landmark 64 53.00 g
BBL 274 64 58.00 cdc
CV (%) 0.00 2.71
Means with the same letter are not significantly different at 5% level by DMRT.
Figure 1. Plants at maturity
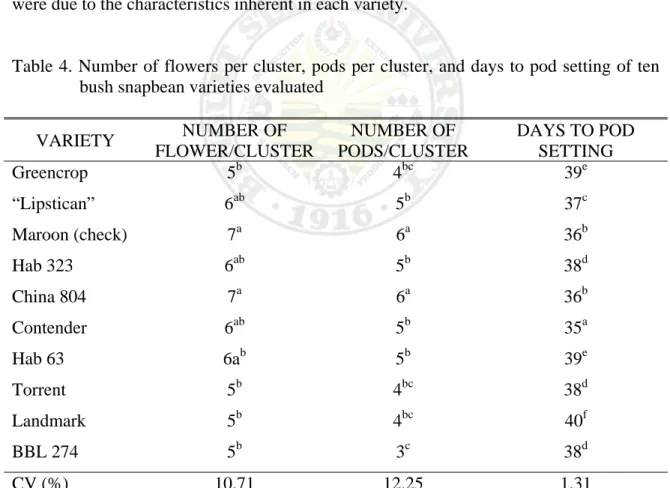
Number of Flowers Per Cluster, Pods Per Cluster and Days to Pod Setting
Table 4 shows significant differences on the number of flowers per cluster which is obtained from Maroon and China 804 varieties, Although, flowers per cluster did not differ statistically for “Lipstican”, HAB 323, Contender and HAB 63. For the pods per cluster, Maroon and China 804 had the most numerous pods per cluster followed by
“Lipstican”, HAB 323, Contender and HAB 63. The least pods were obtained from BBL 274. On the number of days to pod setting, Landmark significantly was the latest to set pod followed by HAB 63 and Greencrop and the earliest to set pod were Contender then Maroon, China 804, “Lipstican”, Torrent, HAB 323 and BBL 274. Significant differences were due to the characteristics inherent in each variety.
Table 4. Number of flowers per cluster, pods per cluster, and days to pod setting of ten bush snapbean varieties evaluated
VARIETY NUMBER OF NUMBER OF DAYS TO POD FLOWER/CLUSTER PODS/CLUSTER SETTING
Greencrop 5b 4bc 39e
“Lipstican” 6ab 5b 37c
Maroon (check) 7a 6a 36b
Hab 323 6ab 5b 38d
China 804 7a 6a 36b
Contender 6ab 5b 35a
Hab 63 6ab 5b 39e
Torrent 5b 4bc 38d
Landmark 5b 4bc 40f
BBL 274 5b 3c 38d
CV (%) 10.71 12.25 1.31
Means with the same letter are not significantly different at 5% level by DMRT.
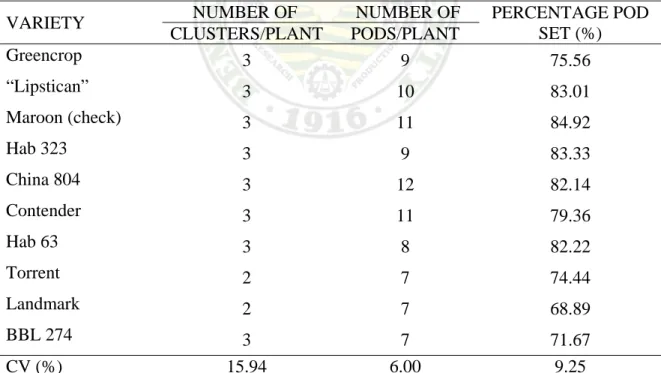
Number of Cluster Per Plant, Pods Per Plant
Table 5 indicates that the number of clusters per plant was not significant. For the number of pod per plant, China 804 had significantly the most numerous pods for plant (12) followed by Maroon and Contender with 11 pods per plant. The lowest registered pods per plant were noted from Torrent, Landmark and BBL 274. The significance differences on percentage pod set could had been influenced by their varietal nature.
Percentage Pod Set (%)
Table 5 indicates no significant differences in terms of days to pod setting although numerically, Maroon variety had the highest pod set percentage and the lowest was Landmark.
Table 5. Number of cluster per plant, number of pods per plant and percentage pod set of ten varieties of bush snapbean evaluated
VARIETY NUMBER OF NUMBER OF PERCENTAGE POD SET (%) CLUSTERS/PLANT PODS/PLANT
Greencrop 3 9 75.56
“Lipstican” 3 10 83.01
Maroon (check) 3 11 84.92
Hab 323 3 9 83.33
China 804 3 12 82.14
Contender 3 11 79.36
Hab 63 3 8 82.22
Torrent 2 7 74.44
Landmark 2 7 68.89
BBL 274 3 7 71.67
CV (%) 15.94 6.00 9.25
Means with the same letter are not significantly different at 5% level by DMRT.
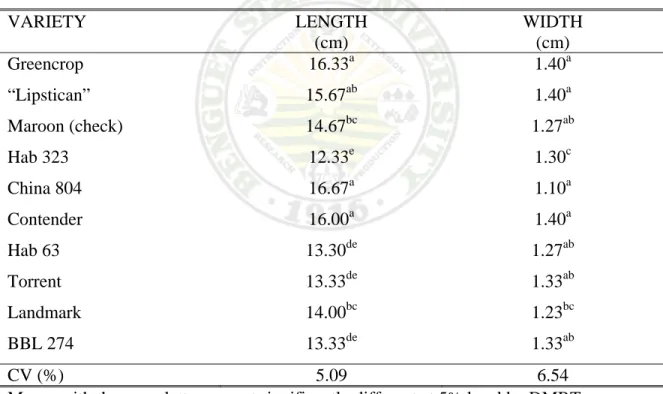
Length and Width of Pods at Harvest
Significant differences were observed among the varieties in terms of pod length at harvest (Table 6). China 804, Greencrop and Contender had the longest pods which were comparable with “Lipstican”. The shortest pods were obtained from HAB 323. On pod width at harvest, Greencrop, “Lipstican” and Contender had the widest pods which were not significantly different with that of Maroon, HAB 323, HAB 63, Torrent and BBL 274 and narrowest pods were obtained from China 804. These significant differences were attributed to their varietal characteristics.
Table 6. Length and width of pods at harvest of ten varieties of bush snapbean evaluated VARIETY LENGTH
(cm)
WIDTH (cm)
Greencrop 16.33a 1.40a
“Lipstican” 15.67ab 1.40a
Maroon (check) 14.67bc 1.27ab
Hab 323 12.33e 1.30c
China 804 16.67a 1.10a
Contender 16.00a 1.40a
Hab 63 13.30de 1.27ab
Torrent 13.33de 1.33ab
Landmark 14.00bc 1.23bc
BBL 274 13.33de 1.33ab
CV (%) 5.09 6.54
Means with the same letter are not significantly different at 5% level by DMRT.
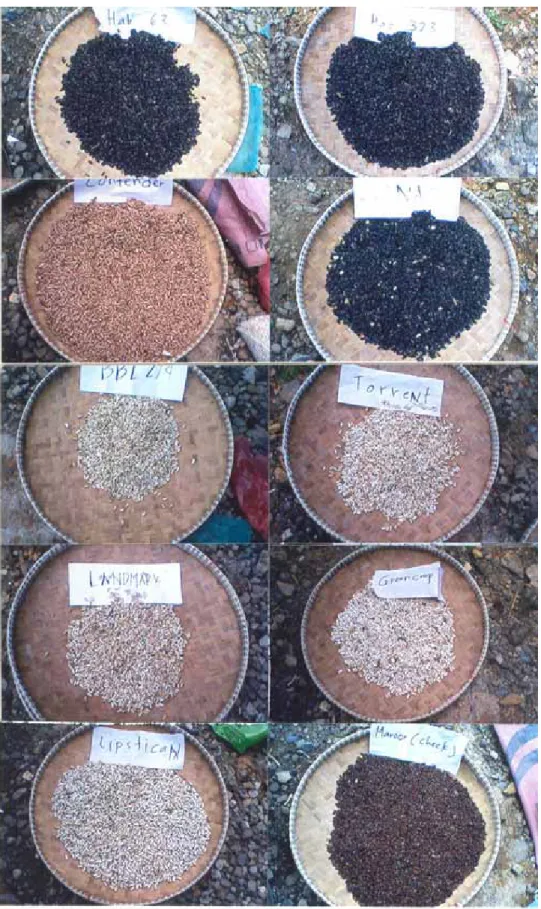
Weight of Marketable and Non-marketable Seed Yield Per Plot (kg)
Table 7 shows the weight of marketable and non-marketable seed yield per plot.
Significant differences were noted on both weight of marketable and non-marketable
seed yield per plot. Such that Contender and “Lipstican” followed by Maroon yielded the heaviest weight of seed yield per plot and the lightest was obtained from BBL 274. On the weight of non-marketable seed yield per plot, “Lipstican” produced the heaviest seeds which were comparable with Contender and China 804 while HAB 323 produced the lightest. The significant differences in terms of marketable seed yield per plot was the effect on the differences in terms of seed sizes. Fig.2 shows the marketable seeds harvested from the different varieties.
Table 7. Weight of marketable and non-marketable seed yield per plot and the number of seeds per pod of ten bush snapbean evaluated.
VARIETY MARKETABLE SEED
NON- MARKETABLE
SEEDS
NUMBER OF SEEDS PER POD
Greencrop 0.73c 0.40bc 5b
“Lipstican” 1.03a 0.52a 5b
Maroon (check) 0.88b 0.30cd 6a
Hab 323 0.72c 0.22d 6a
China 804 0.57d 0.50ab 6a
Contender 1.13a 0.50ab 6a
Hab 63 0.68cd 0.32cd 6a
Torrent 0.57d 0.40bc 5b
Landmark 0.38e 0.27d 5b
BBL 274 0.32e 0.33cd 5b
CV (%) 10.05 16.01 7.97
Means with the same letter are not significantly different at 5% level by DMRT.
Evaluation of Bush Snapbean Varieties Under
Figure 2. Marketable seeds harvested from the ten bush snapbean varieties
Number of Seeds Per Pod
The varieties which produced highest yield per pod were Maroon, HAB 323, China 804, Contender and HAB 63. The significant differences could be attributed to their varietal characteristics since each variety differ in the number of seeds per pod and length.
Total Seed Yield Per Plot
The total seed yield per plot of ten bush snapbeans studied revealed that
“Lipstican” and Contender varieties yielded the heaviest per plot followed by Maroon and China 804. The lowest was noted from Landmark and BBL 274 varieties.
Table 8. Total seed yield per plot and computed seed yield per hectare of ten bush snapbean varieties evaluated
VARIETY SEED YIELD/PLOT (kg/10m2)
COMPUTED SEED YIELD (tons/ha)
Greencrop 1.13bc 1130.00
“Lipstican” 1.55a 1550.00
Maroon (check) 1.18b 1180.00
Hab 323 0.93d 930.00
China 804 1.07bcd 1070.00
Contender 1.63a 1630.00
Hab 63 1.00cd 1000.00
Torrent 0.97d 970.00
Landmark 0.65e 650.00
BBL 274 0.65e 650.00
CV (%) 7.22 16.42
Means with the same letter are not significantly different at 5% level by DMRT.
Computed Seed Yield Per Hectare (kg)
Table 8 presents the computed seed yield per hectare of ten bush snapbean varieties evaluated. Based on statistical analysis, significant differences exist among varieties. Contender and Lipstican varieties had the heaviest seed yield per plot and per hectare followed by Maroon in the seed yield per plot and Greencrop, China 804, HAB 63, Torrent for the computed seed yield per hectare and the lowest were Landmark and BBL 274. This seed yield weight differences were accounted to their seed size differences.
Insect and Disease Incidence
Visual rating for the occurrence of bean rust and pod borer among ten varieties was done during the growth and reproductive stage. Due to the weekly application of insecticides and fungicide, it was observed that mostly all the varieties had no damage by pod borer and bean rust.
Return on Cash Expense
Table 9 presents the computed return on cash expense (ROCE) of the ten varieties of bush snapbeans evaluated which Contender had 240% as the highest followed by the Lipstican with 209.97%. The lowest was obtained from BBL 274 with a negative ROCE of -05.00%. This high ROCE indicated by Contender was the result of its high seed yield per hectare and the higher selling price per kg.
Table 9. Return on cash expense (ROCE) of ten bush snapbean varieties evaluated VARIETY TOTAL
COST OF PROD’N
SEED YIELD TON/HA
GROSS INCOME
NET INCOME
ROCE (%)
Greencrop 1760 2.20 3872.00 2112.00 120.00 Lipstican 1725 3.10 5347.05 3622.05 209.97 Maroon (check) 1725 2.65 4571.25 2846.25 165.00
Hab 323 1760 2.15 3784.00 2024.00 115.00 China 804 1725 1.70 2932.05 1207.05 69.97
Contender 1760 3.40 5984.00 4225.00 240.00 Hab 63 1760 2.05 3608.00 1848.00 105.00
Torrent 1760 1.70 2992.00 1232.00 70.00 Landmark 1760 1.15 2024.00 264.00 15.00 BBL (%) 1760 0.95 1672.00 -88.00 -05.00 -total expenses include land preparation, seeds, fertilizer and maintenance like weeding, irrigation, spraying and hilling-up.
-selling price; China 804, Maroon (check) and Lipstican = Php250.00/kg
-HAB 323, HAB63, Torrent, Landmark, Contender, Greencrop, BBL 274=Php320.00/kg
SUMMARY, CONCLUSIONS AND RECOMMENDATIONS
Summary
A total of ten bush snapbean varieties were evaluated for the growth and seed yield performance under Poblacion, Sablan, Benguet from March to June 2007.
No significant differences among treatments were noted on the number of days to emergence, number of days from planting to first harvesting to the last harvesting. While on the days to flowering, significant differences existed among the cultivars. Landmark variety had the latest while Maroon and Contender varieties were the earliest to flower.
Significant differences were noted on the number of flower per cluster, pods per cluster and days to pod setting. Maroon and China 804 varieties had the highest number of flowers and pods per cluster and BBL 274 had the lowest number of pods per cluster.
China 804 variety had the longest pods and the tallest plants. Significant differences were noted both on weight of marketable and non-marketable seed yield per plot. “Lipstican” and Contender varieties produced the highest weight followed by maroon while BBL variety had the lowest on marketable seed yield per plot. On the other hand, “Lipstican” variety produced the highest weight which is comparable with Contender and HAB 63 while HAB 323 had the lowest weight on non-marketable seed yield per plot.
As to computed seed yield per hectare, significant differences exist among the varieties. Contender and “Lipstican” varieties had the heaviest seed yield while Landmark and BBL 274 varieties had the lowest seed yield. Results on the return on cash expense (ROCE) shows that Contender and “Lipstican” varieties obtained the highest
percentage of 240% and 209.97% followed by maroon with165%. The lowest was obtained from BBL 274 with –05%.
On the occurrence of insects and disease incidence, varieties of bush snapbean are rated mild resistance to pod borer and bean rust. This could be due to the alternate application of insecticides and fungicides every week.
Conclusion
Not all varieties of bush snapbean had good response in terms of growth parameters and seed yield. “Lipstican” and Contender varieties produced the heaviest weight on marketable seed yield per plot. This indicates that these varieties are adapted under Poblacion, Sablan, Benguet condition.
Recommendation
Based on the results, varieties of “Lipstican” and Contender are recommended for seed yield production at Poblacion, Sablan, Benguet.
LITERATURE CITED
AP-APID, N.W. 1991. Optimum spacing requirement for seed production of pole snapbenas. BS. Thesis. Benguet State University, La Trinidad, Benguet Pp. 17-18.
AQUISISION, A.D. 1996. Varietal evaluation of advanced breeding lines of snapbeans.
BS Thesis. Benguet State University, La Trinidad, Benguet. Pp. 17-18.
ASEAN VEGETABLE RESEARCH DEVELOPMENT CENTER(AVRDC).1990.
Vegetable Production Training Manual. AVRDC Publication. Tainan Taiwan, ROC. P. 95.
BANTOG, N.A. 1993. Farm evaluation of promising lines and farmers production practices of pole snapbean in different evaluations. BS Thesis, BSU La Trinidad, Benguet. P. 39.
BAUTISTA, O.K. and R.G. MABESA 1997. Vegetable Production. Los Banos:
University of the Philippines Los Banos. P. 28.
BITAGA, R.D. 2002. Growth and yield performance of ten sweetpotato varieties in Beling-belis, Kapangan, Benguet. BSU La Trinidad, Benguet, Pp 3-4.
CELOY, I.W. 1999. The effect of frequency of fertilizer application on the growth and yield of pole snapbean. BS. Thesis. Benguet State University, :a Trinidad, Benguet. P.8.
GIBSON, M.S. 2003. Growth and yield performance of single plant selection in six strains of pole snapbeans cultivar ‘ALNO”. BS Thesis. BSU La Trinidad, Benguet P. 18.
HARRDEC. 1989. Snap bean Technoguide for the highlands. BSU La Trinidad, Benguet. Pp. 1-5
HARRDEC. 2000. Snap bean farmer production guide. BSU La Trinidad, Benguet.
Pp.1-8.
INGLES, E.M. 1990. Seed production of two snapbean cultivars as affected by plant density. BS Thesis. Benguet State Univaersity, La Trinidad, Benguet.
KUDAN, S.L. 1991. How to grow snap bean. Department of Crop Science. BSU La Trinidad, Benguet Technical Bulletin Number 4. Pp. 18-21.
LOAKAN, M.S. 2003. Evaluation of Alno-derive selections of snap bean obtained from different sources in Benguet B.S Thesis, BSU La Trinidad, Benguet. Pp.1-11.
PACHER, S. 2002. Kitchen garden about snapbeans. http://www.motherearthnews.com PCARRD. 1983. Vegetable Legume Research. Los Banos: University of the Philippines
Los Banos. P. 28.
PCARRD. 1989. Snapbean technoguide for the highlands. First Edition. BSU, La Trinidad, Benguet. Pp.1-5.
PURSEGLOVE J.W. 1978. Tropical Crops Dicotyledon. University of the West Indies, St. Agustin Trinidad. P. 297.
REGMI. S.K. 1990. Varietal Evaluation of promising lines and path coefficient analysis in pole snapbean. MS Thesis. BSU, La Trinidad Benguet. Pp. 39-40.
REILY H.E and SHRY L.C.JR. 1991. Introductory Horticulture. New York: Delmar publishers, Inc. P.562.
SUNIL, R.R. 1990. Varietal evaluation of promising lines and path coefficient analysis in Pole snapbeans. BS Thesis. BSU, LTB. P.86
WARE G.W. and SWIADER J.M. 2002. Producing Vegetables Crops. U.S.A: the Interstate printers and publishers, Inc. Pp. 252-253.
APPENDICES
Appendix Table 1. Days to emergence
VARIETY REPLICATION TOTAL MEAN
I II III
Greencrop 6 6 6 18 6
Lipstican 7 7 7 21 7
Maroon 6 6 6 18 6
Hab 323 7 7 7 21 7
China 804 6 6 6 18 6
Contender 7 7 7 21 7
Hab 63 7 7 7 21 7
Torrent 7 7 7 21 7
Landmark 8 8 8 24 8
BBL 274 8 8 8 24 8
TOTAL 69 69 69 207 69
Appendix Table 2. Number of days to flowering
VARIETY REPLICATION TOTAL MEAN
I II III
Greencrop 33 33 33 99 33b
Lipstican 30 31 30 91 30e
Maroon 30 30 30 90 30e
Hab 323 32 31 32 95 32c
China 804 30 31 31 92 31d
Contender 30 30 30 90 30e
Hab 63 32 32 31 95 32c
Torrent 31 31 30 92 31d
Landmark 34 34 34 102 34a
BBL 274 31 31 31 93 31d
TOTAL 313 314 312 939 314
ANALYSIS OF VARIANCE
SOURCE DEGREES SUM OF MEAN OF COMPUTED TABULAR
OF OF SQUARES SQUARES F F
VARIANCE FREEDOM
Block 2 0.200 0.100
Variety 9 46.967 5.219 29.98** 2.46 3.60
Error 18 3.133. 0.174
TOTAL 29 50.300
Appendix Table 3. Number of days from planting to first harvest
VARIETY REPLICATION TOTAL MEAN
I II III
Greencrop 65 65 65 195 65
Lipstican 65 65 65 195 65
Maroon 64 64 64 192 64
Hab 323 70 70 70 210 70
China 804 64 64 64 192 64
Contender 64 64 64 192 64
Hab 63 69 69 69 207 69
Torrent 68 68 68 204 68
Landmark 70 70 70 210 70
BBL 274 71 71 71 213 71
TOTAL 670 670 670 2010 670
Appendix Table 4.Number of days from planting to last harvest
VARIETY REPLICATION TOTAL MEAN
I II III
Greencrop 79 79 79 237 79
Lipstican 82 82 82 246 82
Maroon 83 83 83 249 83
Hab 323 80 80 80 240 80
China 804 78 78 78 234 78
Contender 83 83 83 249 83
Hab 63 80 80 80 240 80
Torrent 82 82 82 246 82
Landmark 83 83 83 249 83
BBL 274 86 86 86 258 86
TOTAL 816 816 816 2448 816
Appendix Table 5. Number of days to maturity
VARIETY REPLICATION TOTAL MEAN
I II III
Greencrop 61 61 61 183 61
Lipstican 60 60 60 180 60
Maroon 59 59 59 177 59
Hab 323 62 62 62 186 62
China 804 60 60 60 180 60
Contender 58 58 58 174 58
Hab 63 61 61 61 183 61
Torrent 62 62 62 186 62
Landmark 64 64 64 192 64
BBL 274 64 64 64 192 64
TOTAL 611 611 611 1833 611
Appendix Table 6. Plant height at maturity (cm)
VARIETY REPLICATION TOTAL MEAN
I II III
Greencrop 54 58 56 168 56.00ef Lipstican 56 62 60 178 59.33cd Maroon 57 55 55 167 55.67efg Hab 323 58 55 57 170 56.67def China 804 63 65 67 195 65.00a Contender 54 54 54 162 54.00fg Hab 63 60 60 60 180 60.00bc Torrent 62 64 61 187 62.33b Landmark 53 54 52 159 53.00g BBL 274 57 58 59 174 58.00cde
TOTAL 574 585 581 1740 580.00
ANALYSIS OF VARIANCE
SOURCE DEGREES SUM OF MEAN OF COMPUTED TABULAR F OF OF SQUARES SQUARES F 0.05 0.01 VARIANCE FREEDOM
Block 2 6.200 3.100
Variety 9 377.333 41.926 16.97** 2.46 3.60 Error 18 44.467 2.470
Total 29 428.000
**- highly significant Coefficient of Variance = 2.71%
Appendix Table 7. Number of flowers per cluster
VARIETY REPLICATION TOTAL MEAN
I II III
Greencrop 5 6 5 16 5b
Lipstican 7 5 6 18 6ab
Maroon 7 7 8 22 7a
Hab 323 6 6 6 18 6ab
China 804 7 8 7 22 7a
Contender 7 6 6 19 6ab
Hab 63 6 6 5 17 6ab
Torrent 5 6 5 16 5b
Landmark 5 5 6 16 5b
BBL 274 4 5 5 14 5b
TOTAL 59 60 59 178 59
ANALYSIS OF VARIANCE
SOURCE DEGREES SUM OF MEAN OF COMPUTED TABULAR F OF OF SQUARES SQUARES F 0.05 0.01 VARIANCE FREEDOM
Block 2 0.067 0.033
Variety 9 20.533 2.281 5.65** 2.46 3.60 Error 18 7.267 0.404
TOTAL 29 27.867
** -highly significant Coefficient of Variance = 10.71%
Appendix Table 8. Number of days to pod setting
VARIETY REPLICATION TOTAL MEAN
I II III
Greencrop 39 39 39 117 39b
Lipstican 37 37 37 111 37d
Maroon 36 36 36 108 36e
Hab 323 38 38 37 113 38c
China 804 35 37 37 109 36e Contender 35 35 35 105 35f
Hab 63 39 40 39 118 39b
Torrent 39 38 38 115 38c
Landmark 40 40 40 120 40a
BBL 274 38 38 38 114 38c
TOTAL 376 378 376 1130 377
ANALYSIS OF VARIANCE
SOURCE DEGREES SUM OF MEAN OF COMPUTED TABULAR F OF OF SQUARES SQUARES F 0.05 0.01 VARIANCE FREEDOM
Block 2 0.267 0.133
Variety 9 68.000 7.556 30.91** 2.46 3.60 Error 18 4.400 0.244
TOTAL 29 72.667
** -highly significant Coefficient of Variance = 1.31%
Appendix Table 9. Number of pods per cluster
VARIETY REPLICATION TOTAL MEAN
I II III
Greencrop 4 4 4 12 4bc
Lipstican 6 4 5 15 5b
Maroon 6 6 5 17 6a
Hab 323 5 5 5 15 5b
China 804 6 6 6 18 6a
Contender 5 5 5 15 5b
Hab 63 5 5 4 14 5b
Torrent 4 5 3 12 4bc
Landmark 3 4 4 11 4bc
BBL 274 3 4 3 10 3c
TOTAL 47 48 44 139 46
ANALYSIS OF VARIANCE
SOURCE DEGREES SUM OF MEAN OF COMPUTED TABULAR F OF OF SQUARES SQUARES F 0.05 0.01 VARIANCE FREEDOM
Block 2 0.867 0.433
Variety 9 20.300 2.256 7.00** 2.46 3.60 Error 18 5.800 0.322
TOTAL 29 26.967
** -highly significant Coefficient of Variance = 12.25%
Appendix Table 10. Number of cluster per plant
VARIETY REPLICATION TOTAL MEAN
I II III
Greencrop 3 3 2 8 3
Lipstican 3 3 3 9 3
Maroon 3 3 4 10 3
Hab 323 3 3 3 9 3
China 804 4 3 3 10 3
Contender 3 4 3 10 3
Hab 63 3 3 3 9 3
Torrent 2 3 2 7 2
Landmark 2 2 3 7 2
BBL 274 3 3 3 9 3
TOTAL 29 30 29 88 29
ANALYSIS OF VARIANCE
SOURCE DEGREES SUM OF MEAN OF COMPUTED TABULAR F OF OF SQUARES SQUARES F 0.05 0.01 VARIANCE FREEDOM
Block 2 0.067 0.033
Variety 9 3.867 0.430 1.97ns 2.46 3.60 Error 18 3.933 0.219
TOTAL 29 7.867
ns –not significant Coefficient of Variance = 15.94%
Appendix Table 11. Percentage pod set (%).
VARIETY REPLICATION TOTAL MEAN
I II III
Greencrop 80.00 66.67 80.00 226.67 75.56 Lipstican 85.71 80.00 83.33 249.04 83.01 Maroon 85.71 85.71 83.33 254.75 84.92 Hab 323 83.33 83.33 83.33 249.99 83.33 China 804 75.00 85.71 85.71 246.42 82.14 Contender 71.43 83.33 83.33 238.09 79.36 Hab 63 83.33 83.33 80.00 246.66 82.22 Torrent 80.00 83.33 60.00 223.33 74.44 Landmark 60.00 80.00 66.67 206.67 68.89 BBL 274 75.00 80.00 60.00 215.00 71.67 TOTAL 779.51 811.41 765.70 2356.62 785.54
ANALYSIS OF VARIANCE
SOURCE DEGREES SUM OF MEAN OF COMPUTED TABULAR F OF OF SQUARES SQUARES F 0.05 0.01 VARIANCE FREEDOM
Block 2 109.924 54.962
Variety 9 830.530 92.281 1.75ns 2.46 3.60 Error 18 949.551 52.753
TOTAL 29 1890.005
ns –not significant Coefficient of Variance = 9.25%
Appendix Table 12. Number of pods per plant
VARIETY REPLICATION TOTAL MEAN
I II III
Greencrop 9 9 10 28 9d
Lipstican 10 10 10 30 10c
Maroon 11 10 11 32 11b
Hab 323 8 10 9 27 9d
China 804 12 12 12 36 12a
Contender 11 11 11 33 11b
Hab 63 7 9 9 25 8e
Torrent 7 8 7 22 7f
Landmark 7 7 7 21 7f
BBL 274 7 7 7 21 7f
TOTAL 89 93 93 275 92
ANALYSIS OF VARIANCE
SOURCE DEGREES SUM OF MEAN OF COMPUTED TABULAR F OF OF SQUARES SQUARES F 0.05 0.01 VARIANCE FREEDOM
Block 2 1.067 0.533
Variety 9 83.500 9.728 29.82** 2.46 3.60 Error 18 5.600 0.311
TOTAL 29 90.167
** -highly significant Coefficient of Variance = 6.00%
Appendix Table 13. Length of pods at harvest (cm).
VARIETY REPLICATION TOTAL MEAN
I II III
Greencrop 16 17 16 49 16.33a Lipstican 15 15 17 47 15.67ab Maroon 14 15 15 44 14.67bc
Hab 323 13 12 12 37 12.33e
China 804 17 16 17 50 16.67a Contender 16 16 16 48 16.00a Hab 63 14 12 13 39 13.00de Torrent 13 13 14 40 13.33de Landmark 14 14 14 42 14.00bc BBL 274 13 15 12 40 13.33de
TOTAL 145 145 146 436 145.33
ANALYSIS OF VARIANCE
SOURCE DEGREES SUM OF MEAN OF COMPUTED TABULAR F OF OF SQUARES SQUARES F 0.05 0.01 VARIANCE FREEDOM
Block 2 0.200 0.100
Variety 9 67.500 7.500 13.78** 2.46 3.60 Error 18 9.800 0.544
TOTAL 29 77.800
** -highly significant Coefficient of Variance = 5.09%
Appendix Table 14. Width of pods at harvest (cm).
VARIETY REPLICATION TOTAL MEAN
I II III
Greencrop 1.4 1.4 1.4 4.2 1.40a Lipstican 1.5 1.4 1.3 4.2 1.40a Maroon 1.2 1.3 1.3 3.8 1.27ab Hab 323 1.3 1.3 1.3 3.9 1.30ab China 804 1.0 1.2 1.1 3.3 1.10c Contender 1.4 1.3 1.5 4.2 1.40a Hab 63 1.2 1.4 1.2 3.8 1.27ab Torrent 1.3 1.5 1.2 4.0 1.33ab Landmark 1.2 1.2 1.3 3.7 1.23bc BBL 274 1.3 1.3 1.4 4.0 1.33ab
TOTAL 12.8 13.3 13.0 39.1 13.03
ANALYSIS OF VARIANCE
SOURCE DEGREES SUM OF MEAN OF COMPUTED TABULAR F OF OF SQUARES SQUARES F 0.05 0.01 VARIANCE FREEDOM
Block 2 0.009 0.004
Variety 9 0.199 0.022 3.03* 2.46 3.60 Error 18 0.131 0.007
TOTAL 29 0.339
* -significant Coefficient of Variance = 6.54%
Appendix Table 15. Weight of marketable seed yield per plot (kg).
VARIETY REPLICATION TOTAL MEAN
I II III
Greencrop 0.70 0.85 0.65 2.20 0.73c Lipstican 1.15 1.05 0.90 3.10 1.03a Maroon 0.80 0.95 0.90 2.65 0.88b Hab 323 0.75 0.65 0.75 2.15 0.72c China 804 0.55 0.60 0.55 1.70 0.57d Contender 1.10 1.25 1.05 3.40 1.13a Hab 63 0.70 0.75 0.60 2.05 0.68cd Torrent 0.60 0.55 0.55 1.70 0.57d Landmark 0.40 0.35 0.40 1.15 0.38e BBL 274 0.35 0.30 0.30 0.95 0.32e TOTAL 7.10 7.30 6.65 21.05 7.02
ANALYSIS OF VARIANCE
SOURCE DEGREES SUM OF MEAN OF COMPUTED TABULAR F OF OF SQUARES SQUARES F 0.05 0.01 VARIANCE FREEDOM
Block 2 0.022 0.011
Variety 9 1.851 0.206 45.36** 2.46 3.60 Error 18 0.090 0.005
TOTAL 29 1.963
** -highly significant Coefficient of Variance = 10.05%
Appendix Table 16. Weight of non-marketable seed yield per plot (kg).
VARIETY REPLICATION TOTAL MEAN
I II III
Greencrop 0.35 0.35 0.50 1.20 0.40bc Lipstican 0.50 0.50 0.55 1.55 0.52a Maroon 0.25 0.35 0.30 0.90 0.30cd Hab 323 0.20 0.25 0.20 0.65 0.22d China 804 0.50 0.45 0.55 1.50 0.50ab Contender 0.45 0.45 0.60 1.50 0.50ab Hab 63 0.40 0.20 0.35 0.95 0.32cd Torrent 0.40 0.35 0.45 1.20 0.40bc Landmark 0.25 0.25 0.30 0.80 0.27d BBL 274 0.30 0.40 0.30 1.00 0.33cd TOTAL 3.60 3.55 4.10 11.25 3.75
ANALYSIS OF VARIANCE
SOURCE DEGREES SUM OF MEAN OF COMPUTED TABULAR F OF OF SQUARES SQUARES F 0.05 0.01 VARIANCE FREEDOM
Block 2 0.021 0.010
Variety 9 0.289 0.032 8.97** 2.46 3.60 Error 18 0.064 0.004
TOTAL 29 0.374
** -highly significant Coefficient of Variance = 16.01%
Appendix Table 17. Number of seeds per pod
VARIETY REPLICATION TOTAL MEAN
I II III
Greencrop 5 5 5 15 5b
Lipstican 5 5 5 15 5b
Maroon 6 5 6 17 6a
Hab 323 5 6 6 17 6a
China 804 6 7 6 19 6a
Contender 6 6 6 18 6a
Hab 63 6 6 6 18 6a
Torrent 5 5 5 15 5b
Landmark 5 5 4 14 5b
BBL 274 5 4 5 14 5b
TOTAL 54 54 54 162 54
ANALYSIS OF VARIANCE
SOURCE DEGREES SUM OF MEAN OF COMPUTED TABULAR F OF OF SQUARES SQUARES F 0.05 0.01 VARIANCE FREEDOM
Block 2 0.000 0.000
Variety 9 9.867 1.096 5.92** 2.46 3.60 Error 18 3.333 0.185
TOTAL 29 13.200
** -highly significant Coefficient of Variance = 7.97%
Appendix Table 18. Total seed yield per plot (kg)
VARIETY REPLICATION TOTAL MEAN
I II III
Greencrop 1.05 1.20 1.15 3.40 1.13bc Lipstican 1.65 1.55 1.45 4.65 1.55a Maroon 1.05 1.30 1.20 3.55 1.18b Hab 323 0.95 0.90 0.95 2.80 0.93d China 804 1.05 1.05 1.10 3.20 1.07bcd Contender 1.55 1.70 1.65 4.90 1.63a Hab 63 1.10 0.95 0.95 3.00 1.00cd Torrent 1.00 0.90 1.00 2.90 0.97d Landmark 0.65 0.60 0.70 1.95 0.65e BBL 274 0.65 0.70 0.60 1.95 0.65e
TOTAL 10.70 10.85 10.75 32.30 10.77
ANALYSIS OF VARIANCE
SOURCE DEGREES SUM OF MEAN OF COMPUTED TABULAR F OF OF SQUARES SQUARES F 0.05 0.01 VARIANCE FREEDOM
Block 2 0.001 0.001
Variety 9 2.854 0.317 52.44** 2.46 3.60 Error 18 0.109 0.006
TOTAL 29 2.964
** -highly significant Coefficient of Variance = 7.22%
Appendix Table 19. Computed yield per hectare (kg).
VARIETY REPLICATION TOTAL MEAN
I II III
Greencrop 1050 1200 1150 3400 1133.33 Lipstican 1650 1550 1450 4650 1550.00 Maroon 1050 1300 1200 3550 1183.33 Hab 323 950 900 950 2800 933.33b China 804 1050 1050 1100 3200 1066.67 Contender 1550 1700 1650 4900 1633.33 Hab 63 1100 950 950 3000 1000.00 Torrent 1000 900 1000 2900 966.67 Landmark 650 600 700 1950 650.00 BBL 274 650 700 600 1950 650.00 TOTAL 10700 10850 10750 32300 1066.67
ANALYSIS OF VARIANCE
SOURCE DEGREES SUM OF MEAN OF COMPUTED TABULAR F OF OF SQUARES SQUARES F 0.05 0.01 VARIANCE FREEDOM
Block 2 58166.667 29083.033
Variety 9 3294666.667 366073.074 12.39** 2.46 3.60 Error 18 531833.333 29546.296
TOTAL 29 3884666.667
** -highly significant Coefficient of Variance = 16.42%