THE IMPACT OF INTRA-INDUSTRY DIVERSIFICATION ON FIRM PERFORMANCE
VARAPORN PANGBOONYANON
A THESIS SUBMITTED IN PARTIAL FULFILLMENT OF THE REQUIREMENTS FOR
THE DEGREE OF MASTER OF MANAGEMENT (ENTREPRENEURSHIP MANAGEMENT)
COLLEGE OF MANAGEMENT MAHIDOL UNIVERSITY
2016
COPYRIGHT OF MAHIDOL UNIVERSITY
Thesis entitled
THE IMPACT OF INTRA-INDUSTRY DIVERSIFICATION ON FIRM PERFORMANCE
………
Kiattichai Kalasin, Ph.D.
Co-Advisor
………
Ms. Varaporn Pangboonyanon Candidate
………
Asst. Prof. Winai Wongsurawat, Ph.D.
Advisor
………
Asst. Prof. Prattana Punnakitikashem, Ph.D.
Chairperson
………
Assoc. Prof. Annop Tanlamai, Ph.D.
Dean
College of Management Mahidol University
………
Asst. Prof. Pornkasem Kantamara, Ed.D.
Committee member
Thesis entitled
THE IMPACT OF INTRA-INDUSTRY DIVERSIFICATION ON FIRM PERFORMANCE
was submitted to the College of Management, Mahidol University for the degree of Master of Management (Entrepreneurship Management)
on August 3, 2016
………
Kiattichai Kalasin, Ph.D.
Co-Advisor
………
Ms. Varaporn Pangboonyanon Candidate
………
Asst. Prof. Winai Wongsurawat, Ph.D.
Advisor
………
Asst. Prof. Prattana Punnakitikashem, Ph.D.
Chairperson
………
Assoc. Prof. Annop Tanlamai, Ph.D.
Dean
College of Management Mahidol University
………
Asst. Prof. Pornkasem Kantamara, Ed.D.
Committee member
ACKNOWLEDGEMENTS
I am grateful to my supervisor, Kiattichai Kalasin, Ph.D., whose expertise, understanding, generous, guidance and support made it possible for me to work on the topic that was of great intereset to me. It was a pleasure working with him
I would like to thank you committee members, Asst. Prof. Winai Wongsurawat, Ph.D., Asst. Prof. Pornkasem Kantamara, Ed.D., and Asst. Prof.
Prattana Punnakitikashem, Ph.D., to give opportunity and suggestions for me to be able to complete my thesis and degree.
I would like to thank you my friends and family who always encourage me and be very supportive toward this journey. I would not been able to complete this thesis without their countinuous love and encouragement.
Finally I would like to express my gratitude to all my teachers, all the working team of College of Management, Mahidol University who put a lot of effort to educate and support me throughout this academic exploration.
Varaporn Pangboonyanon
THE IMPACT OF INTRA-INDUSTRY DIVERSIFICATION ON FIRM PERFORMANCE
VARAPORN PANGBOONYANON 5449062
M.M. (ENTREPRENEURSHIP MANAGEMENT)
THESIS ADVISORY COMMITTEE: Asst. Prof. Winai Wongsurawat, Ph.D., Asst.
Prof. Prattana Punnakitikashem, Ph.D., Asst. Prof. Pornkasem Kantamara, Ed.D., Kiattichai Kalasin, Ph.D.
ABSTRACT
We study how intra-industry diversification affects firms’ performances.
In contrast to existing literature that suggest a non-linear relationship between intra- industry diversification and performance, we draw on resource-based view and degree of industry competition and argue that that this relationship follows a negative, linear pattern. The benefits of intra-industry diversification are limited when non-tech firms expand into traditional industry, where the competition is strong. We further argue that the benefits of intra-industry diversification for start-up firms in developing economies are higher than those in advanced economies. Because of institutional voids in developing economies, start-up firms can expand into new market space, improving the benefits of intra-industry diversification. We test hypotheses on 3,820 firms from South-east and East Asia, during 2009 to 2014 using panel data regression to estimate our model. Results provide support to our arguments.
KEYWORDS: intra-industry diversification/ high-tech and non-tech firms/
performance/ developing economies/ start-up firms
46 pages
CONTENTS
Page ACKNOWLEDGEMENTS iii
LIST OF TABLES vii
LIST OF FIGURES viii
CHAPTER I INTRODUCTION 1
1.1 Background 1
1.2 Research question 2
1.3 Methodology 2
1.4 Research contributions 3
1.5 Structure of the thesis 3
CHAPTER II LITERATURE REVIEW, AND HYPOTHESES
DEVELOPMENT 4
2.1 Literature review 4
2.2 Theoretical Development and hypotheses 7
2.2.1 Benefit of intra-industry diversification 7 2.2.2 Intra-industry diversification: Positive and negative effects
and firm performance 9
2.2.3 Strategic posture of start-up firms and the combination concepts between intra-industry diversification and
institutional voids 13
2.2.4 Institutional voids in Developing Economies 15
CHAPTER III RESEARCH METHODOLOGY 18
3.1 Sample selection 18
3.2 Variable measurement 19
CONTENTS (cont.)
Page
3.2.1 Dependent Variable 19
3.2.2 Independent Variable 20
3.2.3 Moderating Variables 22
3.2.4 Control Variables 23
3.3 Estimation 25
3.3.1 Panel Data 25
3.3.2 Static Model 25
CHAPTER IV EMPIRICAL RESULTS 28
4.1 Correlations 28
4.2 Static analysis 30
CHAPTER V CONCLUSION 36
5.1 Discussion 36
5.1.1 Synthesis of Findings 36
5.1.2 Contributions 37
5.1.3 Managerial Implications 38
5.1.4 Limitations and Future Research 39
5.2 Conclusion 39
REFERENCES 40 BIOGRAPHY 46
LIST OF TABLES
Table Page 3.1 Details number of firm types in each country 19 4.1 Pearson correlation coefficients between variables 29 4.2 Panel-data regression - Results for sales growth of South-East and East Asian
firms with concentric index 32
4.3 Panel-data regression - Results for sales growth of South-East and East Asian
firms with entropy index 33
4.4 Panel-data regression - Results for sales growth of South-East and East Asian firms with concentric and entropy indexes of start-up firms in advanced
economies 35
LIST OF FIGURES
Figure Page 2.1 U-shaped relation between firm performance and intra-industry diversification 5
2.2 S-shaped relation between firm performance and intra-industry diversification 6 2.3 Positive and negative relation between firm performance and intra-industry
diversification 9 2.4 Relationship between firm performance and intra-industry diversity in developing
economies 17
CHAPTER I INTRODUCTION
1.1 Background
Research in strategic management has extensively studied diversification to new businesses. Until recently, research in intra-industry diversification has gained attention from strategy scholars (Zahavi and Lavie 2013, Colombo, Piva et al. 2014, Hashai 2015). Existing literature argue that, by adopting intra-industry diversification strategy, firms can increase their performances by gaining the benefits of economies of scope while minimizing the coordination and adjustment costs and limiting irrelevant knowledge transfer (Zahavi and Lavie 2013, Hashai 2015). Nevertheless, existing literatures gave mixed results of intra-industry diversification associated with firm’s performance (Hashai, 2015). While Zahavi and Lavie (2013) found a U-curve relationship between intra-industry diversification and sales growth, Hashai (2015) found a S-curve pattern. Moreover, most of them have not concentrated in applying intra-industry diversification in term of strategy for new market space establishment.
To solve this puzzle, we argue that the performance of a firm is a proxy of within-industry benefits and adjustment and coordination cost. Since, existing literature have not incorporate the relative capabilities of firm to its competitors, when they enter into related market, we argue that the intra-industry diversification benefits disappear rapidly, when strong competitor is present especially in non-tech industry.
On the contrary, the coordination costs and adjustment costs exist, undermining performance of firm. Therefore, we propose that intra-industry diversification has a negative impact on firm performance.
In addition, we further investigate more of the influences in two different environments, i.e. developing and advance economies. With the institution void in developing economies, i.e., markets, financial markets, labor markets, lacking of necessary laws and regulations, and inconsistent enforcement of contracts (Hoskisson, Eden et al. 2000, Cuervo-Cazurra and Genc 2008), diversification strategy is more
likely to be profitable in developing economies (Khanna and Palepu 1997, Mathews 2006, Guillén and García-Canal 2009).
We further investigate the intra-industry diversification in the start-up firms. Intra-diversity allows the small and new founded firms able to expand their market shares in their professionals. Operating in single primary core industry allows firms to understand more customers’ needs and operate in more than one market niche which gain more customer satisfaction, and be able to develop stronger relationship with the customers. This is a much more recurring relationship that can really benefit the business in the long run. In additional, the start-up firms have limited resource so they have little choice but to focus on a small segment of the product market because of limited financial or organizational capital (Mosakowski 1993). The strategy benefits firms to focus to seek variety of product lines in order to meet customers’
requirements, and be specialized to offer product expertise fitted better to their businesses. It offers market niches to small groups of customers. It therefore can penetrate to the markets with no attention from big players since the established firms normally concentrate more on big customers and their current customers as discussed in (Christensen and Bower 1996, Katila 2012).
1.2 Research question
What is the impact of intra-industry diversification on firm performance?
1.3 Methodology
We test our predictions on a sample of 3820 firms from eight different South-east and East Asian countries in both high-tech and non-tech industries which expands beyond existing studies. Regarding developing and advanced economies, Singapore, Hong Kong and Taiwan are considered as advanced economies, and Indonesia, Malaysia, Philippines, Thailand and Vietnam are considered as developing economies.
Most of previous studies (Hashai, 2015, Colombo, Piva, & Rossi-Lamastra, 2014, Zahavi and Lavie (2013), only high-tech firms were tested since high-tech firms
penetrate new product categories to sustain growth (Hashai, 2015). This group of firms is also quite homogenous in terms of its strategic motivations for making product category expansions, hence increasing the likelihood of finding a systematic relationship between within-industry diversification and performance (Hashai, 2015).
We find a negative relationship between intra-industry diversification and performance. We also find that originating in emerging markets can attenuate the negative relationship between the intra-industry diversification and firm performance.
1.4 Research contributions
This study contributes to following areas. Firstly, this paper contributes to the literature on intra-industry diversification. By integrating the degree of competition and non-tech industry into account, the benefits from intra-industry diversification disappear. The non-linear relationship may not transferable to non-tech sectors.
Second, by taking the stage of firm development and institutional voids into account, start-up firms from emerging markets that employed intra-industry diversification tend to perform better than those from advanced economies.
1.5 Structure of the thesis
The next chapter reviews the theoretical and empirical studies on the topic, and develops hypothesis based on the theoretical and empirical arguments presented in the literature review. The third chapter describes data collection procedure and variables measurement, research models and estimation methodology. The fourth chapter details the research results. The last chapter is the conclusion and discussion with suggested future works.
CHAPTER II
LITERATURE REVIEW, AND HYPOTHESES DEVELOPMENT
2.1 Literature review
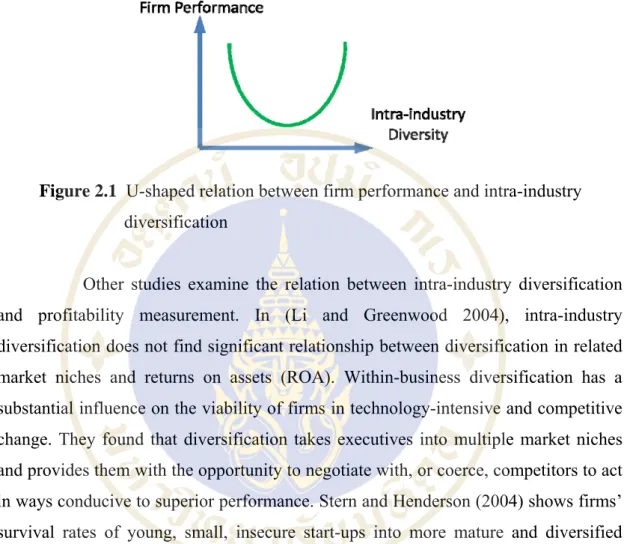
Intra-industry diversification entails a firm’s present in more than one product line or market niches within a single industry (Stern and Henderson, 2004; Stan Xiao and Greenwood 2004). The study findings on the relation between intra- industry diversification and firm performance vary greatly based on performance measurement. One set of studies focuses sales growth as performance measurement. In (Tanriverdİ and Lee 2008), within-industry diversification in software development industry is characterized by production relatedness which can benefit from resource- based synergy, i.e., sharing common development skill and know-how, maintenance and renewal resources and consumption relatedness which enables marketing and advertising cost reduction by redeploying marketing expertise, brands and sales forces in multiple product-markets. They revealed that software firms’ within-industry diversification of “platform” scope (i.e. the range of operating systems that applications serve) and the within-industry diversification of “product market” scope (i.e. the range of applications the firm offers) are both negatively associated with sales growth. However, by implementing only one of them gives negative effects in the firm’s sales growth rather it suggests to implement the combination of them which increases firm’s sales growth and market shares. In (Zahavi and Lavie 2013), telling that firm performance exhibit a U-shaped (Figure 2.1) association with intra-industry product diversity, i.e., initially decrease and then increase with extent of diversity. The reduction of sales growth at low within-industry diversification levels is because of negative transfer of the imperfect replication of activities between highly similar, yet sufficiently different products. While the sales growth increment at the higher within- industry diversification levels is because economies of scope and greater product dissimilarity allow sales to increase as the firm further expands its product scope.
Moreover, the U-shaped is strengthened by firm’s intensity of investment in technology but attenuated by firm’s prior diversification experience.
Figure 2.1 U-shaped relation between firm performance and intra-industry diversification
Other studies examine the relation between intra-industry diversification and profitability measurement. In (Li and Greenwood 2004), intra-industry diversification does not find significant relationship between diversification in related market niches and returns on assets (ROA). Within-business diversification has a substantial influence on the viability of firms in technology-intensive and competitive change. They found that diversification takes executives into multiple market niches and provides them with the opportunity to negotiate with, or coerce, competitors to act in ways conducive to superior performance. Stern and Henderson (2004) shows firms’
survival rates of young, small, insecure start-ups into more mature and diversified organization to introduce new product inside its primary line is partially associated with the aggregate number of new product introductions by competitors. In (Hashai, 2015), the result presents the relationship between intra-industry diversification and firm performance at different levels and change rates of intra-industry diversification.
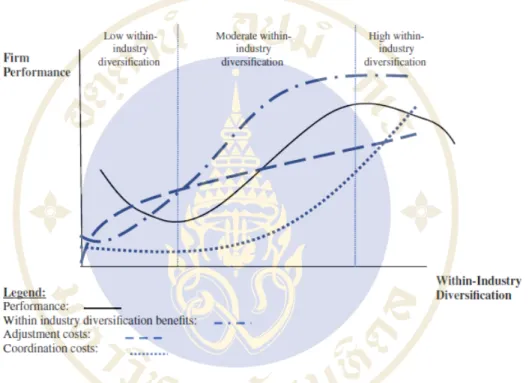
Returns on sales (ROS) are considered as firm performance. The study examines how adjustment and coordination costs influence the firm performance along with the change rates of intra-industry diversification. The performance is low at low level of diversification since adjustment costs are likely to increase more rapidly than the modest increase in the benefits of within-industry diversification. Along with the diversification level increase, at moderate levels of within-industry diversification, the
benefits of product scope expansion are therefore likely to be higher and increase more rapidly than the sum of corresponding adaptation and coordination costs, leading to performance increase. At high diversification level, the sum of adjustment and coordination costs to surpass the corresponding benefits of within-industry diversification, hence, reducing firm performance. Finally, at very high level of diversification, the performance continues to be negative relation because it is likely to be outweighed by a more substantial increase in both adjustment and coordination costs. Therefore, the results are shown as S-shape as in Figure 2.2 below.
Figure 2.2 S-shaped relation between firm performance and intra-industry diversification
Another set of literatures studies market exit and firm survival. Stern and Henderson (2004) shows firms’ survival rates of young, small, insecure start-ups firms in technology-intensive industries into more mature and diversified organization to introduce new product inside its primary line is partially associated with the aggregate number of new product introductions by competitors. They found that in the personal computer industry, the degree of within-industry diversification as well as the introduction rate of new products is both negatively correlated with firm failure rates (defined as market exit or death). The results show the link between diversification and performance is moderated by the amount of technological and competitive change
taking place in a firm’s environment due to simultaneous diversification moves by its competitors.
In sum, the prior studies on intra-industry diversification and firms’
performances gave mixed results. The scant research on the intra-industry diversification has not been investigated as strategy for young start-up firms. We examine benefits of expanding product diversity for the firms within a particular industry to expand their market shares in their professionals. We seek to advance this research by examining in two different environments, i.e., in developing and advance economies. We further advance the study how intra-industry product diversity vary in non-tech industries which most of the prior studies examine only in high-tech industries (Hashai, 2015, Colombo, Piva, & Rossi-Lamastra, 2014, Zahavi and Lavie (2013).
2.2 Theoretical Development and hypotheses
2.2.1 Benefit of intra-industry diversification
The principal benefit of intra-industry diversification is economies of scope to share resource across product markets (Panzar and Willig 1981, Nayyar and Kazanjian 1993, Farjoun 1998, Shayne Gary 2005, Miller 2006). Resource relatedness, or the use of common resources in multiple businesses or multiple product lines within a single business, creates synergies in the form of economies of scope (Davis and Thomas 1993). When firm’s resources are abundant such as marketing and technological know-how, the firm has internal incentive to diversify to exploiting the excess resource in order to gain the benefits. When firms extend to related products, the opportunity to effectively re-deploy similar resources is increased. By mean of resource sharing, it has several forms, for example having a sales team selling complementary products, involving technologies and engineers in development of related products (Shayne Gary 2005), and using accumulated knowledge of another business (Nayyar and Kazanjian 1993, Tanriverdi and Venkatraman 2005). Re- deployment such sharing resources enable firms to exploit under-utilized resources
across related products and generate synergies (Gupta and Govindarajan 1986), which helps to reduce the cost and increase the product value. Resource can be redeployed when different products share similar input factors or customers (Li and Greenwood 2004). Regarding sharing resource across related product markets, it can generate economies of scope by offering opportunities for resource redeployment across the markets. For example, a firm’s familiarity with customer helps it to know customer needs to increase product quality when introducing related products to the same market (Tanriverdİ and Lee 2008).
The more extensive the diversity of related products offered by the firm within its industry boundaries the more opportunities it has for deploying resources across these products (Jones and Hill 1988) and the more likely these products are to offer complementary value to customers. As the level of intra-industry product diversity increases, economies of scope are expected to increase at an increasing rate (Jones and Hill 1988). Such a pattern is ascribed to resource redeployment and increased availability of opportunities for effective sharing of resources. Specifically, when a firm diversifies into a distinctive yet related product category, it can deploy similar personnel, R&D, and marketing assets as well as benefit from increased complementarities of its related products. Indeed, products belonging to the same product line are typically developed in the same location by the same team or by teams that maintain frequent face-to-face communication and leverage the same technologies (Stern and Henderson 2004), thus supporting economies of scope. Increases in intra- industry product diversity create opportunities for exercising economies of scope across an increasing range of related products, which can enhance firm performance.
In term of technologies and engineers, in the context of intra-industry diversification, developing products are expected to be based on unique technology to gain customer appreciation and deter imitation and substitution by competitors. With the developing of related products using the same technology, sharing knowledge and technology expertise is quite straightforward thus firms can effectively leverage their technology. On the other hand, when complex technologies involved, the sharing information across units can be challenging unless the units face similar problems and market conditions (Stern and Henderson 2004). In (Li and Greenwood 2004), diversification can reduce overall operating costs and induce economies of scope.
However, the benefits of economies of scope are limited at low level of intra-industry product diversity (Jones and Hill 1988) given the limitation of opportunity exploration to leverage the firm’s resources in distinctive market niches.
2.2.2 Intra-industry diversification: Positive and negative effects and firm performance
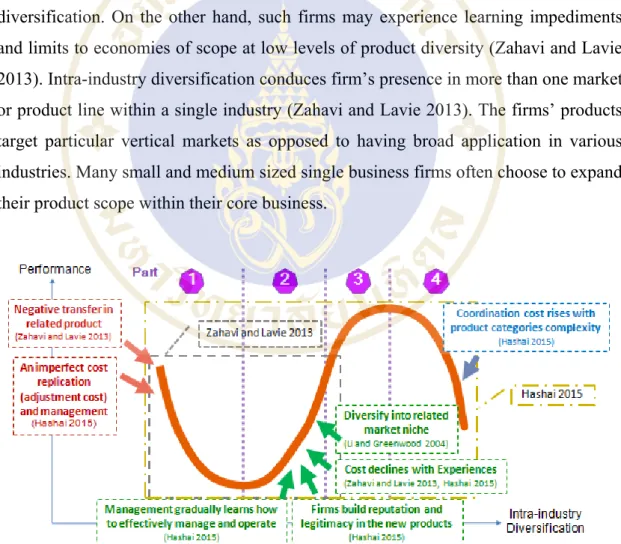
Studies on the relationship between inter-industry diversification and firm performance substantially differ for theoretical objection, definitions of performance and methodological reasons of how diversification improves performance. On the one hand, firms that diversify to product lines within their industry boundaries are unlikely to experience diseconomies of scope and organizational challenges typical of unrelated diversification. On the other hand, such firms may experience learning impediments and limits to economies of scope at low levels of product diversity (Zahavi and Lavie 2013). Intra-industry diversification conduces firm’s presence in more than one market or product line within a single industry (Zahavi and Lavie 2013). The firms’ products target particular vertical markets as opposed to having broad application in various industries. Many small and medium sized single business firms often choose to expand their product scope within their core business.
Figure 2.3 Positive and negative relation between firm performance and intra- industry diversification
Intra-industry diversification enables benefits of economies of scope as argued above to share resource across product markets (Tanriverdi and Venkatraman 2005, Tanriverdİ and Lee 2008).
As a result, there is limitation of diversity benefits from economies of scope at low level of intra-industry diversification. Even though the same employees, technologies, and marketing resources can be shared across closely related products, these products may have overlapping function. This limits complementary value of product relatedness. Such the overlapping may introduce resemble functionality to customers’ needs (same market segment). The new products may fail to gain complementarities or encounter cannibalization of products resemble their existing products (Zahavi and Lavie 2013). Moreover, economies of scope entail negative transfer, i.e., retrieval and reuse of knowledge (Levitt and March 1988). Since the intra-industry diversification products are in general similar, when confronts with similar and familiar tasks, individuals rely on analogy reasons and follow proven practices to carry on the tasks. Yet this leads to negative transfer of learned behavior even though the tasks are in fact distinct. The negative transfer is more at a low level of intra-industry diversification (Zahavi and Lavie 2013) where the differences of related products are subtle, so managers are likely to disregard them. Firms may blindly apply resources that have been assigned to support the core products rather than develop their unique methods to meet new product development needs and market requirements. In sum, the negative transfer is a significant factor for firms to have negative performance at low level of intra-industry diversification, Figure 2.3, part 1. Moreover, managers in a firm are likely to implement erroneously to similar products when attempting to introduce necessary technological adjustments. A firm with high technology intensity may fall in trap of local search (Ahuja and Lampert 2001). Local search is more engage when firms deploy related products. The managers may not be able to realize the distinction of similar problems. The failure to recognize subtle differences across related product categories is likely to increase when firms’
technological intensity increases.
Additionally, there is cost of transition from being a ‘single product focused’ firm to ‘multiproduct focused’ firms which is called as adjustment costs (Hashai 2015). Firms have limited rationality and cognitive scope (March 1991,
Levinthal and March 1993). They cannot adapt efficiently in complex situations.
Manager’s capability, time and effort can be limited to move from single product focus to multi-product focus. In inter-industry diversity has less effect since it is likely for them to apply decentralized solution which reduces complexity. Unlike inter- industry diversification, firms are unlikely to develop decentralized organizational structures especially in small and young firms. In sum, as the intra-industry diversification, firm is likely not to be able to avoid negative transfer, and also failure of management to recognize subtle differences across related product. Thus, the negative transfers are expected to accumulate at a decreasing rate with increase in intra-industry product diversity (Zahavi and Lavie 2013). At low levels of intra- industry diversification firms have virtually no supporting routines and knowledge base to efficiently transfer resources to new product categories and are further likely to bear the costs of imperfect replication. Firms are likely to have higher increasing of adjustment cost than the increasing rate of benefits from diversification. Therefore, firm’s performance is negative at low level of intra-industry diversification, Figure 2.3 part 1.
From the result tested with high-tech firms (Zahavi and Lavie 2013, Hashai 2015), i.e. software industry, when increasing intra-industry product diversity, the ramifications of applying inappropriate resources dominate the limited opportunities for exploiting economies of scope. As product diversity further increases, differences across product categories become apparent so that negative transfer can be mitigated while economies of scope become increasingly dominant, resulting in enhanced performance (Zahavi and Lavie 2013). Furthermore, intra- industry diversification firms are likely to bear the costs of imperfect replication of their existing operations in similar yet sufficiently different product categories within their core industry (Zahavi and Lavie 2013), Figure 2.3 part 2. In (Hashai 2015), at moderate levels of the firms, coordination costs, which are referred as costs related to sharing and creating linkages between products categories, are still not expected to become acute, adjustment s are expected to continue and increase the more diversified firms become within their core industry. Yet, the increase in adjustment costs likely to be moderated by the fact that some adaptation costs may in fact reduce. As firms become engaged in a greater number and variety of product categories, managers are
more likely to realize the distinct resources required for different product categories and apply a more nuanced management of operations in different product categories (Zahavi and Lavie 2013). Likewise, at such levels firms are likely to possess supporting routines and knowledge base to transfer resources to new product categories which may somewhat mitigate the rise in adjustment costs. The increase in the benefits of intra-industry diversification to be larger than the increase in adjustment costs. At moderate levels of intra-industry diversification, the benefits of product scope expansion are therefore likely to be higher and increase more rapidly than the sum of corresponding adaptation and coordination costs, leading to performance increase (Hashai 2015). In sum, the relation between intra-industry diversification and firms’ performances is somewhat having positive relation at some degree of intra-industry diversification, Figure 2.3 part 2 and 3. Moreover, (Hashai 2015) further discuss at high level of intra-industry diversification, firm’s performance is likely to decline. It is because resource sharing and linkage operation between related products at extensive range of product categories become very complex. The adjustment costs are continued and more importantly the coordination costs are likely to substantially intensify. The result shows the sum of adjustment and coordination costs to surpass the corresponding benefits of within-industry diversification, hence, reducing firm performance Figure 2.3 part 4.
However, we argue that this benefit of intra-industry diversification depends on firms’ relative capabilities and degree of competition in the new market.
(Stern and Henderson 2004) shows that the success or failure of related product introduction is substantially related to competitive intensity. Although firms can redeploy their capabilities in new market, market competition and strong rivals can undermine the effectiveness of the asset redeployment process. This is especially true in the case of non-tech sector, where the resources and capabilities that a firm possesses, may have been already acquired by their competitors. If not, these capabilities and resources can be imitated successfully in a short time (Barney 1991).
In resource based-view, the suggestion is that the benefits can be gained from the overly abundant resources which are being scare, valuable, inimitable, and unavailable (Wernerfelt 1984, Barney 1991, Markides and Williamson 1996). Moreover, these resources are usually firm specific which is difficult to be used by the others (Teece,
Pisano et al. 1997). As a result, economies of scope vary with the extent of product diversity and the VRIN (valuable, rare, inimitable, and non-substitutable) validity of resources and capabilities that firms possess (Barney 1991).
We further argue that the positive relation is only limited within software industry. In the industry, the characteristic of agile organization giving firms in the industry building teams based on specific projects, often resulting in flatter organizations than may be seen in other industries. The core organizational elements include increased transparency, a laser-like focus on aligning culture and mind-set, and clearly defined, common goals. A base level of software fluency will be a requirement for all levels, including upper management, in order to understand not only the core technologies but also the dynamics of working in a quick-turn, massively more connected, and digitized marketplace. Based on the characteristics, the negative transfer is limited by the flat structure and as the firms setting up teams based on precise tasks, manager are more likely to realize the distinction across related products. Moreover, with fast, dynamic, and flat structure natures, the firms have ability to adjust quickly when deploying a new product. These lead to positive relation between intra-industry diversification and firms’ performances in software industry at some level of intra-industry diversification. However, in other industries, i.e. non-tech firms, firms do not have such the characteristics. In sum, the level of competition compromises the benefits of intra-industry diversification. Apart from that, the firms gain the intra-industry diversification benefits at the expense of adjustment costs and coordination costs (Hashai 2015) and the negative transfer triggers imperfection replication of activities in highly similar, yet sufficiently different products leading to lower firm performance (Zahavi and Lavie 2013). This leads to following hypotheses:
Hypothesis1: Intra-industry diversification negatively relates to performance
2.2.3 Strategic posture of start-up firms and the combination concepts between intra-industry diversification and institutional voids
There are several researches investigating firms’ life-cycle. Many models were introduced. The most common models are composed of four or five stages of
organizational life-cycle (Greiner 1972, Miller and Friesen 1980, Quinn and Cameron 1983, Kazanjian 1988). Our literature is only focus on the start-up stage.
In our literature, we take the definition of start-up stage of (Kazanjian 1988). The definition is:
Given financial backing, new ventures go through a period during which their major focus is on developing the product or technology for commercialization. At this point, the organization largely resembles a new product-development team, with its problems and competences largely being technical. The focus is primarily on learning how to make the product work well and on how to produce it beyond the model shop prototype approach of the first stage (Galbraith 1982). In this stage, building an organizational task system becomes a consideration. By this time, discrete organizational functions like manufacturing and engineering have been formally created, and others are embryonic. The company has a product that performs well and meets a need in the marketplace. Firms have the capability to produce and sell but have yet to firmly establish the company in the market. The president/
entrepreneur is central to all functions and communications. The firm has some revenues and some backlog of orders.
Based on the finding of (Miller and Friesen 1984), since start-up phase firm is small and has no reputation, it must avoid direct confront with its competitive well established firm. It usually achieves by making a change of products or services which generate distinctive competences from its competitors. The firm in general has to create products or services innovation and pursuit of a niche strategy. Furthermore, the niche strategy will be abandoned once the firm goes to growth phase.
When a firm confronts with its rival, it drives organizational search and change (Cyert RM. and JG. 1963), and the selection favors firms whose internal routine develop to match with demands of its chosen (MT and GR 1992). Niche markets making start-up firms offer high satisfaction products to customers which is more likely for customers to bear the cost to get specialized products. It helps firms to be able to compete in the markets without fighting with pricing. In this way, it allows the firms to compete in the markets without fighting with low cost products
(Christensen and Bower 1996) which they will never really beat those big players and they have to put a lot of efforts to do so with limited resource and finance. Moreover, with the small market segment of focus strategy, the customers usually know each other. Firm’s reputation can be spread with word-of-mouth which helps to reduce advertising, marketing and branding costs. In (Li and Greenwood 2004, Stern and Henderson 2004), intra-industry diversification is way to redeploy resources in a single industry across several market niches. Sharing resources across many market niches within an industry is proportional small increasing cost (Li and Greenwood 2004). Moreover, they found that if firms diversify into related market niches within an industry, they have higher firm performance.
Hypothesis 2: The interaction effect between a start-up firm and intra- industry diversification positively relates to performance
2.2.4 Institutional voids in Developing Economies
Several studies propose that diversification strategy is more likely to be profitable in developing economies (Khanna and Palepu 1997, Mathews 2006, Guillén and García-Canal 2009). The key aspects of the argument are the institutional environment in developing economies by lacking of well-established product markets, financial markets, labor markets, lacking of necessary laws and regulations, and inconsistent enforcement of contracts (Hoskisson, Eden et al. 2000, Cuervo-Cazurra and Genc 2008). The greater diversification may not harm performance in emerging economies because of insufficient market and institutional development (Khanna and Palepu 1997).
The institutional perspective emphasizes the influence of systems surrounding organizations that shape social and organizational behavior argued that the internal growth of firms in emerging economies is limited by institutional constraints and, as a result, network-based (diversified) growth is expected to be more viable. Several other studies concur (Hoskisson, Eden et al. 2000, Wright, Filatotchev et al. 2005, Cuervo-Cazurra 2006, Cuervo-Cazurra and Genc 2008, Xu and Meyer 2013). The underlying argument is that, in emerging economies, intermediate institutions – such as financial and market intermediaries – are either inefficient or absent, and therefore diversified firms can gain scope and scale advantages from
internalizing. In institutionally developing economies, the absence or inefficiency of external intermediate institutions results in firms developing these institutions internally, which helps firms to lower their costs (Lins and Servaes 2002). Raising funds internally not only reduces transaction costs, but also gives the firm the ability to shift capital within the firm to where it is expected to bring the greatest returns. Thus, internalization in less developed institutional environments would bring about greater net marginal benefits (Khanna and Palepu 1997).
On the other hand, in advanced economies, those intermediate functions typically provided by institutions and markets (Chakrabarti, Singh et al. 2007). Thus, a single business firm is more dependent on external resources for raising capital, which is often costlier than internally created capital. There are several evidences showing that corporate diversification has not enhanced the value of firms in various advanced economies (Lippman and Rumelt 1982, Meyer 2006). The evidence in these papers suggest that, for the average firm operating in developed capital markets, the costs of diversification outweigh the benefits (Lins and Servaes 2002). The internal intermediate institutions of diversified firms in developed economies cannot match the efficiency levels of open market institutions. Diversified firms thus have higher costs, which results in lowering their performance.
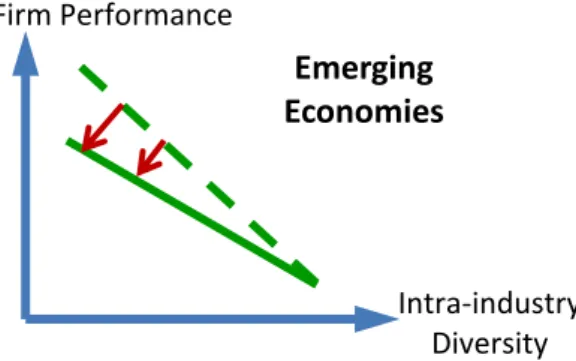
In this paper, with the combination concepts between intra-industry diversification and institutional voids in emerging economies, we propose that diversity in related industries still have value in markets, where institutional voids exist and market competition is not strong. Therefore, we predict that the gain of diversification is in developing economies rather than in advanced economies. This leads to following hypotheses.
Hypothesis 3: In developing economies, the interaction effect between a start-up firm and intra-industry diversification positively relates to performance
Figure 2.4 Relationship between firm performance and intra-industry diversity in developing economies
Firm Performance
Intra‐industry Diversity Emerging
Economies
CHAPTER III
RESEARCH METHODOLOGY
3.1 Sample selection
To test our hypotheses, this study focuses on both established and start-up firms in developing and advanced economies. The sample data should belong to firms that are actively engaged in product scope expansion in South-east Asian region together with Hong Kong and Taiwan. Hong Kong and Taiwan are included even though they are not part of South-east Asian region since our hypotheses are tested in both developing and advanced economies which only Singapore can be considered as advanced economies.
The sample data of Singapore alone are not enough. The initial data samples include 5620 firms in 8 countries for both listed and unlisted companies. We, then, ex3cluded incomplete firms which variables required for the test were missing. There are several variables that are expected to affect firm performance. Apart from that we also removed entries where sales values are likely to be outliner since sales growth is our dependent variable.
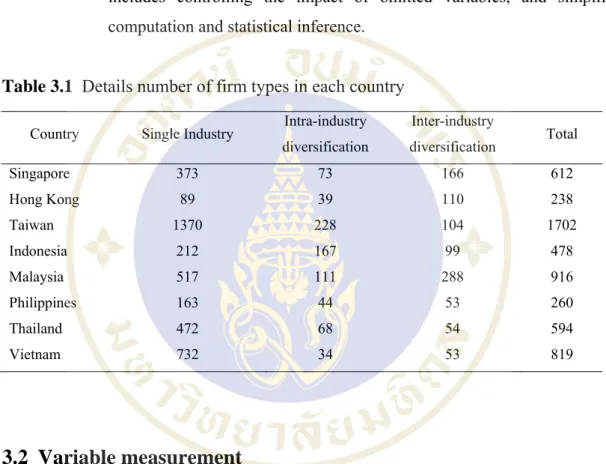
Regarding developing and advanced economies, Singapore, Hong Kong and Taiwan are considered as advanced economies, whereas Indonesia, Malaysia, Philippines, Thailand and Vietnam are considered as developing economies. The sample data of established firms is also required. The sample data is from Osiris database which can completely provide all required data, i.e. complete financial data, company profile, and segmentation data which is defined by SIC code. Detail company types of each country are provided in Table 3.1. The hypotheses are tested on a sample of public firms in South- east Asian region. The dataset is collected from 2009 to 2014. Our longitudinal data for 3820 firms are from eight counties over a six-year period.
Given the nature of the hypotheses and the data, we used panel data econometrics to estimate our model, with a total of six panels in our dataset which are unbalance panel. Even though unbalance panels may have some problem according to Wooldridge (2004, 448) saying that the problem with unbalanced panels is the possibility that the causes of missing observations are endogenous to the model. However, there is
also a problem with balanced panel data since it has been created artificially by eliminating all firms with missing observations so the resulting data set may not be representative of the population.
According to Hsiao (2006), panel data has certain advantages over the study of historical series or the analysis of cross-sectional data:
More accurate inference of model parameters
Greater capacity for capturing the complexity of human behavior which includes controlling the impact of omitted variables, and simplified computation and statistical inference.
Table 3.1 Details number of firm types in each country
Country Single Industry Intra-industry diversification
Inter-industry
diversification Total
Singapore 373 73 166 612
Hong Kong 89 39 110 238
Taiwan 1370 228 104 1702
Indonesia 212 167 99 478
Malaysia 517 111 288 916
Philippines 163 44 53 260
Thailand 472 68 54 594
Vietnam 732 34 53 819
3.2 Variable measurement
3.2.1 Dependent Variable Firm Performance
We measure the performance by annual sale growth of each firm (Tanriverdİ and Lee 2008, Hashai 2012, Zahavi and Lavie 2013). Although operation that rely on profitability are robust performance measurements in large established corporations (Goerzen and Beamish 2005), they may not be appropriate measures for young and small firms such as the firms in our sample. Since such firms direct many of their resources to new product development (Hart 1995, Lee,
Lee et al. 2001), they reach profitability only at a later stage of their lifecycle. The measurement is done using a logarithmic power function:
ln , ln , ,
′
, ,for each firm i at year t
The use of sales growth also enables us to avoid the slower adjustment of profitability measures of performance (Stuart 2000). This model yields unbiased and efficient estimates under the linearity, homoscedasticity, and independence assumptions of OLS regression (Stuart 2000). The data have been collected from Osiris database. However, based on our observation, there were outliers of the value which have been removed by taking into the account of 25th and 75th percentiles. After drop out the outliers, the mean value and the 50th percentile value are quite similar.
3.2.2 Independent Variable Intra-Industry Diversification
To capture this variable, the concentric and entropy indexes, which can be used to investigate relatedness of product lines, are calculated. The concentric index is positively associated with the size of the dominant business focus (Robins and Wiersema 2003). It can be calculated as (Montgomery and Hariharan 1991, 80):
where Pki = percentage of sales for firm k in industry i, Pkl = percentage of sales for firm k in industry l, dil = variable weighting factor such that dil = 0 where i and l belong to the same 3-digit SIC category, dil = 1 where i and l belong to the same 2- digit SIC group but different 3-digit SIC groups, and dil = 2 where i and l are in different 2-digit SIC categories.
The related component of the entropy index increases with the number of businesses - pure diversification (Robins and Wiersema 2003). It can be derived by a partition of total entropy into its related and unrelated parts (Berry 1974, Jacquemin and Berry 1979).
l
Total entropy (DT) is given by:
where Pi = Proportion of business activity (sales) in SIC code i, for a corporation with N different 4-digit SIC businesses.
Unrelated entropy (DU) is computed in a similar fashion using 2-digit SIC data:
where Pi = Proportion of business activity (sales) in SIC code i, for a corporation with N different 2-digit SIC businesses. Related entropy (DR) therefore can be estimated as DT − DU = DR.
Both values have been investigated because the measurements do not capture the same dimensions of portfolio strategies. A larger value of the concentric index designates less related diversification. While entropy on the other hand, increases with greater related diversification. Concentric index is one of a commonly used in related diversification studies (Montgomery and Wernerfelt 1988, Davis and Thomas 1993, Robins and Wiersema 2003, Zahavi and Lavie 2013). Even though the advantage of this measure is that it takes into account the relatedness of product categories by considering the distance between different product functions (Zahavi and Lavie, 2013), it is driven by dominant business focus rather than related diversification (Robins and Wiersema 2003). On the other hand, entropy is also one of a popular index in intra-industry diversification researches. However, between entropy index and firm performance is to indicate the effects of pure diversification rather than relatedness. Higher levels of related entropy may be driven by larger portfolios. A firm may have a higher entropy value solely because it has a greater number of businesses within the corporate portfolios in related industry (Robins and Wiersema 2003). In order to test the robustness of our findings by running various auxiliary analyses, both concentric and entropy were run as the intra-industry diversification variables.
In our literature, to decide whether a company applies intra-industry diversification or not, Primary SIC (P-SIC) is defined as a firm’s core business and Secondary SIC (S-SIC) is defined as a firm’s diversification. Our mean of intra-
industry diversification is for a company that diversifies its product line (S-SIC) within the same industry as its core product line (P-SIC). If a firm diversifies within the same business product line among its secondary product lines (S-SICs), we do not consider the firm having intra-industry diversification.
3.2.3 Moderating Variables Start-up Firm
Currently, there is no consensus exists to define definitions to demarcate different corporate stages of deployment. Frequently used factors are such as changes in number of employees, changes in sales growth rates, or firm age to classify different stages of corporate lifecycle (Terpstra and Olson 1993). (Kazanjian 1988), for example, used employee size, firm age, and sales growth to characterize an organization's stage of development. (Smith, Mitchell et al. 1985) have stated that firms in their start-up stage tend to be small in size (number of employees) and young in age, while firms in their growth stage are larger in employee size and older. (Miller and Friesen 1984) have characterized organizations with annual sales growth rates and firm age.
Our criteria of the measurement of start-up firm was taken from (Miller and Friesen 1984) which is called as ‘Birth stage’. The criteria were given by:
Firm is less than 10 years old.
Sales growth is less than 15%
The firm age is calculated from ‘Date in Corporation’ values in Osiris database which if a firm’s Date in Corporation’ value is between 2005 to 2015, it is considered to be at start-up age. Together with sales growth calculated by
ln , ln , 15%
for firm i at time t
While if the value is lower than 2005 and sales growth is above 15%, it is classified to be an established firm at growth stages defined by (Miller and Friesen 1984).
3.2.4 Control Variables
Because prior research suggests that a firm’s performance is influenced by a complex set of variables, we complemented the model with a series of control variables to capture the influence of factors outside our hypotheses. The control variable includes:
Debt/Equity ratio
Firm solvency captures the slack resources available for supporting the firm’s operations (Nohria and Gulati 1996), measured with the log-transformed ratio of cash to long-term debt in the preceding year. In our literature, total liability and debt is considered as debt divided by equity which calculated by the difference between the total value of a corporate assets and corporate liabilities. In (Zahavi and Lavie 2013), they show that firm solvency is highly significant with firm performance.
Asset growth rate
Assets are the economic resources of a company expected to benefit the firm’s future operations. Certain kinds of assets including cash and accounts receivable are monetary items. Others like inventory, land, buildings and equipment are nonmonetary, physical items. Still other assets like patents, trademarks, and copyrights-are non-physical. The assets of a business enterprise are an integral part of business operations. Assets work in conjunction with other components of liabilities and equity in the overall business operations. We calculate asset growth rate by finding the log-transformed different between asset of firm i in year t and lagged year t (t-1).
Firm age
It is age of a firm that a firm getting from Osiris database. We control for firm i’s age in year t. Age can have adverse effects on performance because of the organizational rigidities and inertia it brings about (Hannan and Freeman 1984, Leonard-Barton 1992) and because it impairs firms’ ability to perceive valuable signals. The root of the problem is the tendency of firms to systematize their successes with organizational measures, rules of conduct, and best practice. This behavior often makes sense, because it helps firms focus on their core competences and raise reliability and accountability. The effect of firm age is explored by means of the number of years that the firm has been in continuous operation. In (Stern and
Henderson 2004) result, it shows that firm age is very highly significant since failure rates vary with firm age.
Firm size
In previous studies, size was shown to be an important determinant of firm performance and survival rate (Stern and Henderson 2004, Tanriverdİ and Lee 2008, Zahavi and Lavie 2013, Hashai 2015). Previous empirical studies report mixed positive and negative relationship between size and firm performance (Zahavi and Lavie 2013, Hashai 2015). The size of the firm is measured by the log of its sales. The logarithmic transformation accounts for the fact that small firms are particularly affected by a size effect.
Technological Intensity
The intangible technological assets control variable is represented by the firm's R&D intensity. Technology intensity was measured as the firm’s R&D investment divided by its sales during the year in question. Scientific research can nurture competencies that enhance performance (Barney 1991). With high technological intensity, firm can enjoy greater scope and scale economies, and is more capable to exploiting market imperfections with the trade of technological assets.
Firm-level technological assets are expected to leverage firm performance (Zahavi and Lavie 2013, Hashai 2015). Our literature uses R&D investment divided by its sales during the year in question to represent technological intensity value.
Inter-industry Diversification (Dummy Variable)
We want to check the effect of inter-industry diversification. Therefore, inter-industry diversification dummy was coded 1 if a firm only implements inter- industry diversification and 0 otherwise. To consider whether a firm having inter- industry diversification or not, it is measured by checking Primary SIC (P-SIC) which is defined as a firm’s core business and Secondary SIC (S-SIC) which is defined as a firm’s diversification. Our mean of inter-industry diversification is for a company that diversifies its product line (S-SIC) in different industry as its core product line (P-SIC) with different 2-digit SIC businesses.
Headquarter in Advanced Economies
We define Headquarter in Advance Economies dummy in order to control condition to test our hypotheses of developing and advance economies. It was coded as 1 if the firm i headquarter is in Singapore, Hong Kong and Taiwan and 0 otherwise.
3.3 Estimation
3.3.1 Panel Data
Panel data, also called longitudinal data or cross-sectional time series data, are data where multiple cases, such as people, firms, countries etc., were observed at two or more time periods. Panel data methodology helps to address two issues that arise while assessing the impact of diversification and firm performance, unobserved heterogeneity and endogeneity. The unobserved heterogeneity problem arises when we have unobserved factors affecting our dependent variable and it is a common problem to find appropriate models with cross-sectional data sets. In our study, we have unobserved heterogeneity due to the fact that firms are very different to each other as a result of legal differences across countries and the nature of the business.
Consequently, we prefer panel data analysis as it is possible to account for the heterogeneity of firms by including firm specific effects by including time dummy effects.
3.3.2 Static Model
Based on our hypotheses which are to observe linear relation between intra-industry diversification and firm performance, we use static model with panel data. Our static model to analyze firms with panel data is as follows:
Dit = β’xit + vi + εit
with Dit : firm performance, Sales Growth, of firm i in year t
xit : Intra-Industry Diversification, Intra-Industry Diversification x Start-up Firm, Debt/Equity ratio, Asset growth rate, Firm Age, Firm Size, Technological Intensity
β : a K×1 vector of constants
vi : country individual effects or unobserved heterogeneity
εit : residual, the error term assumed standard (mean zero, homoskedastic, uncorrelated with itself, υi and the x matrix)
According to (Janoski and Hicks 1994, 172), panel data models can be difficult to estimate because “errors for regression equations estimated from panel data using OLS (ordinary least squares regression) procedures tend to be (1) temporally autoregressive, (2) cross-sectional heteroscedastic, and (3) cross-sectional correlated as well as (4) conceal unit and period effects and (5) reflect some causal heterogeneity across space, time, or both.” To deal with causal heterogeneity across space, the most common assumption is that vi is fixed unknown variables which allows for the correlation of the country fixed effects with the explanatory variables. This is a reasonable assumption in our case since the individual effects represent omitted variables and it is highly likely that these countries characteristics are correlated with the other regressors. In order to confirm that the Fixed Effects (FE) estimation is more suitable than Random Effects (RE) in our case, we will perform the Hausman test for the statistical significance of the difference between the coefficients estimates obtained by FE and by RE.
Another important issue that we have to deal with in our estimation is the autocorrelation, heteroscedasticity and contemporaneous correlation in the error terms.
Since our results rely mostly on the interpretation of the estimated coefficients special attention will be given to computing robust standard errors which influence the significance of our results. Consequently, we will test for all the three problems and compute robust standard errors accordingly. However, the literature does not offer a clear and consistent approach for how to compute standard errors in panel data.
(Petersen 2009) examined the different methods of addressing possible biases in the standard errors when studying panel data in corporate finance and asset pricing. He concludes that many of these methods are wrong also due to the lack of good advice in the literature. He shows that, when the data contains a firm effect, White and Fama- MacBeth standard errors are too small and that the magnitude of the bias can be quite large. When both a firm and a time effect are present in the data, he suggests
addressing one parametrically (by including time dummies) and then estimating standard errors clustered on the other dimension. He recommends clustering by both dimensions (firm and year) only if there are sufficient clusters for each dimension.
On the other hand, (Hoechle 2007) states that White robust standard errors, clustered standard errors and Newey-West standard errors are robust only to certain violations of the regression model assumptions (heteroscedasticity and autocorrelation) and that they do not consider cross-sectional correlation. He suggests that using panel corrected errors (PCSE) proposed by (Beck and Katz 2006) is a suitable method to deal with heteroscedasticity, autocorrelation and cross-sectional correlation. However, the PCSE estimator does not perform very well when the panel’s cross-sectional dimension N is large compared to the time dimension T.
For a better understanding of how the different estimation methods account for the typical issues encountered when working with panel data, we will first estimate our static model using the panel regression with time and industry effects. In this study, we perform Hausman test in order to discriminate between random effects or fixed effects model. Moreover, we also apply standard error cluster with P-SIC in our regression model.
CHAPTER IV EMPIRICAL RESULTS
4.1 Correlations
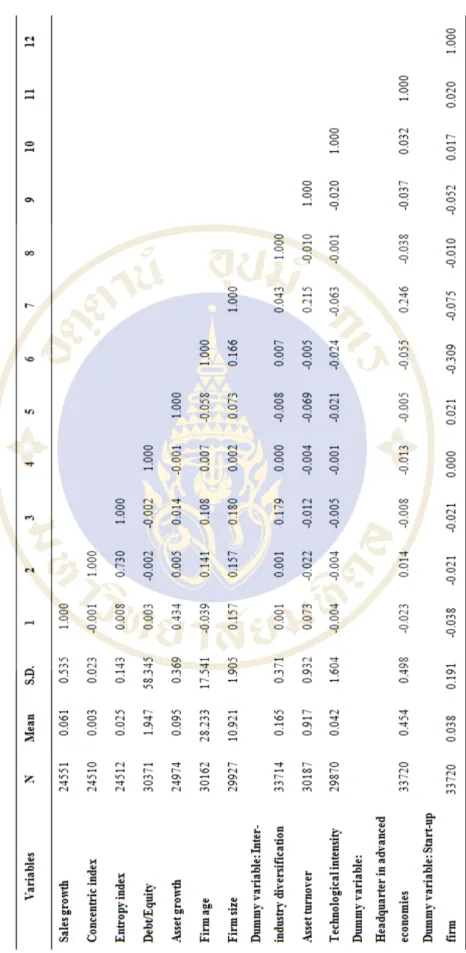
The Pearson correlation coefficients between firm performance and the diversification and financial variables employed in the regression model are reported in Table 4.1. The results show that concentric index (one of intra-industry diversification index) is negatively correlated to firm performance in contrast with entropy index (the other intra-industry diversification) is positively correlated with firm performance. Debt/Equity, Asset growth, Firm size, Inter-industry diversification (dummy variable), and Asset turnover are positively correlated with firm performance.
While the rests of variables including moderate variable, Start-up firm (dummy variable) are negatively correlated with firm performance.
Table 4.1 Pearson correlation coefficients between variables
4.2 Static analysis
Our static analysis presents the results of different models estimated with panel data regression with random effect. We introduced standard error cluster by P- SIC in our regression model.
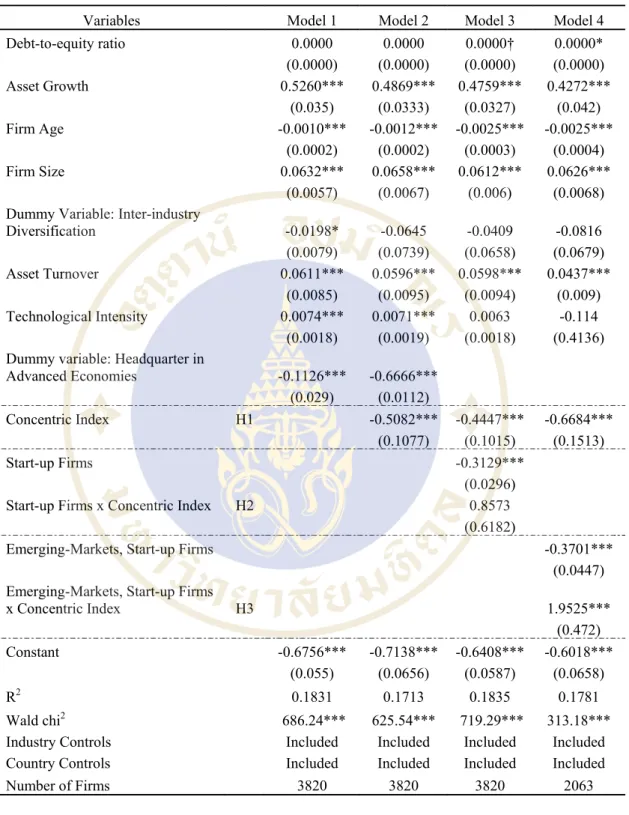
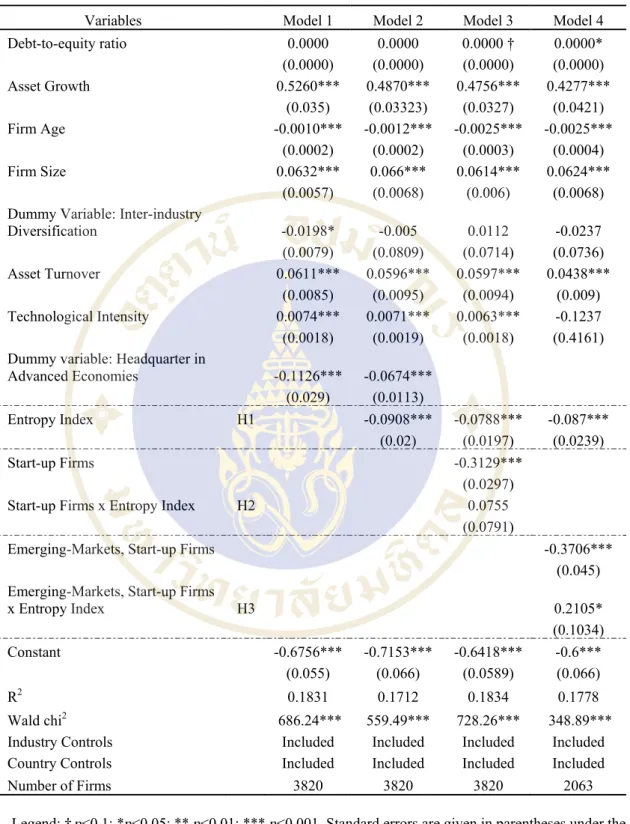
Table 4.2 and Table 4.3 present the panel data regression of the performance of firms examined with concentric and entropy indexes as independent variable respectively.
Model 2 displays the main effect of intra-industry product diversity to the firms’
performances for both high-tech and non-tech firms in both developing and advanced economic environments. The coefficients of intra industry diversification are negative and statistically very highly significant for both concentric and entropy indexes (βC = - 0.5082, p <0.001 for the Concentric model; βE = -0.0908, p <0.001 for the Entropy model), indicating the negative transfer, coordination and adjustment cost outrun the benefits from economies of scopes. Furthermore, since our model was tested with both high-tech and non-tech firms, on one hand rivals can undermine the effectiveness of the asset redeployment process. In resource based-view, the suggestion is that the benefits can be gained from the overly abundant resources which are being scare, valuable, inimitable, and unavailable (Wernerfelt 1984, Barney 1991, Markides and Williamson 1996) which are not properties of non-tech firms by contrast with high- tech firms tested in (Zahavi and Lavie 2013, Hashai 2015). On the other hand, considering negative transfer reducing benefits of economies of scope, which is up to some level of intra-industry diversification, can be mitigated. However, that is only applied to high-tech firm especially software companies as observed in (Zahavi and Lavie 2013, Hashai 2015). The reason is that such a firm is likely to have flat structure with the mindset of project oriented. The negative transfer is then limited in small scope. Therefore, our results show that firm performance is declined with increasing of intra-industry diversification level which supports our hypothesis 1.
Model 3 shows the results of the relation between intra-industry diversification and firm performance of start-up firms in both developing and advanced economies. The results show that the coefficients of the interaction effect are positive but not significant, (βC = 0.8573, p > 0.1; βE = 0.0755, p > 0.1). One of the suggested strategy for start-up firms is to pursue niche markets (Miller and Friesen
1984). However, to enter new product categories, resources have to be transferred or shared which create costs, i.e. adjustment and coordination costs (Hashai 2015). This is especially true in advanced markets. The average firms operating in developed capital markets, the cost of diversification outweigh the benefits (Lins and Servaes 2002) which are in contrast with developing economies. Therefore, the model presents statistically insignificant results.
Hypothesis 3 considers the impact of institutional voids in developing economies, as opposed to advanced economies on the relationship between intra- industry diversification and performance. According to Model 4, the coefficients of the interaction effect in developing economies are positive, and statistically very highly and highly significant in concentric index and in entropy index respectively (βC
= 1.9525, p <0.001; βE = '0.2105, p <0.01), supporting Hypothesis 3. Intra-industry diversification provides a better performance for start-up firm in developing economies.