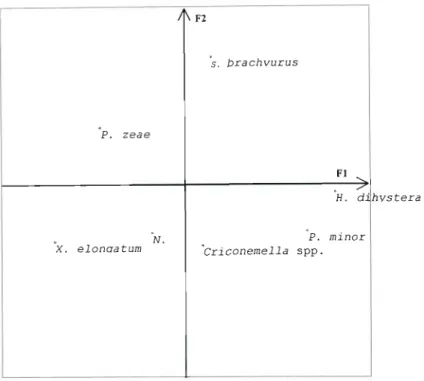
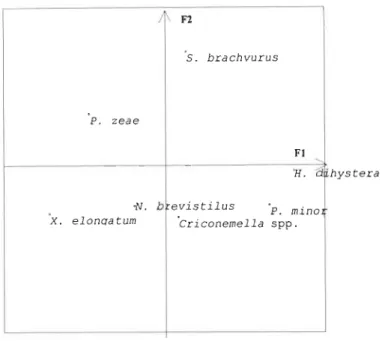
46 Figure 5: First and second factorial value of PCA on nematode relative percentages. 67 Figure 4: Projection of five transects for soil elements and particles in the factorial plan.
BACKGROUND ON SUGARCANE
When the alcohol component has been removed, the residue can be processed into animal feed with a high protein content, vitamins, In Peru, it has been used to produce pulp and paper, filter plates, pharmaceuticals, animal feed, and other fibrous derivatives.
SOIL CHARACTERISTICS
PHYSICAL CHARACTERISTICS
Application of organic matter can reduce the density of compacted soils, especially those with low organic matter (van Antwerpen & Meyer, 2001). The amount and quality of soil organic matter affects physical properties related to soil moisture dynamics, erodibility and workability (Schj0nning et al., 1994).
CHEMICAL CHARACTERISTICS
In northern KwaZulu-Natal, loss of organic matter under sugarcane in dry and irrigated areas is common (van Antwerpen & Meyer, 1996). As soil organic matter declined, so did soil microbial biomass, basal respiration, and aggregate stability.
SOIL ORGANISMS ASSOCIATED WITH SUGARCANE
Stillage or vinasse, a byproduct of ethanol production, has been used as a source of K in sugarcane fields in Brazil and Australia (Korndorfer & Anderson, 1997). Turneret al., (2002) also found that in Swaziland K levels increased when vinasse was applied to sugarcane fields.
DISEASES AFFECTING SUGARCANE
Yellow leaf syndrome first appeared in the South African sugar industry in 1994 and has now become common in all commercial varieties in most parts of the industry (Cronjeet al.,1998). Leaf burn, a disease caused by a bacterial pathogen, Xanthomonas albilineans, is another of the very important diseases of sugarcane (Saumtallyet al., 1996) and has a worldwide distribution (Rott & Davis, 1996).
NEMATODES AFFECTING SUGARCANE
Papua New Guinea, as a center of diversity of Saccharum spp., also has a variety of pests and diseases associated with sugarcane (Magareyet al., 1996). Ramu orange leaf blight, a fungal disease caused by Exobasidiales spp., turns leaves from pale green to yellow and eventually orange and leads to seedling death.
IMPACT OF NEMATODES ON YIELD
CONTROL MEASURES
Entomopathogenic nematodes of the genus Heterorhabditis and Steinernema have a symbiotic relationship with bacteria of the genus Photorhabdus and Xenorhabdus respectively (Han & Ehlers, 1999; Fallon et al., 2002). Organic amendments have been shown to be successful in controlling nematodes (Mehtaet al., 1994) especially those with high nitrogen content (Rodriguez-Kabana, 1986).
NEMATODE DISTRIBUTION OVER THE CROP CYCLE (TIME)
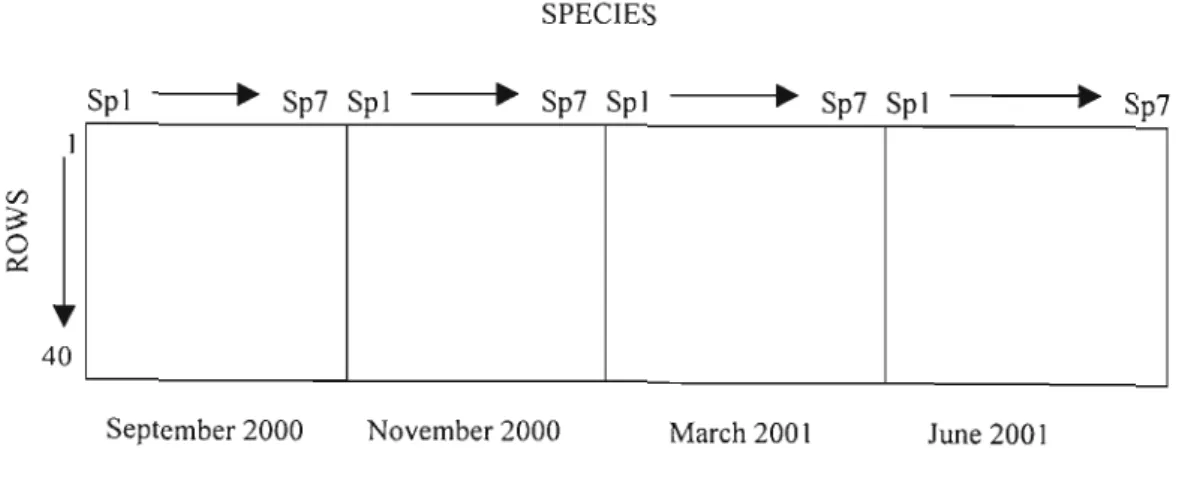
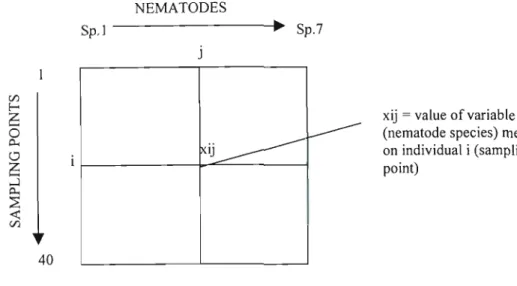
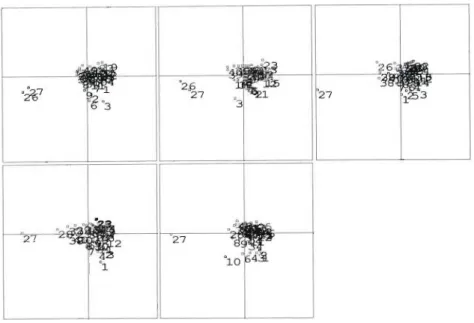
The nematode data for the four sampling dates were first analyzed using the Three-Way Table Analysis, a method that defines the common structure of several tables sharing the same individuals and variables. The data from the four data tables are placed side by side to form a single file with 40 rows and 28 columns (Fig. 4).
NEMATODE DISTRIBUTION ACCORDING TO SPACE
DISTRIBUTION OF ABIOTIC SOIL FACTORS ALONG THE FIVE TRANSECTS
RELATIONSHIP BETWEEN NEMATODES AND ABIOTIC SOIL FACTORS
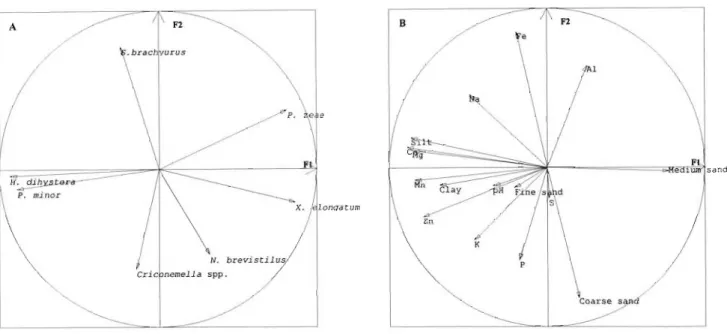
To determine whether a relationship existed between soil elements and nematode species along the five transects, a Coinertia analysis was performed on the two data sets, that is, the nematode and soil data. Scatter diagrams were then drawn to indicate whether there is a negative or positive relationship between certain nematode species and soil elements.
DISTRIBUTION OF LEAF ELEMENTS ALONG THE FIVE TRANSECTS
A permutation test, which shows whether a relationship between two tables is statistically significant or not, was calculated. This test shows that if one takes Row X from Table 1, places it before RowYon Table 2 and runs the test again, the relationship between variables inXandY will remain as it was before the rows were swapped.
RELATIONSHIP BETWEEN NEMATODES AND LEAF ELEMENTS
To determine whether or not there was a relationship between leaf elements and nematode species along the five transects, co-inergence analysis was performed on the two data sets, i.e., nematode and leaf data. Scatter plots were drawn to show whether there was a negative or positive relationship between certain nematode species and certain leaf elements.
RELATIONSHIP BETWEEN SOIL AND LEAF ELEMENTS
The nematode species and leaf elements were studied separately by Principal Component Analysis (PCA) on correlation matrix.
MANIPULATION OF NEMATODE COMMUNITIES FOR LESS PATHOGENIC SPECIES THROUGH USE OF ORGANIC AMENDMENTS
PLANTING
- CONTROL - C
- FILTER CAKE - F
- FILTER CAKE + FURFURAL - FF
- EXTRA FILTER CAKE + FURFURAL - BS
Seven hundred and eighty-four kg of filter cake was applied to the seven replicates. Immediately after the mixture was applied, 66 kg of filter cake was applied to each row and then sets were placed on top.

SAMPLING
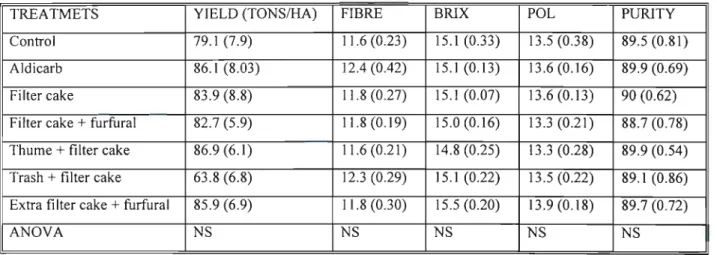
Only species that occurred in more than 15% of the 56 lines were used in the analysis, ie. Helicotylenchus dihystera, Scutellonema brachyurus, Xiphinema elongatum, Neodolichodorus brevistilus, Pratylenchus zeae, Paratrichodorus minor, Tylenchuidsploogynephyp. The yield data (tons/ha) from the three middle rows per plot were also projected onto the nematode rows to determine which plots, dominated by which species, had the highest yield.
HARVESTING
Queue weights were not used because roots from adjacent plots may have influenced subsequent rows and this may have affected nematode abundance and sugarcane growth.
INTRODUCTION
RESULTS
LEAF AND ROOT BIOMASS OF SUGARCANE GROWN UNDER DIFFERENT TREATMENTS
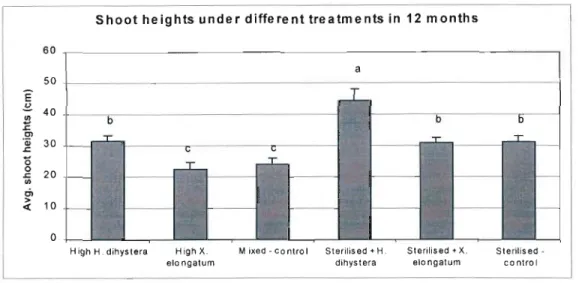
For the sterilized soil, analysis of the leaf biomass data showed that sugarcane grown in sterilized soil inoculated with H. The root biomass of sugarcane grown with mixed control treatments and soil with originally high amounts of H.
NEMATODE ABUNDANCE AND PROPORTIONS UNDER DIFFERENT TREATMENTS
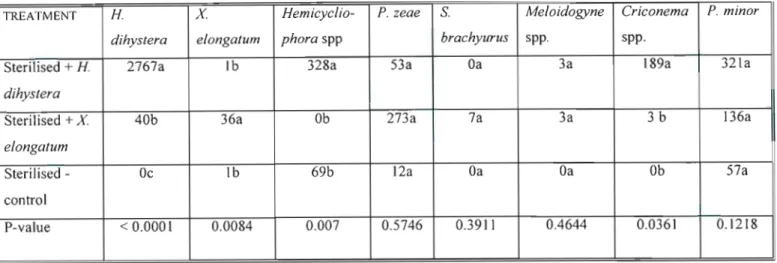
The numbers of Scutellonema brachyurus found in naturally degraded soil with high e/ongatum numbers were higher and significantly different from the numbers recovered in the other two treatments, which were not significantly different, p:S 0.0115. In naturally degraded soil with high X elongatum numbers, this species occurred in higher percentages than in the other two treatments, which showed no significant difference between them, p = 0.0352.
DISCUSSION
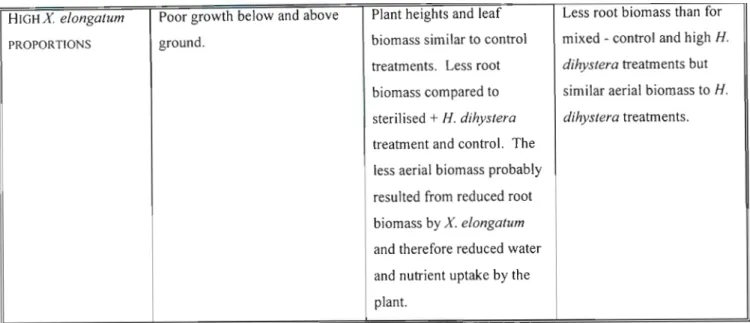
The best shoot growth and the highest growth rate of sugarcane grown in sterilized soil inoculated with H. This applies to X elongatum, where the proportions of this species showed no significant differences in all treatments, except in the soil of sterilized inoculated with naturally infected species and soil. that had high species sizes.
INTRODUCTION
The interaction between nematodes and other soil organisms can lead to spotting, as was demonstrated by the interaction between entomopathogenic nematodes, Steinernema and Heterorhabditis spp. The bacterial symbionts carried by the entomopathogenic bacteria kill the insect host, whose attack on the vines would lead to spots along the field due to poor growth.
DO NEMATODE COMMUNITIES IN A SUGARCANE FIELD CHANGE DURING THE CROP CYCLE?
MATERIALS AND METHODS
RESULTS
- QUANTITATIVE CHANGES
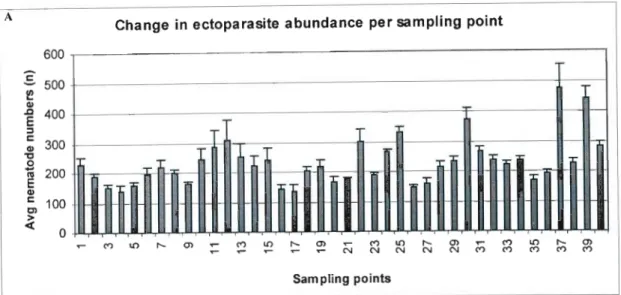
- NEMATODE ABUNDANCE ALONG THE TRANSECT PER SAMPLING POINT
- NEMATODE ABUNDANCE ALONG THE TRANSECT PER SAMPLING DATE
- QUALITATIVE CHANGES
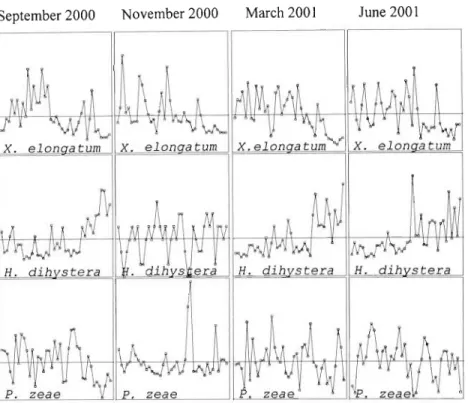
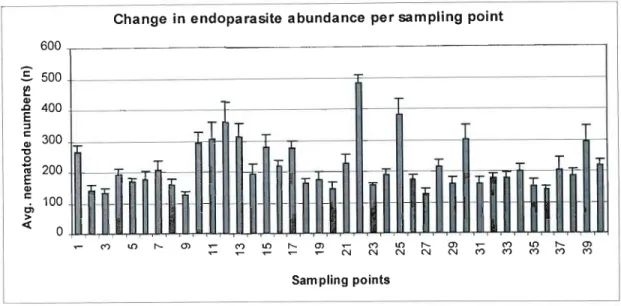
The aggregation of the points corresponding to the four sampling dates for each species means that the nematode communities did not change much during the sampling period. To check whether there was a difference in the nematode distribution along the transect, the percentages of the three important nematode species were plotted per sampling point for the four sampling dates (Fig. 6).
DOES SPATIAL DISTRIBUTION OF NEMATODE COMMUNITIES CHANGE WITHIN A SUGARCANE FIELD
- MATERIALS AND METHODS
- RESULTS
- QUANTITATIVE CHANGES
- QUALITATIVE CHANGES
- DISCUSSION
- INTRODUCTION
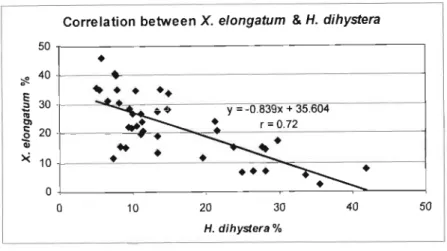
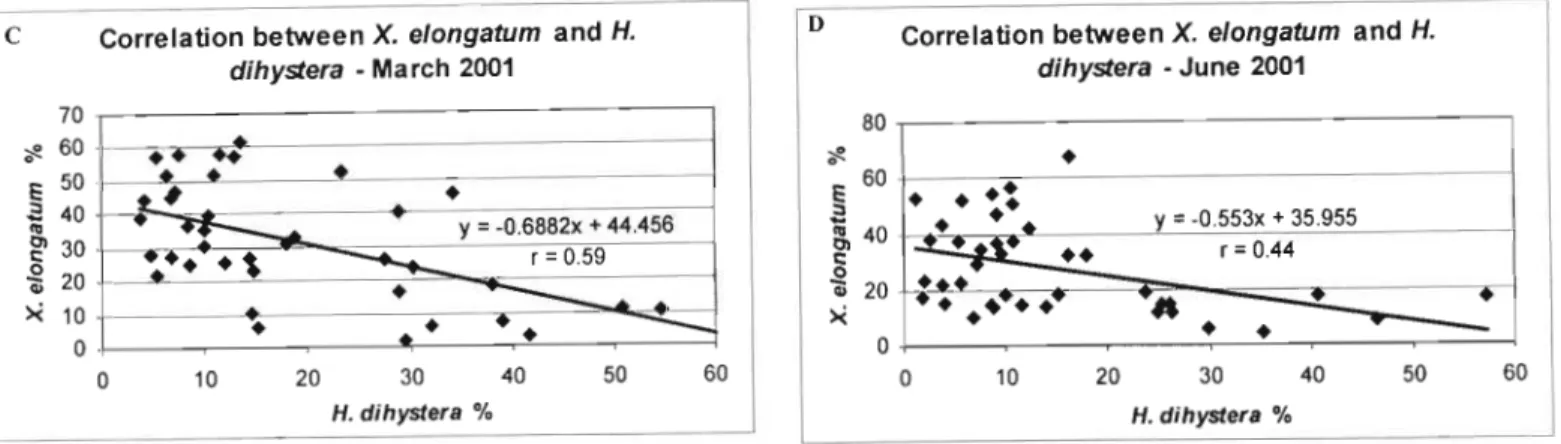
High proportions of X elongatum occurred in the first half of the transects, while high proportions of H. When the proportions of different nematode species along the five transects were plotted on a threatened factor map, X elongatum was opposite H.
SPATIAL DISTRIBUTION OF ABIOTIC SOIL FACTORS ALONG THE TRANSECT
MATERIALS AND METHODS
The way nematodes perceive the root exudates can be modified by changing the ion balance in the soil solution, thereby rendering the nematodes unable to locate their food source (Spaull & Cadet, 2001). The difference in the distribution of the two species could not be attributed to the host plant, sugarcane, as it was propagated vegetatively, and therefore all plants had the same genetic composition and only rows that showed uniform growth by visual observation were selected.
RESULTS
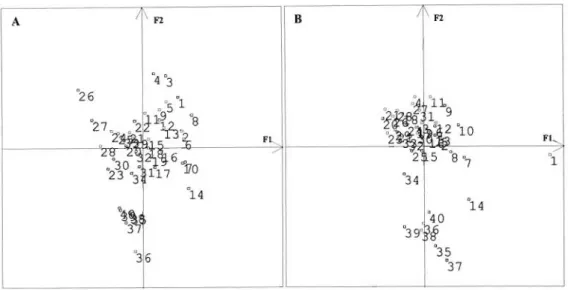
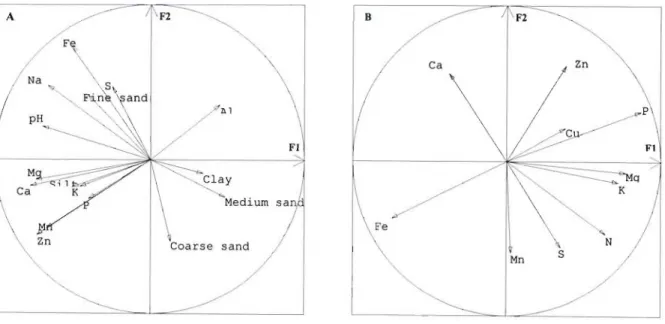
The factorial values of the 40 points corresponding to the soil samples collected along the five transects were projected onto the map of the transects instead of onto the Fl X F2 factorial plan (Fig. 2). Variables corresponding to AI, S, pH, P and fme sand were in the middle of the factorial map, with very low factorial values.
NEMATODE DISTRIBUTION IN RELATION TO ABIOTIC SOIL FACTORS
- MATERIALS AND METHODS
- RESULTS
- DISCUSSION
- INTRODUCTION
The coinertia factor map resulting from the nematological data analysis showed that variables corresponding to H. The distribution of soil abiotic factors was uniform along the five transects and affected the distribution of nematode species as high percentages of H.
SPATIAL DISTRIBUTION OF LEAF ELEMENTS IN A SUGARCANE FIELD 7.2 MATERIALS AND METHODS
RESULTS
The factor values of the 40 points corresponding to the leaf samples collected along the two transects were projected onto the map of the transects instead of onto the FI X F2 factor plot (Fig. 2). The variables corresponding to P, K and Cu had a positive association among themselves and were correlated with the positive part of the first factor (Fig. 3).
NEMATODE DISTRIBUTION IN RELATION TO LEAF ELEMENTS
MATERIALS AND METHODS
RESULTS
The leaf element coinertia map showed that the variables corresponding to P, Mg and Cu had negative F1 factorial values while variables corresponding to Fe had high positive F1 factorial values. Variables corresponding to Zn and Cu had negative F2 values while variables corresponding to Nen K had positive F2 factorial values.
RELATIONSHIP BETWEEN LEAF ELEMENTS AND ABIOTIC SOIL FACTORS The previous sections of this study showed that there was a correlation between nematode species and soil
- MATERIALS AND METHODS See Chapter 3, Section 3.8
- RESULTS
- DISCUSSION
- INTRODUCTION
- MATERIALS AND METHODS
- RESULTS
- EFFECT OF TREATMENTS ON ROOT INFESTATION
The permutation test between the two data sets showed that the relationship between them was statistically significant, i.e. the soil elements had a. The study between nematode species and leaf elements showed that leaves with high levels of Ca, Zn and Cu were found in areas with high percentages of H .
GERMINATION PERIOD
BS = extra filter cake + furfural, C = control, F=filter cake, FF=filter cake + furfural, Aid=aldikarb, ThumeF=thume + filter cake,.
WHOLE CROP CYCLE
EFFECT OF NEMATODES ON SETT ROOT DEVELOPMENT
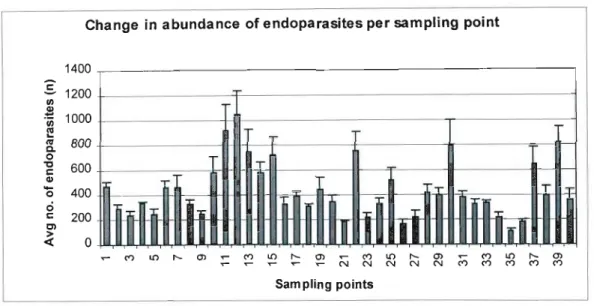
When a regression graph was plotted between the numbers of endoparasitic nematodes found in carrot roots and the average carrot root weights, although the regression line was negative, the correlation coefficient was very small, meaning there was no true correlation between the two. variables (Fig. 4). The slope was close to a flat line, implying that huge numbers of endoparasites are needed to influence root weight.
EFFECT OF NEMATODES ON NODE GERMINATION PERCENTAGE
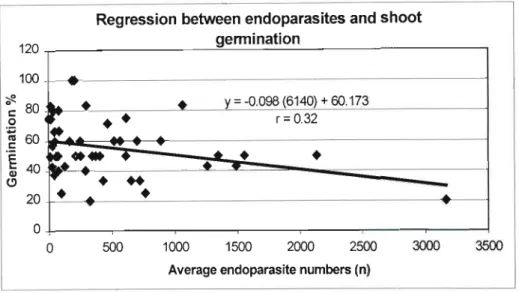
When we determined the regression between root mass and germination percentage, we found a positive regression line (Figure 6). This means that an increase in root weight resulted in an increase in shoot germination percentage.
EFFECT OF TREATMENTS ON NEMATODES IN SOIL
CORRELATION CIRCLE (RELATIONSHIP BETWEEN SPECIES)
FACTORIAL PLAN (EFFECT OF THE TREATMENTS)
DESCRIPTION OF PCA RESULTS WITH ACTUAL NUMBERS
RELATIONSHIP BETWEEN NEMATODE COMMUNITIES AND YIELD
- YIELD PROJECTED ON A FACTORIAL MAP
- REGRESSION BETWEEN NEMATODE AND YIELD DATA
Although none of the treatments managed to manipulate the nematode communities, the high percentages and abundance of S. Most of the circles were on the negative part of the first axis and had negative factorial values, while the majority of the squares were on the were found to be positive part of Flaxis and had positive factorial values.
DISCUSSION
Thompson (1985) also found that sugarcane yield increased when planted in sterilized soil as stems lengthened and. Below ground, the roots of plants in sterilized soil had rapid downward growth and branched well.
NEMATODE COMMUNITY STABILITY AND SPATIAL DISTRIBUTION
According to Vogel et al. 2002), there is a possibility that a balance between species can be controlled by the composition of the associated bacterial flora. Although in the current study the same crop, sugar cane, has been grown in monoculture for many years, the distribution of the different nematode species is not homogenized, such as
USE OF ABIOTIC SOIL FACTORS IN NEMATODE COMMUNITY MANAGEMENT
It also interferes with the uniformity of the distribution of nematodes by affecting the occurrence and distribution of many species (Cadetet al., 1994). Differences in pH, (Ferriset al., 1971), organic matter (Norton & Schmitt, 1974), soil texture and moisture (Schmitt, 1973) have been related to nematode occurrence.
IMPACT OF NEMATODES ON SOIL AND LEAF RELATIONSHIPS
Plants with high levels of Ca in their leaves grew in areas with high amounts of H. Soil structure had an impact on species distribution as high proportions of X elongatum were found in medium and coarse level sands high P while high H.
ALTERNATIVE METHODS TO CONTROL NEMATODES THROUGH ORGANIC AMENDMENTS
Update on the occurrence of yellow leaf syndrome in the South African sugar industry and evidence for the causative organism. An economic assessment of the use of molasses and condensed molasses solids as fertilizer in the South African sugar industry.