Heart disease is responsible for the death of about one person per minute in the modern era. Using a variety of data mining strategies, such as Naive Bayes, Decision Tree, Support Vector Machine (SVM), K-Nearest Neighbor (K-NN), and Random Forest, the work reported in this thesis estimates the likelihood that a patient would develop heart disease and can categorize the patient's degree of risk.
Introduction
Overview
Heart disease is considered one of the world's most dangerous and life-threatening chronic diseases. According to a recent poll, the United States tops the list of countries with a large number of patients with heart disease [1].
Literature Review
The approach illustrates a number of knowledge abstraction techniques using data mining methods adopted for heart disease prediction. The authors of [14] investigated Naive Bayes and Support Vector Machine for classification on the UCI data set for heart disease prediction. The combination of different machine learning was investigated in [20], where the authors developed a hybrid neural network consisting of ANN and fuzzy neural network to build a heart disease classification system.
Another hybrid system in the form of a framework has been proposed in [24], in which authors develop a machine learning-based system to detect heart disease using a heart disease dataset. The authors use a data mining tool that included a collection of machine learning algorithms, namely Naive Bayes, decision tree, and bagging. In another work [27], the authors proposed a system using data mining techniques in combination with the MapReduce algorithm.
The authors use data set collected from a survey used by the Korean National Health and Nutrition Organization.
Materials and Methods
Preprocessing
When no data value is stored for a variable in an observation, it is referred to as missing values or missing data in statistics. The most common reason for missing values is that respondents forget, refuse, or fail to answer certain questions. When missing values are included in a data set, it is difficult to determine whether they will affect the results or not.
Due to missing data, the analysis can be performed, but the results may not be statistically significant. It is more useful to replace missing values with a user constant or the mean value for research purposes than to remove those observations from the data set. Meanwhile, the 'thal' attribute has two missing values and a majority score of 3 in 166 out of 301 observations.
As a result, the missing values in 'ca' and 'thal' were replaced with the corresponding majority markers 0 and 3, respectively, to ensure that the data set was complete.
Dataset and features
Each variable in a data set may have a modest number of missing responses, but the missing data can be large when combined. The nominal attributes 'ca' and 'thal' in the Cleveland heart dataset had missing values, which were replaced with the user constant based on the majority sign. In 176 out of 299 observations, the 'ca' attribute contains four missing values, with the value 0 being the majority sign.
Of all the cases in the dataset, 165 are cases with heart disease and 138 are without heart disease. ST segment slope at peak exercise (1: inclined, 2: straight, 3: downward sloping) 12 Major vessels VCa Number of major vessels stained with. The analysis of the data set based on these features is shown in Figure 1 (with 9 features) and Figure 2 (with 5 features).
![Figure 1: Summary of heart disease patients according to features-1 [32]](https://thumb-ap.123doks.com/thumbv2/azpdfco/10576064.0/30.702.98.595.185.684/figure-summary-heart-disease-patients-according-features-32.webp)
Feature selection
- Fast correlation-based filter (FCBF)
- Minimal redundancy maximum relevance (mRMR)
- Least absolute shrinkage and selection operator (LASSO)
- Relief
An SU value of 1 means that the value of the other feature can be completely predicted using this feature, while a value of 0 indicates that the two features are completely independent. Mutual information [33] is a symmetric reference to knowledge and a theoretical measure that quantifies the amount of information about one random variable that can be obtained by looking at another random variable. For each sampled instance, the closest instance of the same class (nearest hit) and the opposite class (nearest miss) are detected.
The value of an attribute's weight is changed based on how well its values separate the sampled instance from its nearest misses and hits. It will be given a high weight if an attribute distinguishes between instances belonging to different classes and has the same value for instances belonging to the same class. Relief searches for two nearest neighbors: one in the opposite class, designated as nearest miss M, and one in the same class, designated as nearest hit H.
After this, two nearest neighbors are found: one from the same class as Ri, known as nearest hit (NH), and one from a different class, known as nearest miss (NM).
Training and cross validation
Classification approaches
- Bayes net
- Naive bayes
- Random forest
- Boosting
- Bagging
- Multilayer perceptron
- Decision tree
- Support vector machine
The value of the attribute is not related to the values of other characteristics in the class according to conditional independence. After determining the MLP architecture, the network weights must be generated through a training process. The approach is one of many gradient descent techniques used to descend the performance function by updating the network weights along the negative gradients of the performance function.
The input pattern is then passed through the network layers until the output layer produces an output. The first is with stepwise training, which computes the gradient and updates the weights after each input used in the network. Second, using a batch mode in which all inputs are applied to the network before the weights are updated.
When using the BP method, the total squared error can be used to determine the network's performance.
Processing Time
Evaluation Metrics
The performance of the classification algorithm is closely related to the AUC, that is, the higher the AUC value, the better the performance of the classification algorithm.
Proposed Methodology
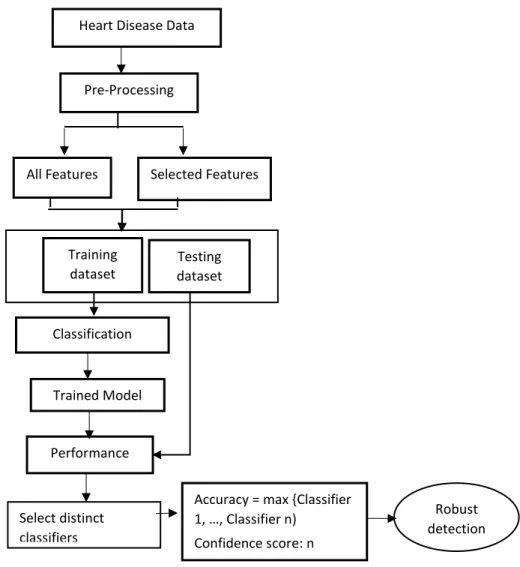
The next step was data pre-processing, which included tasks such as locating missing values in the dataset and replacing them with the user constant or mean value, depending on the type of attribute, to improve the performance of machine learning classifiers . As discussed in Section 2.1, data pre-processing must be performed to make the raw data suitable for processing. The steps to perform are to remove missing values, min-max scalar and default scalar on the dataset to make classification more meaningful.
After this step, the features should be selected to generate the optimal feature subspace, as it may happen that the inclusion of irrelevant features may degrade the classification performance. Once the optimal features are selected, the next step to follow is training and classification. If a number of separate test reports show the same results, the doctor's confidence is improved in making the judgment in that direction.
More, the number of different classifiers that detect in the same direction, the higher the confidence.
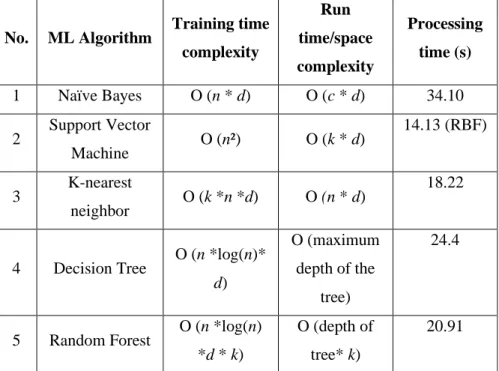
Computational Complexity
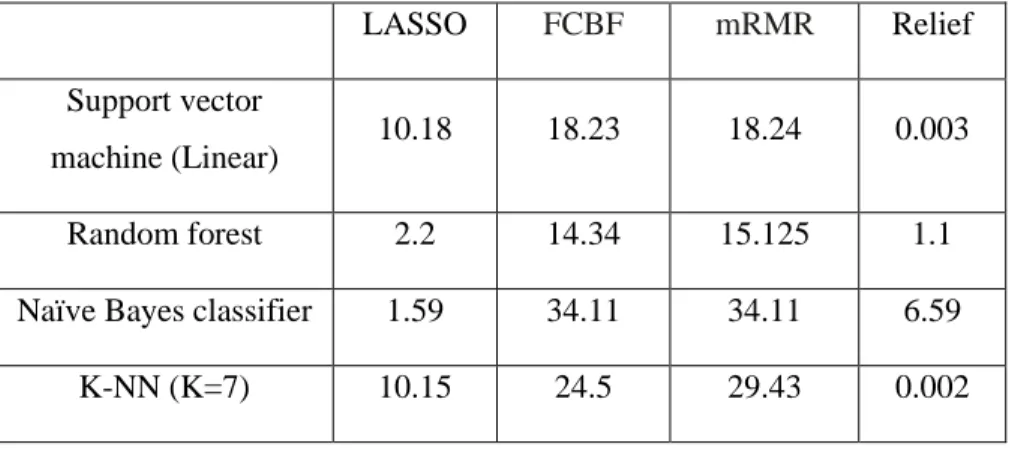
Thus, a system running on a dual-core processor with each core capable of two threads can test four classifiers and generate results with a maximum confidence of four and accuracy according to Equation 24. The focus is on runtime/space complexity, since it was assumed that the training platform will have sufficient resources and that the training takes place offline. To this end, the relative computational cost of each algorithm planned for performance evaluation in the next section is presented below.
It is clear from the table that the training time complexity varies, but the runtime complexity of random forest, K-NN and support vector machine are lower than all other machine learning algorithms. It should be noted, here, that the processing time depends on the given parameters used in a given algorithm and the machine used to run the classifier for testing. In the next chapter, the experimental results based on the discussion in this section are presented.
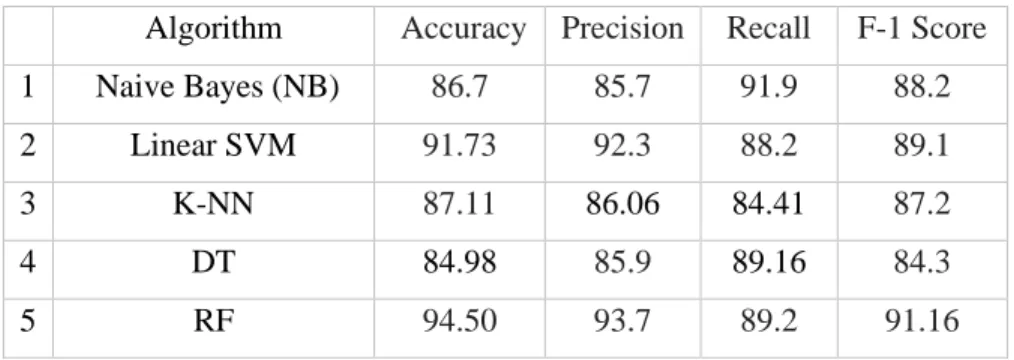
Experimental Results
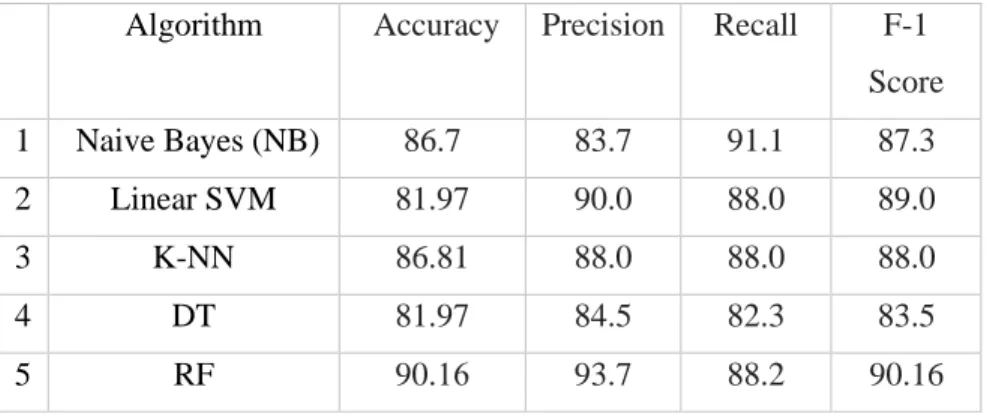
In this section, we will present the experimental results obtained with the proposed approach and several well-known classifiers implemented on the heart disease dataset. Table 5 indicates that random forest outperformed all classifiers on the precision parameter, while random forest and support vector machine together performed equally well on precision, recall and F1 score parameters, outperforming the other classifiers. As such, random forest and SVM (and K-NN to some extent) stand out as robust classifiers compared to other models evaluated on the dataset used in this experiment.
On the one hand, SVM tries to optimize the separation between two classes, while random forest tries to build classes statistically. The research in this thesis has concluded that heart disease can be detected from the findings of SVM, random forest and any other special classifier such as K-NN (all executed in parallel) to generate a confidence score (as in Eq. 24) and maximum accuracy. of 90.16% using the full feature space. All these achievements are attributed to the best (feature) selection strategy that not only minimizes the feature space but also improves the classification ability.
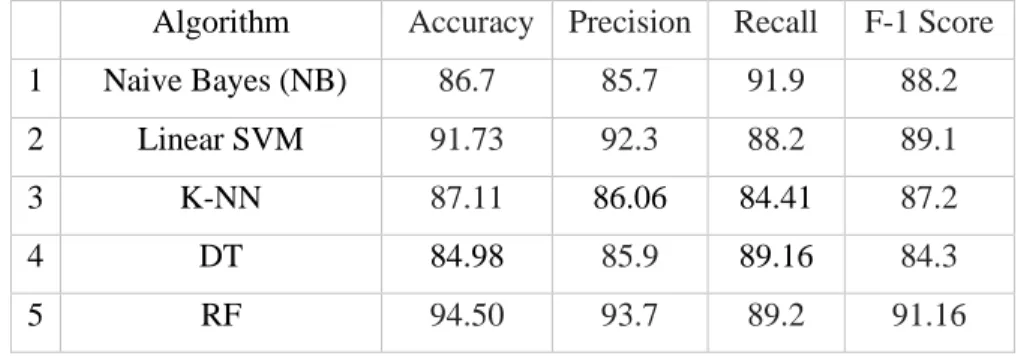
Thus, the similar conclusive approach as suggested in equation (24) can also be made for classifier performance based on selected feature subspace.
Discussion and Conclusions
In the same direction, the current literature on the detection of heart diseases was also surveyed and the weaknesses of the current solutions were identified. This thesis study used the heart disease dataset that is publicly available in the UCI machine learning repository. Thus, these two best performing classifiers proved to be promising classifiers for heart disease prediction.
Decision support system for heart disease based on support vector machine and artificial neural network. Hybrid recommendation system for heart disease diagnosis based on multiple kernel learning with adaptive neuro-fuzzy inference system. An efficient coronary heart disease risk prediction method based on two deep neural networks trained on well-ordered training datasets.
An optimally configured and improved deep belief network (OCI-DBN) approach for heart disease prediction based on Ruzzo-Tompa and stacked genetics.
![Figure 2: Summary of heart disease patients according to features-2 [32]](https://thumb-ap.123doks.com/thumbv2/azpdfco/10576064.0/31.702.98.605.86.529/figure-summary-heart-disease-patients-according-features-32.webp)