Inquiries about the use of the book should be directed to INTECHOPEN LIMITED rights and permissions department ([email protected]). The publisher accepts no responsibility for any damage or injury to persons or property resulting from the use of any materials, instructions, methods or ideas contained in the book.
Introduction
Are we serious?
Can we compromise?
Similarly, India and other developing countries are blindly following China to improve their economic performance without caring about the social and environmental issues faced by the Chinese people and government.
Conclusion and policy recommendations
Carbon dioxide (CO2) is an important material in many industries, but it also accounts for more than 80% of greenhouse gases (GHGs). In this context, we focused our research on the phase behavior of physical solvents for capturing carbon dioxide.
Experimental method and setup for measuring PE at HP
Our approach is quite predictive and we are interested in the global phase behavior of the systems, not only in the pressure composition diagrams, for example. Our approach is quite predictive and we are interested in the global phase behavior of the systems, not only in the pressure composition diagrams, for example.
Modeling
It can be easily noticed that a, b, c, d coefficients of the cubic GEOS equation are actually functions of the critical data (Tc, Pc and Vc), m and αc parameters. This is the meaning of the statement cubic "general equation of state" used for GEOS.
Phase diagrams
Also, in this type of diagram, at low temperatures there is a liquid-liquid critical curve, ending in another UCEP, in which a three-phase LLV equilibrium curve ends;. Type Vm - the critical curve is interrupted by a three-phase curve and has a maximum and a minimum in pressure.
Predicting the phase behavior of systems containing carbon dioxide of interest for CCS
Phase diagram predictions for the carbon dioxide +1-dodecanol binary system
Phase diagram predictions for carbon dioxide + different classes of substances at high-pressures
A unique set of binary interaction parameters tailored to the carbon dioxide +2-butanol system was used to predict the phase behavior of. This set of BIPs was then used to predict the phase behavior for the carbon dioxide + n-butane (black curve), + ethyl acetate (green curve), + 1,2-DME (pink curve), and + 1-butanol (olive curve).
Comparisons of phase behavior with different models
With the exception of the binary system carbon dioxide + n-butane, the critical curves are extremely well predicted for all mixtures. P–X1 and T-X1 projections of the carbon dioxide (1) + 2-butanol (2) critical curve predicted by the GEOS, SRK, and PR models.
Conclusions
33]Sima S, Feroiu V, Geană D: New high-pressure vapor-liquid equilibrium data and density predictions for the carbon dioxide + ethanol system. Phase Behavior for the Carbon Dioxide +2-Butanol System: Experimental Measurements and Modeling with Cubic Equations of State.
Storage of compressed CO2
Investment modeling of compressed CO2 storage from coal and biomass combustion
There are no CO2 capture facilities in the cement plant, but it was assumed during modeling that CO2 was present in the plant area.
Carbonation of flue gas at microwave column
Langmuir Crystallization model
Bentonite samples were activated with 1 and 2 M HCl solutions for 2 h at 90 °C using a batch (using 100 ml. However, the quantity and quality of water that the ecosystem will need is not addressed. Bentonite samples were activated with 1 and 2 M HCl solutions for 2 h at 90 °C using a batch (using 100 ml.
In addition, these samples were further dried at the same temperature for 1 h to remove weak chlorine species.
Results and discussion
Pressurized sequential carbonation by Fly ash compost
The microwave-activated shale and fly ash used in the experimental work were supplied from the district of Şırnak Province. For the first time, Ünye region bentonite 0.1 M 100 ml CaCl2 solutions were mixed in the beaker at room temperature for 24 hours. and the filtrate was converted to the ion exchange using the AgNO3 test. The microwave-activated shale and fly ash used in the experimental work were supplied from the district of Şırnak Province.
For the first time, Ünye region bentonite 0.1 M 100 ml CaCl2 solutions were mixed in the beaker at room temperature for 24 hours.
Conclusions
The establishment of the Carbon Market will ensure the definition of sectors and activities that will be included in the assessments. The rapid spread of COVID-19 has had far-reaching consequences on the daily lives of people in almost all parts of the world. All these incidents also changed the lifestyle of the entire world, similarly, the ongoing pandemic crises of Covid-19 will have a permanent and everlasting impact on our lives [1, 2].
In the recent era, especially at the beginning of the 21st century, two more premature pandemic crises hit several countries of the world.
Climate change: why it matter?
Among the three pillars of sustainable development, which are environmental, economic and social; the environment is considered one of the most important pillars of sustainable development. The concentration of harmful gases in the atmosphere increases the average temperature of the world, which has a negative effect on glaciers and the phenomenon of ice melting is increasing very rapidly. Moreover, the biggest responsibility rests on the shoulders of the business community, policy makers, world leaders and politicians.
One of the most destructive factors that arises in our society is that the rich get richer and the poor get poorer.
Nexus between Covid-19 and environment
Air pollution is one of the most significant catalyst factors that harm our environment. As due to the pandemic crises, most of the world's countries were in a lockdown situation from the beginning of the year. Total world production fell dramatically due to the shutdown and millions of people lost their jobs.
The significant decreases also observed in the pattern of total electricity consumption.
Conclusion and recommendations
We formulate this as a stochastic differential game (SDG) and analyze the stability of Stuckenberg, Nash, and cooperative equilibria through a feedback control strategy. We then adopt the marginal expectation and the variance of the improvement rate to determine the influence of the external environment on the decision maker. We design a stochastic differential game (SDG) to analyze the stability of Stackelberg, Nash, and cooperative equilibria through a feedback control strategy.
We then adopt marginal expectation and variance of the improvement rate to identify the influence of external environmental constraints on the decision maker.
Model setup
Production decisions of power plants with homogenous hybrid/enabling technology
Restricting ourselves to a symmetric two-person matched two-matrix game in a random competition in an evolutionary game with a population, we define the payoff (utility) in Table 1. Power and payoff are measured on a scale of utilities according to the power plant's preference ranking. Bi matrix for two power plants from different energy sources. the power plant is subject to its price and the price of its rival. Then, for each time period the power plant will consider the tariff quota or feed-in tariff and adopt a pricing strategy for the chosen energy source.
Power and the payout are measured on a utility scale that corresponds to the power plant's preference ranking.
Production decisions of power plants under endogenous hybrid/enabling technological advances
Let K tð Þ denote the evolution of the hybrid enabling technology at time t, due to R&D collaborative innovation system of Player I and Player II at time t. Letðα1ð Þt ,α2ð ÞtÞandðβ1ð Þt,β2ð Þt Þt shows the influence of the effort level hybrid-authorization technology on the total profit of Player I and player II, respectively, at time t, namely the marginal return coefficient of hybrid-authorization technology. To promote the hybrid enabling technology, Player II (leader) determines an optimal sharing effort level and an optimal subsidy.
Letðα1ð Þt,α2ð ÞtÞinðβ1ð Þt,β2ð ÞtÞdenote the impact of the hybrid technology enabling the level of effort on the total profit of player I and player II, respectively, at time t, namely the coefficient of marginal return of the technology enabling the hybrid.
A Stackelberg game under heterogeneous technology
The limit of expectation and variance
The payoff of player I and player II, according to the Stackelberg game paradigm, is related to the improvement rate of hybrid technology through Proposition 4. Rewriting limit of expectations and variance analysis under Stackelberg game equilibrium (Eq. The limit of expectation E K tð ð ÞÞ, and variance D K tð ð ÞÞ in the Stackelberg game feedback equilibrium must satisfy.
Nash non cooperative game
The limit of expectation and variance
Cooperative game
The limit of expectation and variance
The limit of expectation E K tð ð ÞÞ and variance D K tð ð ÞÞ in the Nash non-cooperative game feedback equilibrium must satisfy. where~μ1¼θβF½α1ðρ1þξÞþðΓþδβRβÞF�þθβðρ1þRξ½Þα2ðρ1þξÞþðΓþδÞ�and. μ2¼ð1�θÞβF½β1ðρ2þξÞþðΓþβRδβÞF�þðρð21�þξθÞÞβR½β2ðρ2þξÞþðΓþδÞ�: Poof of Theorem 8 is like the derivation of Theorem 6. 4 .1 The boundary of expectation and variance. The limit of expectation E K tð ð ÞÞ and variance D K tð ð ÞÞ in the Nash non-cooperative game feedback equilibrium must satisfy. where~μ1¼θβF½α1ðρ1þξÞþðΓþδβRβÞF�þθβðρ1þRξ½Þα2ðρ1þξÞþðΓþδÞ�and. μ2¼ð1�θÞβF½β1ðρ2þξÞþðΓþβRδβÞF�þðρð21�þξθÞÞβR½β2ðρ2þξÞþðΓþδÞ�: Puff of Theorem 8 is like the derivation of Theorem 6. Under the cooperative game paradigm, Player I and Player II will choose to work together/share their hybrid technology development knowledge while simultaneously sharing the payout feature to maximize their total payouts. If the above conditions are met, the feedback cooperative equilibria are defined as . 66) and the optimal cooperative payout function under hybrid technology on renewable resources and fossil fuels respectively.
Then the optimal revenue sharing function satisfies the following HJB equation ρVcð Þ ¼K max. f g≥0nhα1LRcð Þ þt α2LFc þβ1L~Rc þβ2~LFc þðΓþδÞKÞi.
Comparative analysis of equilibrium results
Concluding remarks
For any K≥0, under the condition that Player II pays an extra cost for sharing hybrid-enabling technology. Then the optimal partial payoff of hybrid enabling technology of Player I reaches higher than the optimal partial payoff under the condition that Player II does not provide extra costs. This implies that Vð ÞSIð ÞK ≥Vð ÞNIð Þ.K Similarly, the optimal partial payoff of hybrid enabling technology of Player II reaches higher than the optimal partial payoff under the condition that Player II does not provide extra costs, such that Vð ÞSIIð ÞK ≥Vð ÞNIIð Þ:K.
Thereby, this model allowed us to quantify the optimal level of subsidy for sharing the hybrid enabling technology.
Appendix
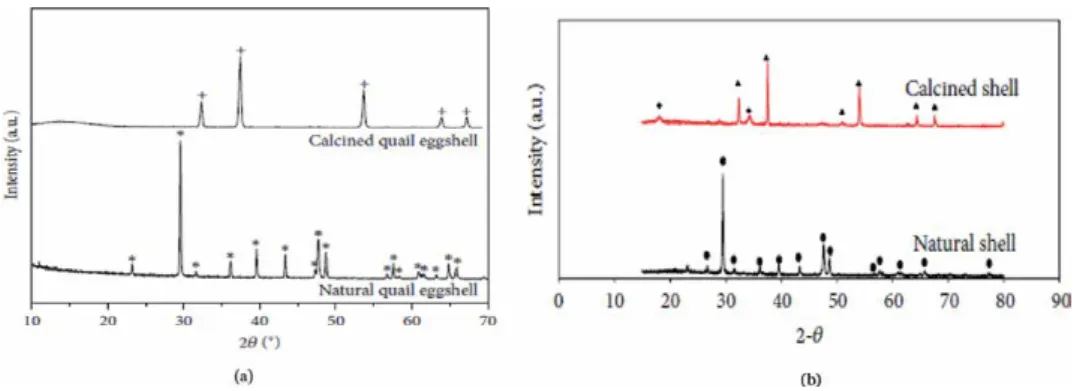
- Physicochemical properties of eggshell and seashells biomaterials The major solid mineral component of eggshells and seashells is calcium carbonate
- Methods of sorbent preparation
- Adsorbent performance
- Conclusion
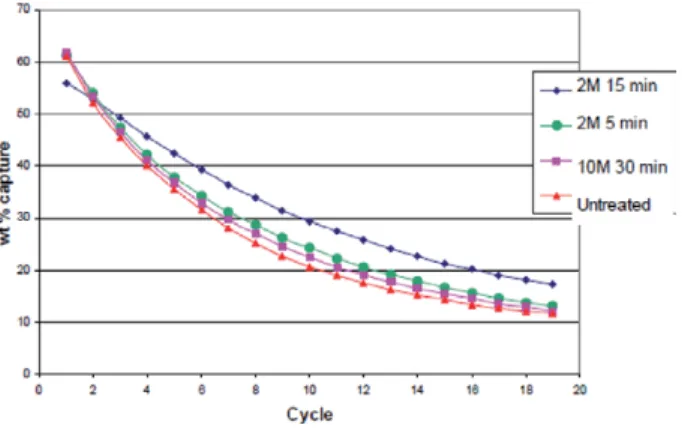
Pilot-scale demonstration of the concept has been reported for eggshell and oyster shell in the literature. In the work, they discovered that the pretreatment of the eggshell with acetic acid improved. This is in accordance with the result of the study reported by Sacia [17], on the use of eggshells for CO2 capture.
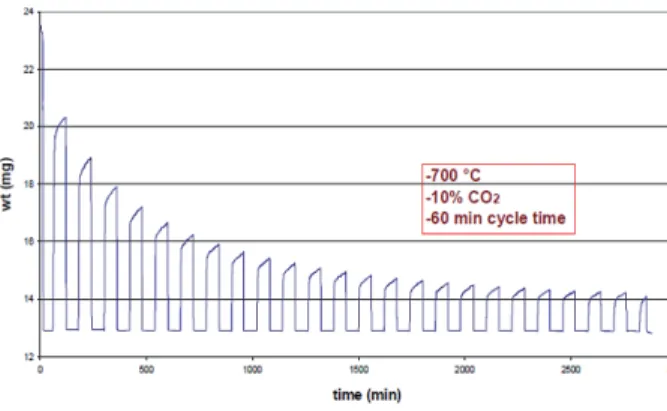
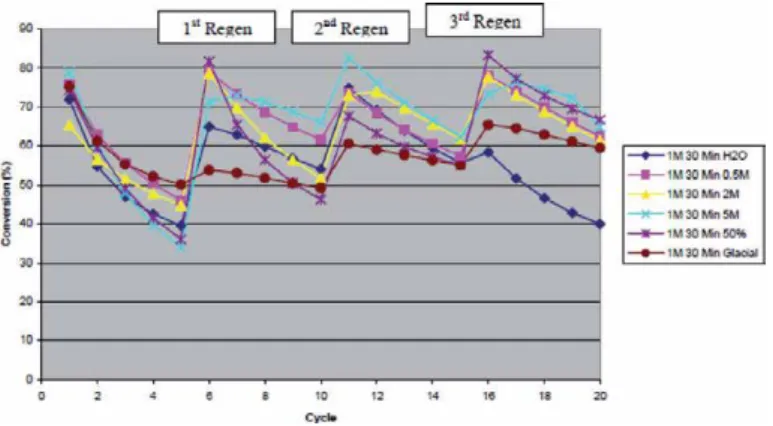
The effect of regeneration of the eggshell derived CaO sorbent on CO2 capture is shown in Figure 8.