Inquiries regarding the use of the book should be directed to INTECH's rights and permissions department ([email protected]). Various NDT techniques applied to the condition assessment of historic buildings are presented.
Remote Monitoring Technique for Evaluation of Corrosion on Reinforced Concrete Structures
- Introduction
- Introduction to the electrochemical techniques to assess the corrosive state on reinforced concrete
- Half-cell potential measuring on embedded reinforcements on concrete (open circuit) The corrosion potential is measured as the potential difference according to a reference
- Calculation of the corrosion rate using the linear polarization resistance method (LPR) Linear polarization resistance (LPR) is a non-destructive method designed to measure directly
- Remote monitoring technique for the evaluation of corrosion on reinforced concrete structures
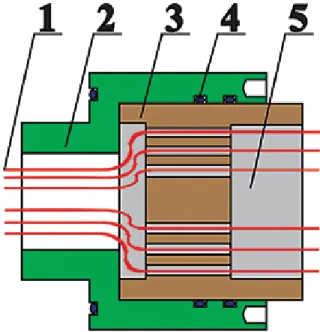
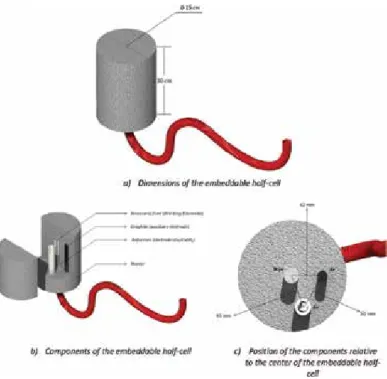
- Design of the embeddable cell
- Design of the control system
- Method to assess remotely the corrosive state of rebar
- Corrosion monitoring test on concrete specimen
- Conclusions
Calculation of the corrosion rate using the linear polarization resistance (LPR) method Linear polarization resistance (LPR) is a non-destructive method designed to directly measure Linear polarization resistance (LPR) is a non-destructive method designed to directly measure the polarization resistance (Rp) and indirectly the corrosion rate around the corrosion potential [3]. When the pores of the concrete are saturated due to the high concentration of CO2.
Acknowledgements
The test of linear polarization resistance was performed after 10 days as shown in Figure 11 in which the average value of the linear polarization resistance was 1.98 kΩ when used in Eq. Together with the values of the steel segment area, K, We, density and B (B is assumed to be 26 mV, since the corrosion conditions are active) yields a corrosion density of 0.309 and a corrosion rate of mmpy, which corresponds to a classification of corrosion as low/.
Author details
Through this study, the feasibility of implementing an embedded remote monitoring technology was verified for determining the corrosive state of reinforced concrete structures subject to the carbonation phenomenon following the regulations present in the ASTM C876 and ASTM G-102 standards. Such stability was determined by the given performance of the developed system against the commercial equipment used as a model, where the average error in the open circuit potential was 3.62% while the average error in the test for linear polarization resistance with respect to the calculations from the polarization resistance was 3.46%.
Diseño de un sistema de monitorización remota para la evaluación de la corrosión en estructuras de hormigón armado sometidas a ion cloruro. Comportamiento de una sonda basada en un electrodo de referencia de sulfato de cobre en un sistema de monitoreo de corrosión in situ desarrollado para estructuras de hormigón armado.
Mechanical Behavior Analysis and Testing of Marine Riser in Deepwater Drilling
Theory analysis of riser mechanical behaviour
- Mechanical model
- Load calculations 1. Tension force
- Model solution
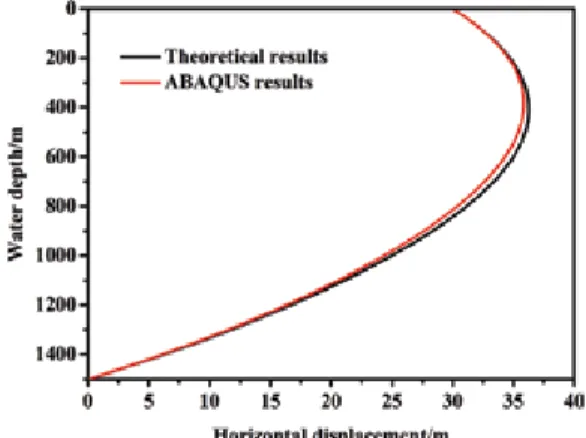
- Model validation
4 equations can be obtained according to equation 14 and finally all 6n equations are obtained. In other words, the 6n undetermined coefficients and the displacement of the riser system can be uniquely determined.
Experimental system
- System compositions
- System working principle
- System main functions
- System performance test
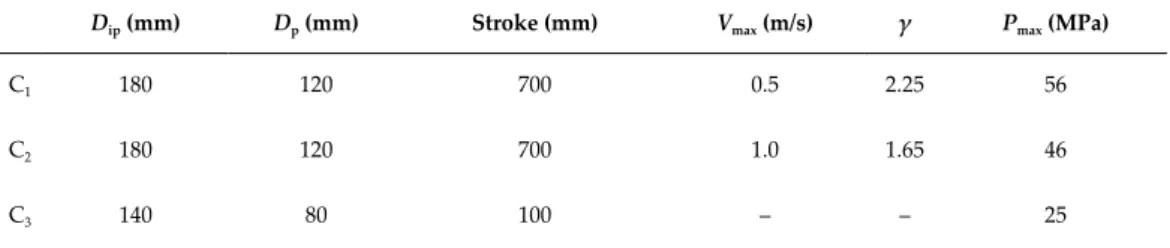
So, when the external pressure resistance tests are done in addition to the water pressure in the master cylinder, the water pressure must be pumped into the ring between the end tire and the axial piston to balance the axial force created by the water pressure in the master cylinder. So, when the internal pressure resistance tests are performed, the water pressure in the sample and the ring between the end tire and the axial piston must be pumped simultaneously and proportionally.
Simulation experiments
- Theoretical analysis
- Simulation experiment method
- Key problems
- Tubular sample
- Pressure loading scheme
- Strain gauges pasted scheme
- Pressure acquisition
- Strain acquisition
- Data analysis
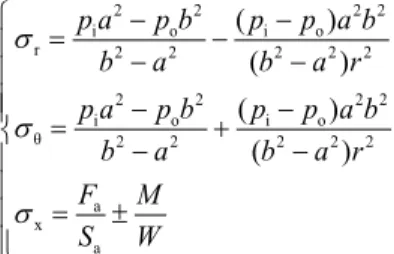
- Stress state analysis
The four-point bending method has been used in the simulation experiment, and the mechanical analysis model of the tubular specimen is shown in Figure 8 [8]. After analysis, the stress state of the experimental specimen during the eight stabilization phases is shown in Figure 16.
Conclusion
As shown in Figure 15, the maximum differences of the four measurement points on the three sections are 11, 17, 7 and 17 με. The measurement error is only 1.5%, which verifies the feasibility and validity of the simulation experiment method.
Plate-Like Structure Damage Acoustic Emission
Static analysis of deep-sea marine risers subjected to both axial and lateral forces during installation.
Beamforming Array Technique and Probability-Based Diagnostic Imaging Method
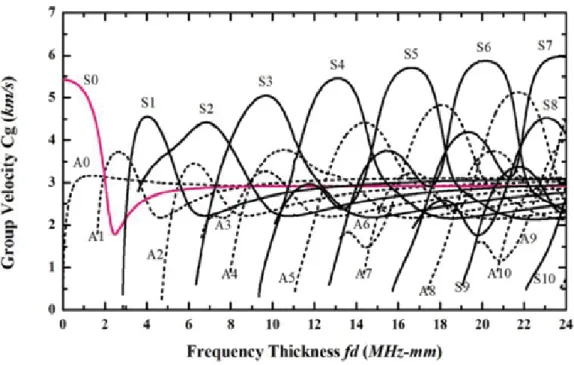
Principle of Lamb wave propagation
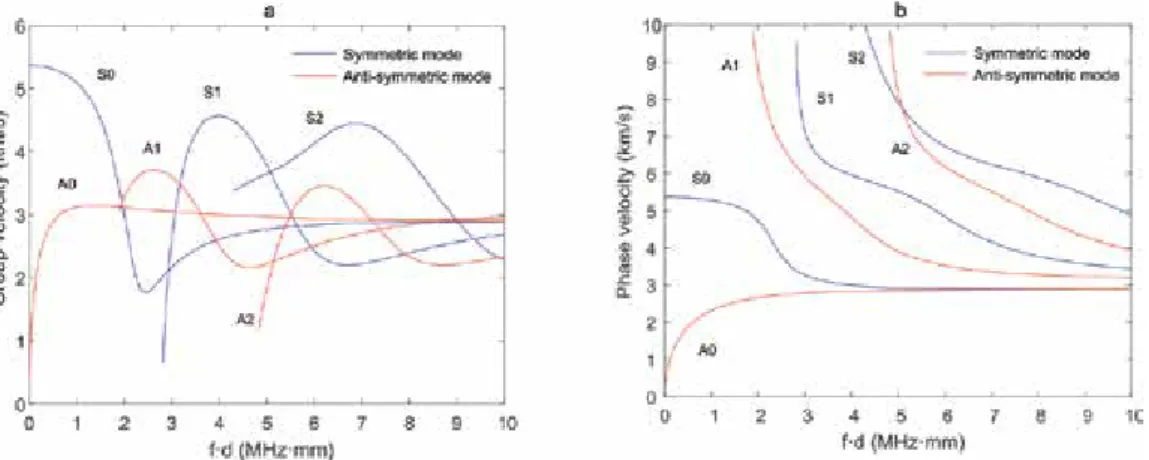
- The dispersion characteristic of Lamb wave
- Finite element simulation
When either of the dual PZTs is energized, the symmetric mode S0 and the antisymmetric mode A0 will be generated simultaneously. When the hole depth is through the thickness, the S0 scattering mode and the SH0 mode can be captured.
Beamforming algorithm for damage identification
- Principle of the beamforming network method
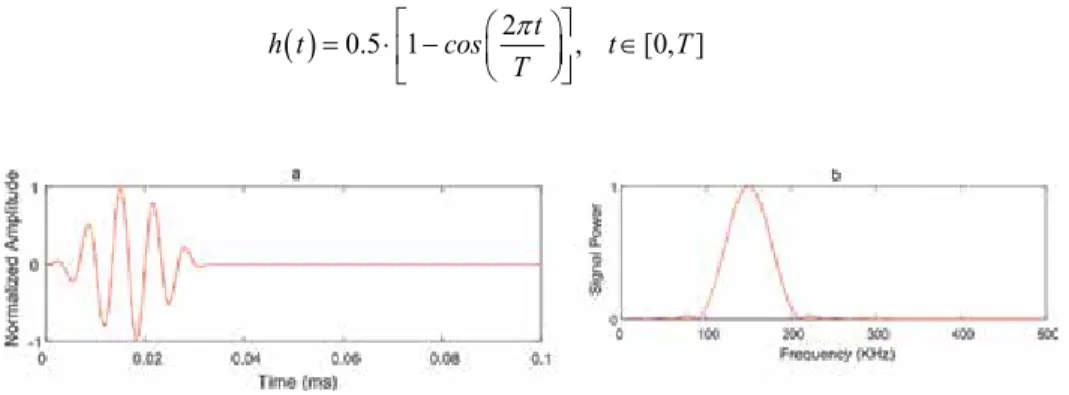
- Hilbert transform-based signal processing
- Probability-based diagnostic imaging
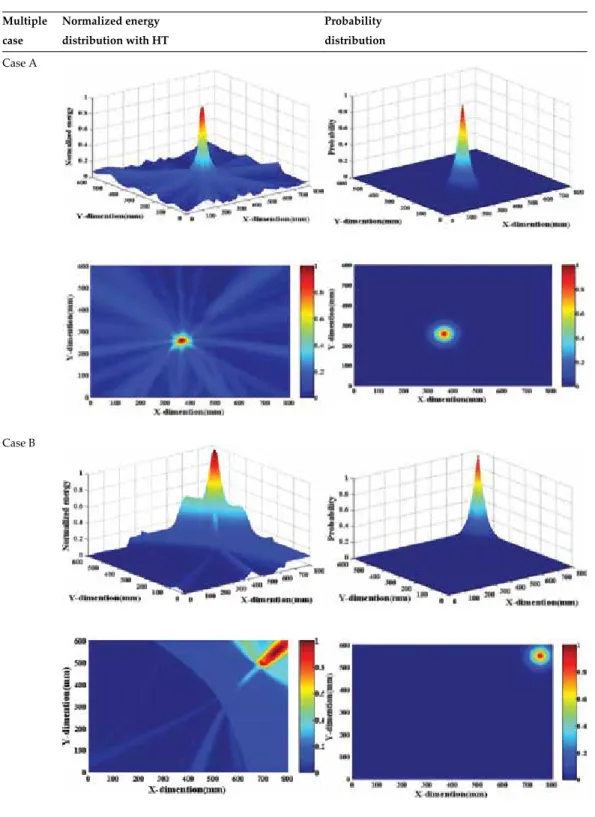
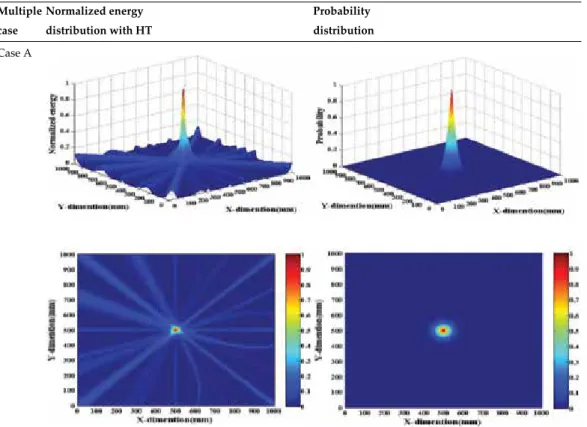
When the depth is 75% of the thickness, the S0 scattering mode, A0 mode and SH0 mode can be captured. In this study, the normalized energy distribution can be considered as the probability of the location of the AE source.
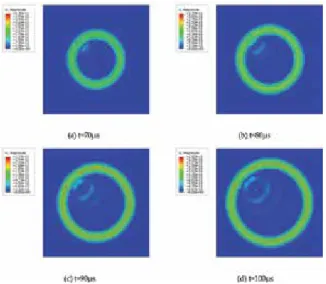
FE model of AE simulation
- Localization results of the numerical simulation
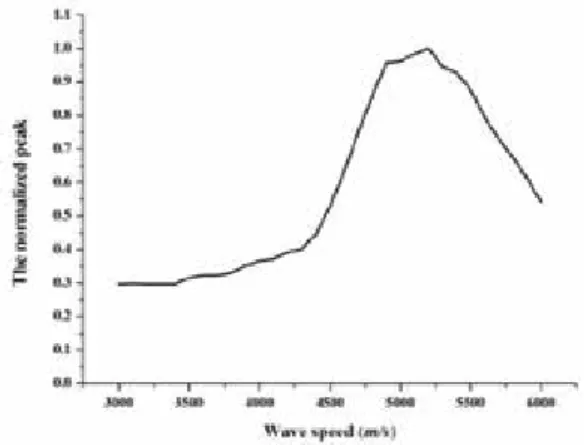
- The influence of the wave speed
The greater the deviation from the actual wave velocity, the greater the divergence of the energy;. The normalized energy peak curves of the FE model under different wave speeds are shown in Figure 15 .
Experimental verification
- Aluminum plate experiment
- Thin-walled steel cylinder experiment
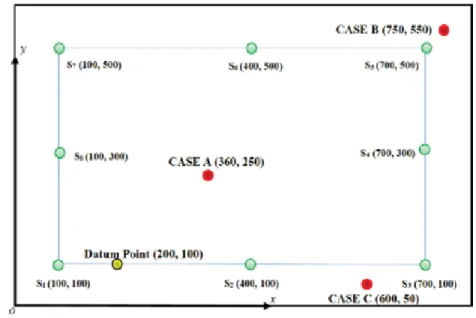
Multiple cases of source localization for aluminum plate based on beamforming method with rectangular sensor network with wave speed c =5200m/s. AE source position is designed at (90°, 350mm); according to the normalized peak energy curves of the 8 mm steel cylinder in Figure 19, the wave speed was 4900 m/s.
Conclusion
The AE source localization for thin-walled steel cylinder based on beamforming method with rectangular sensor network in wave velocity c = 4900 m/s. This study investigates localization of AE sources in plate-like structures using the beam-forming network method and probability-based diagnostic imaging. Through the beamforming network algorithm, the location information of the AE source is marked in one coordinate system as energy distribution.
Use of Guided Wave Thickness Resonance for
Monitoring Pipeline Wall Thinning Using an Internal PIG
Background
The choice of threshold value is usually application dependent and usually relies on a false positive probability estimate [14]. However, it is not an objective assessment, as the nature of the defects itself requires a more detailed interpretation. This process is effective in monitoring crack growth and shows a Probability of Detection (PoD) evaluation.
Numerical modelling analysis
- The stationary regime
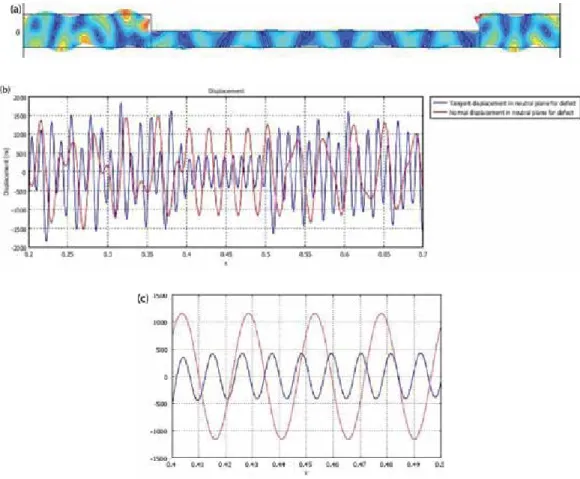
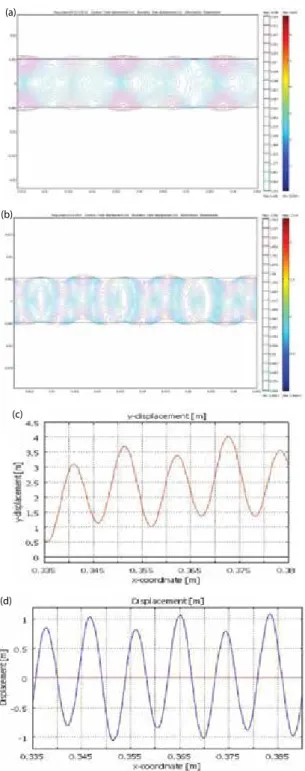
- Displacement visualisation of resonant frequency for plate with thickness change Localised thickness reduction was introduced along 10 cm length, 40 cm from the excited edge
- Generation of the S0 and A0 modes in the transient regime
- Mode identification 2DFFT
- Transient modelling of the S0 mode propagation
- Mode selection
Extrusion of the displacement in the plate before the excitation, f = 318.5 kHz, 5 mm notch thickness bounded by the white lines. Extrusion of the displacement into the plate for the symmetrical excitation at f = 318.5 kHz, 5 mm notch thickness. Extrusion of the displacement in the plate for the asymmetric excitation at f = 318,581 Hz, 5 mm notch thick.
Methodology
- Experimental setup
- Results
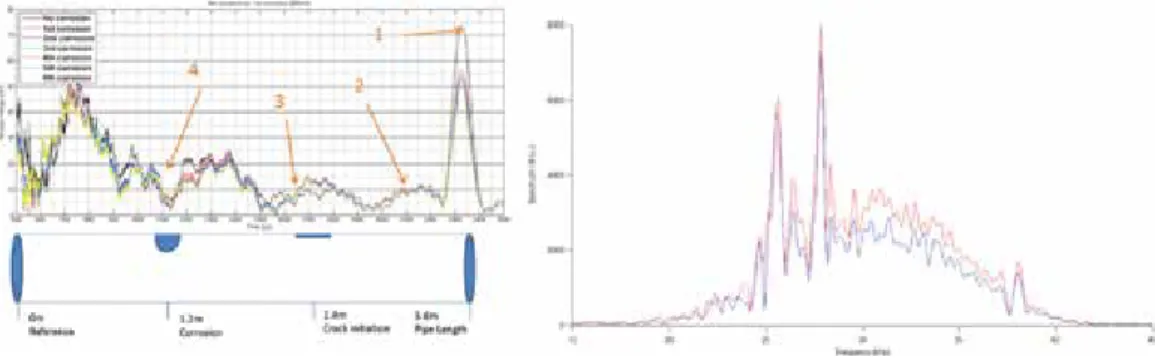
The end-of-pipe amplitude reflection is reduced due to the increase in thickness loss at the location of. In other areas of the A-scans, there are several significant changes in signal amplitude due to the loss of wall thickness. The additional presence of thickness loss on the outer wall of the tube results in a loss of energy in the received end-of-tube reflection.
Conclusions
These different areas are evaluated by analyzing the similarity of the signals at a given location. Figure 31(b) shows the correlation between each of the signals obtained in comparison with the error-free tube reference signal. The distance between two points in one dimension is simply the absolute value of the difference between their coordinates.
Application of Acoustic Emission Technique in the Monitoring of Masonry Structures
Quantitative analysis
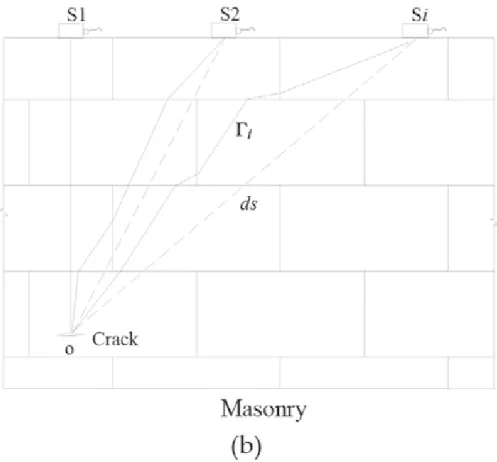
- Classical localization method
- Test set-up and velocity field modification
Before the tests, it is necessary to evaluate the mechanical properties of the bridge, such as the basic material (i.e. the masonry). Points in the third group are the rest of the points, far from the sensor network. In this group, approximately half of the breakage sources can be monitored based on the value c in Figure 10.
Qualitative analysis
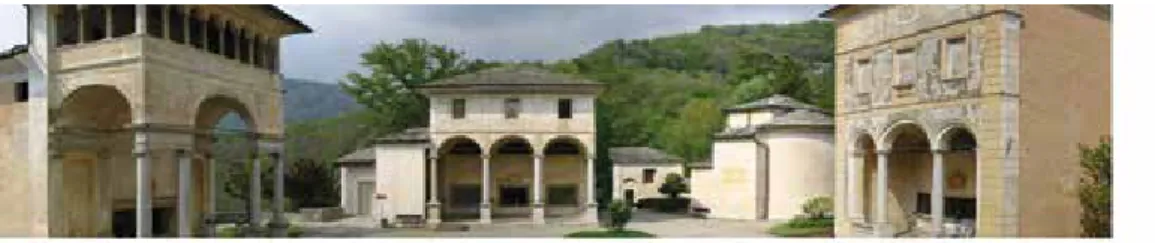
- Scenario of the monitored heritage chapel
- In-site monitoring by AE technique
- Results of the process based on the monitoring data
Interior view of Chapel XVII: (a) frescoes and (b) status of Peter and John Francis Peteras. On the other hand, some of the terracotta statues in the chapel were also analyzed (Figure 14). As shown in Figure 15b, the "Paraloid" here provides a good base for connecting AE sensors.
Discussion and conclusions
Based on the monitoring data, qualitative data analysis is mainly based on five techniques: cumulative event analysis, time dependence analysis, b-value analysis, frequency amplitude analysis and event occurrence rate analysis. Cumulative event analysis, time dependence analysis, b-value analysis, amplitude of frequency analysis, and event occurrence rate analysis were adopted to analyze the stability of the monitoring areas. Application of acoustic emission technique to assess damage in masonry under increasing and sustained axial load.
A NDT&E Methodology Based on Magnetic Representation for Surface Topography of
NDT&E methodology for surface topography
From a geometry perspective, surface topography is composed of a series of microconcave-shaped defects/features and bump-shaped defects/features. In this case, the corresponding surface topography can be inspected and therefore evaluated [28–45] by using magnetic sensors to directly induce the magnetic features with a certain lifting distance above the measured surface. Using the given inspection method, ferromagnetic material surface topography can be scanned and reflected by output signals; most importantly, the proposed inspection method is undef-.
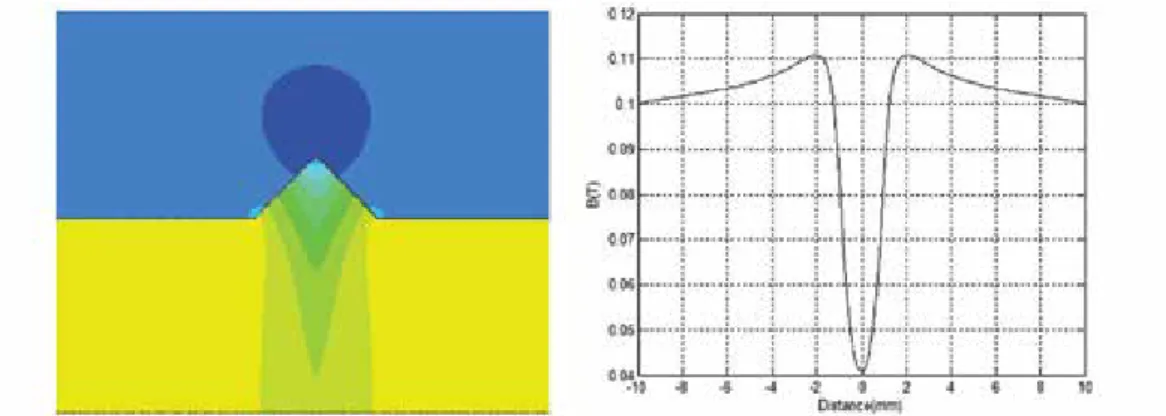
Simulations
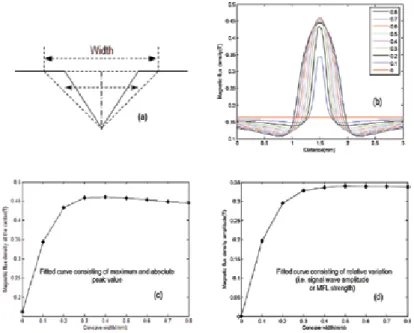
Detailed FEM results by varying the depth of the triangular "concave" defect separately. a) schematic model of concave depth in simulation; (b) MFL signals in different "concave" depths;. Detailed FEM results by varying the width of the triangular "concave" defect separately. a) schematic model of concave width in simulation; (b) MFL signals in different "concave" widths;. On the other hand, in Figure 6a, by changing the width of the triangular "concave" separately.
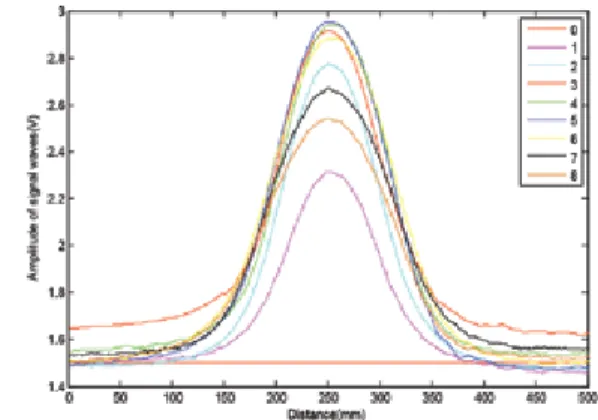
Experiments
After data processing, the maximum or absolute peak value and relative peak value of the signal wave in Figure 15b were obtained and shown in Figure 15c and 15d, respectively. After extracting the eigenvalues for the signal waveforms in Fig. 16b, the maximum or absolute peak value and the relative peak value of the signal waveform in Fig. 16b are obtained and displayed in Fig. 16c and 16d, respectively. mm with an increasing unit of 0.05 mm per step. After extracting the eigenvalues for the signal waveforms in Fig. 16b, the maximum or absolute peak value and the relative peak value of the signal waveform in Fig. 16b are obtained and displayed in Fig. 16c and 16d, respectively.
Application of Non-destructive Testing for
41] Amineh, R.K., Koziel, S., Nikolova, N.K., Bandler, J.W., Reilly, J.P.: A space mapping methodology for defect characterization from magnetic flux leakage measurements. Mukhopadhyay, "Inverse Magnetic Flux Leakage Signal Mapping for Defect Characterization," NDT & E International, vol Rebello, "Development of a Magnetic Sensor for Detecting and Sizing Internal Pipeline Corrosion Flaws," NDT & E International, vol.
Measurement of Partial Discharges in Oil Insulation Systems
The experimental part
The studies included measurements performed at different distances from the sensor to the PD generation area. Analysis of the results showed no UV radiation outside the tank; therefore, this analysis is not included in this chapter. Analysis of the results did not reveal any high-energy radiation outside the tank, so this analysis is not included in this chapter.
Analysis of measurement results
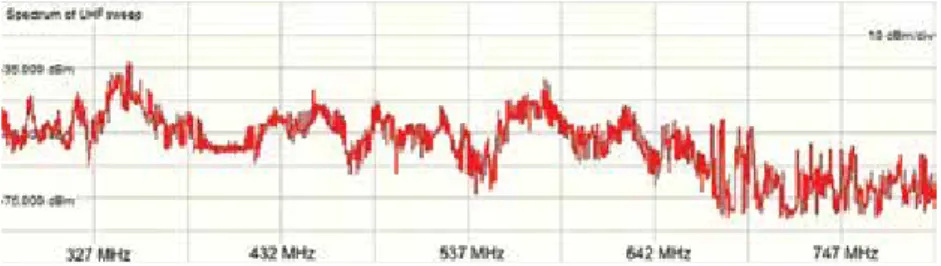
- Results of analysis obtained using the electrical and UHF methods
- Results of analysis obtained using the spectrophotometry method 1. Results related to the needle-needle system
- Results of analysis obtained using the acoustic emission method
- Results of analysis obtained using the thermal imaging
- Results of analysis obtained using the chromatography method
Integral calculated for intensity spectra in the function of the PD generation voltage, while the sensor is installed at a distance equal to 8 mm. Integral calculated for intensity spectra in the function of the PD generation voltage, while the sensor is installed at a distance equal to 5 mm. Integral calculated for intensity spectra in the function of the PD excitation voltage, while the sensor is installed at a distance equal to 4 mm.
Summary
The analysis of the optical spectra, recorded during PD generation at different voltage levels and distances in the NN and NNB systems, resulted in the statement that there is no significant influence of the voltage value on the recorded intensities. This was confirmed by plotting the maximum intensities, determined from the recorded spectrum, as a function of the PD generation voltage. The analysis of the optical spectra, recorded during PD generation at different voltage levels and distances in the SURF system, resulted in the statement that there is a clear dependence.
Non-Destructive Techniques Applied to Monumental Stone Conservation
Geometrical information and mapping
- Observation and mapping
- Three-dimensional models
- Digital image analysis
- Measurements of stress and strain
16], photogrammetry is used to monitor the development of a crack in the masonry of the Basilica da Ascensión in Galicia (Spain). They applied this technique to the conservation study of the Chapel of Falla, located in the crypt of the Cadiz Cathedral (Spain). A description of the SOFO system can be found in the study by Inaudi et al.
Physical properties
- Water absorption
- Permeability
- Humidity/water content
- Surface cohesion
- Surface hardness
- Color
Peel resistance is calculated from the force and area of the tape. Surface hardness is another property that is usually taken into account when determining the degree of preservation of building materials. Munsell's system has three dimensions: HUE, which is the general name for color (red, green, and yellow).
Methods adapted from field geophysics
- Infrared thermography
- Acoustic, sonic and ultrasonic methods
In this case, a ball hits the surface with a fixed energy and the speed of the ball as it bounces is recorded. There are different types of Equotip equipment depending on the nature of the ball (tungsten carbide, ceramic and polished diamond), its size (2.8, 3 and 5 mm) and the impact energy (3, 11 and 90 Nm). The signal that reaches the camera depends on the emissivity of the material (the capacity of the material to emit energy), the color of the surface, the reflection.
![Figure 7. Polarization resistance of embeddable half-cell prior to set it into the structure [3].](https://thumb-ap.123doks.com/thumbv2/1libvncom/9200958.0/20.765.182.581.427.751/figure-polarization-resistance-embeddable-half-cell-prior-structure.webp)