This thesis is submitted in partial fulfillment of the requirements for the degree of Master of Science in Electrical Engineering. For pre-processing, the proposed approach in this thesis uses histogram equalization which helps to improve the contrast of the image, making the tumor stand out from its surroundings and making it easier for the segmentation step. I would like to thank the chairman and all members of the Department of Electrical Engineering at the University of the United Arab Emirates for assisting me throughout my studies and research.
Introduction
Literature Review
Further,. the rate of ANN-based cancer diagnosis performance is determined by key parameters, such as: a) selection of features, b) algorithms used for learning, c) number if hidden layers, d) nodes used in each hidden layer, and e) weights of the factors initiated for optimization. The segmentation model is used to separate only the tumor from the rest of the ultrasound image. Its value varies between 0 and 1. The closer the value is to one, the better the performance of the classification model.
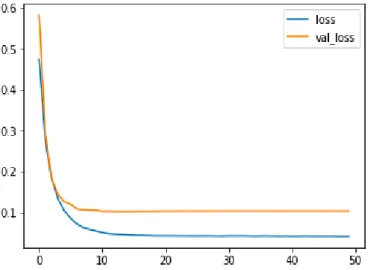
Figure 13 shows the model's F1 score during classification versus the number of epochs. Paper presented at the 2017 39th Annual International Conference of the IEEE Engineering in Medicine and Biology Society (EMBC). Paper presented at the 2008 30th Annual International Conference of the IEEE Engineering in Medicine and Biology Society.
Paper presented at the 2014 36th Annual International Conference of the IEEE Engineering in Medicine and Biology Society. Paper presented at the 30th annual international conference of the IEEE engineering in medicine and biology society in 2008.
Material and Methods
Dataset
Not only should an automated identification technique be able to match a disease with one of the known cases, but it should also be able to reject diseases that were not part of the training set. This is because collecting a real-life event and then visualizing it in a lab or in the field takes a lot of time and work. As a result, sufficient training data encompassing all features and changes in breast cancer are required for a realistic case categorization.
Pictures should be shot in a natural environment as well as with complex backgrounds, in various lighting situations and at different times of day to cover all the bases. For example, the examples of breast mammography images include the Mini-MIAS dataset (Mohan et al., 2020) which has 208 normal images, 62 benign images and 52 malignant cancer images. Deep learning algorithms are therefore applied to classify digitized mammograms, as obtained from DDSM (Digital Database for Screening Mammography), which contains 2620 patients and includes mediolateral oblique and craniocaudal images (Araújo et al., 2017).
Other examples include Image Retrieval in Medical Application (IRMA), which has 736 biopsies that have lesions in 344 patients and includes mediolateral oblique and craniocaudal images (Aswathy & Jagannath, 2017), INbreast with 419 cases for detection and diagnosis, including the mediolateral oblique. and craniocaudal images of 115 patients (Li et al., 2018), the Breast Cancer Digital Repository (BCDR) with 322 digitized mediolateral oblique images of 161 patients for classification (Yousefi, Ting, Mirhassani, & Hosseini, 2013). Diagnostic Breast Cancer (WDBC)," which is available in the UCI machine learning repository (Fan, Upadhye, & Worster, 2006).
Pre-processing
Image Features
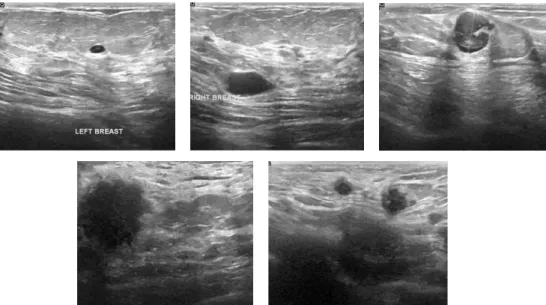
Thus, the prediction model itself learns to distinguish between malignant tumors and benign cysts, possibly from their different sizes and shapes.
Feature Selection
The dimension of feature vectors is significant throughout the classification process as it affects the classifier's performance. First, it improves the classifier's accuracy, and second, it reduces the machine learning algorithm's computation time due to feature selection (Sarkar & Leong, 2000). The recursive feature selection (REF) is another algorithm for feature selection, which fits a model by removing irrelevant ones until the desired amount of features is obtained.
In the case of predictions using the ultrasound image, the approach can firstly isolate the tumor from the image by creating the mask, which is done by the segmentation model. The mask is then passed as input to the classification model to identify the tumor as benign or malignant. Consequently, any new mask passed to the classification model is classified as benign or malignant according to training.
As a result, the possible features that the model finds are when the model compares the size and shape of the tumor. It selects the pixels that make up the tumor and colors them white, while all other pixels are black.
Training
The other qualities are the ones that have the most impact on the target group. The feature elimination approach working recursively calculates performance measures such as specificity, sensitivity, accuracy and F1 score by training the SVM model on the training dataset (Medjahed, Saadi, & Benyettou, 2013).
Classification
ResNet50 is one of the models presented by the Microsoft research team in residual learning for image recognition (Shin et al., 2016). This basic but beautiful concept takes a traditional convolutional neural network and adds shortcut connections that bypass several convolutional layers. The output of the convolutional layers is added to the input of the remaining blocks created by the shortcut links.
There are two types of such modules, one with four convolutional layers and the other with three, and each convolutional layer is followed by normalization. To perform classification, ResNet50 is used as the basic model with an attached neural network with convolutional layers. During training, the target dataset for the model is used regardless of whether the mask learns benign or malignant.
When the trained model is used on the dataset by initializing it with the pre-trained weights, it prompts the model to adapt its image classification techniques to suit our work. It uses softmax in the activation of the output layer that gives the probability that the mask belongs to a benign or malignant class, where the one with the highest probability is selected as a result.
Evaluation Metrics
The former algorithm makes gradient descent converge faster by taking 'exponentially weighted average' of the gradients. The true positive is the number of good (safe and manageable) detections found by the algorithm. The amount of no-good detection that is falsely identified as excellent detection by the algorithm and the number of good detections that are overlooked by the system are known as false positives and false negatives, respectively.
Specificity: This is the ratio of the recently classified healthy people to the total number of healthy people. Precision: Precision is the ratio of the actual positive count to the positive count predicted by the classification model, and can be calculated by the following formula: It is a function that gives the probability that the image belongs to one of the two classes.
For example, the greater the AUC value, the greater the performance of the classification algorithm. The Receiver Operating Characteristic (ROC) curve consists of the true positive rate (TP) as the y-axis and the false positive rate (FP) as the x-axis with the area under the ROC curve calculated to indicate the performance of the classifier.
Proposed Approach
Dataset: The dataset used in this research is ImageNet - a dataset that has 100,000+ images across 200 different classes. Pre-processing: To remove the noise from the image, Gaussian blurring and histogram smoothing were used. Histogram equalization helps improve contrast in the image by spreading frequency intensity values.
It can be modified depending on the performance of the model, in order to achieve maximum accuracy. The first model is Resnet101, which is a 101-layer convolutional neural network (CNN) that can be used as a more advanced classification model. It builds the grid by stacking leftover blocks on top of each other and can span multiple layers.
The Resnet101 model used in the segmentation model was imported from the Keras library and pre-trained on the ImageNet dataset. This model was imported from the segmentation model library and pre-trained on the ImageNet dataset.
Experimental Results
- Pre-processing
- Experimental Platform
- Segmentation Results
- Classification Results
So, for each model that was tried, it had to run through the specific preprocessing module that came with the model. The model imported from the library has already been pre-trained on the ImageNet dataset with the corresponding weights initialized accordingly. Figure 7 displays recall model and shows tracking of the recall function as monotonically increasing as the model trains.
The blue line tracks F1 score of the model at each epoch during training data, while orange line tracks the same but during validation. Figure 11 shows the tracking of the accuracy associated with classification as monotonically increasing as the model trains. Likewise, figure 12 displays the recall model of classification, and shows the detection of the recall function as monotonically increasing as the model trains.
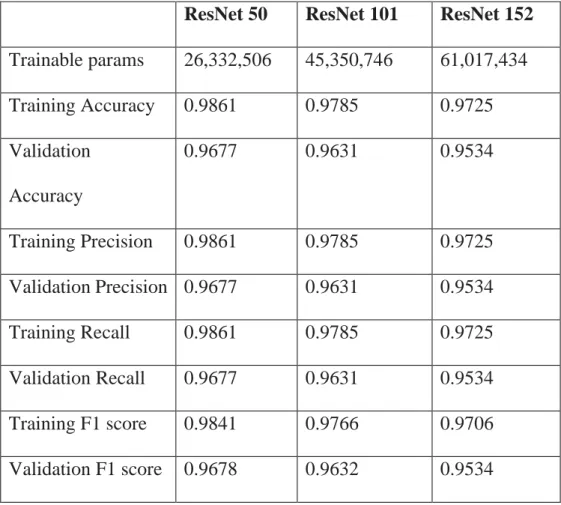
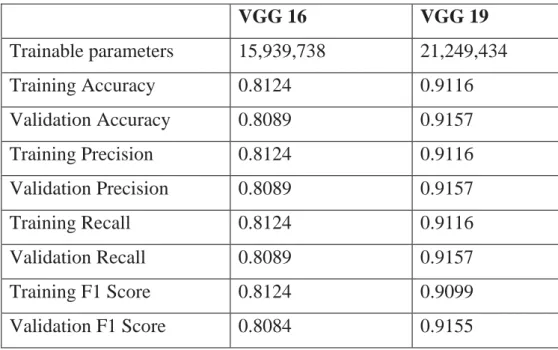
Typically, models perform worse during validation than during training, as the model becomes familiar with the data during training. The model that performed best in mask classification in our case was ResNet50 with the best metric values among the eight models we used. MobileNet_V2 is based on the MobileNet architecture with a hop connection in each module of the model.
However, MobileNet_V2's extremely poor performance in validation may be due to overfitting of the model.
Discussion and Conclusions
Model building in breast cancer survival analysis using support vector machine, logistic regression and decision tree. Paper presented at the 2018 15th International Computer Conference on Active Wavelet Media Technology and Information Processing (ICCWMTIP). Artificial intelligence-based mitosis detection in breast cancer histopathology images using faster R-CNN and deep CNN.
A fuzzy-rough nearest neighbor classification combined with consistency-based subgroup evaluation and instance selection for automated diagnosis of breast cancer. Improving the performance of machine learning classifiers for breast cancer diagnosis based on feature selection. Breast cancer diagnosis in digital mammography images using automatic region-of-interest detection.
A multimodal deep neural network for predicting human breast cancer prognosis by integrating multidimensional data. Integrating feature selection and feature extraction methods with deep learning to predict breast cancer clinical outcomes.