Comparative analysis: The impact of financial sector development on economic growth in the non-oil sector. The purpose of this paper is to examine the relationship between financial sector development and economic growth in the non-oil sector in Saudi Arabia. The relationship between economic growth and financial development has been widely discussed in the literature.
In addition, numerous studies have examined the relationship between financial development and economic growth in Asia. It is important to know whether there is a relationship between the economic growth of the non-oil sector and financial development. The MGDP2 indicator is used to assess the effect of financial development on economic growth.
Thus, the relationship between MGDP2 and the economic growth of the non-oil sector should be positive. The MGDP3 indicator is used to assess the impact of financial development on economic growth. Theoretically, the relationship between MGDP3 and the economic growth of the non-oil sector is expected to be positive.
Thus, the relationship between KPT and the economic growth of the non-oil sector is expected to be positive.
Unit Root
Thus, the expected effect of these indicators on economic growth should be positive. In the first step, we estimate the bound test on Equation 2 to test the long-run relationship using ordinary least squares (OLS). Perform an F-test to test the long-run relationship between the variables in Equation 2.
After performing this test, we compared the calculated F statistic with the critical values given by Narayan5 (2005). Pesaran and Pesaran (1997) showed that if the calculated F-statistic is above the upper bound of the critical value variables, either I (1) or I (0) or a combination of both, then we should reject the null hypothesis . , accept the alternative hypothesis and conclude that there is cointegration (a long-run relationship) between the variables. Pesaran and Pesaran (1997) showed that if the calculated F statistic is below the lower bound of the critical value variables, either I (1) or I (0) or a combination of the two, then we should.
5 Narayan's (2005) critical values are more reliable than Pesaran's (2001) critical values when the sample is small. Furthermore, Pesaran and Pesaran (1997) stated that if the calculated F-statistic is between the lower and upper limits of the critical values, then the limit test is inconclusive and cannot be determined. When there is a long-run relationship between the variables, we need to examine whether there is also a short-run relationship between the variables using the error correction model (ECM) framework as shown in Equation 2.
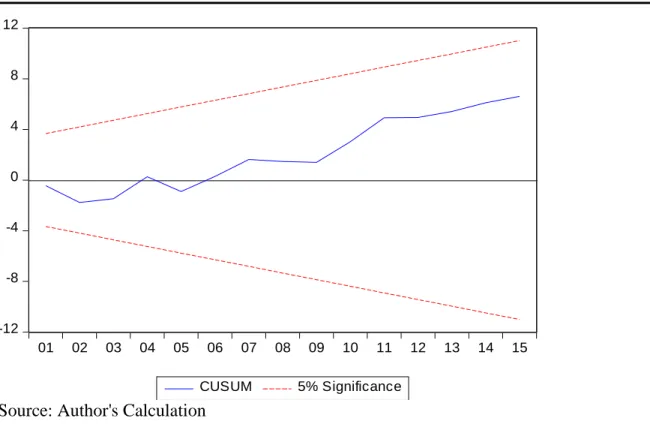
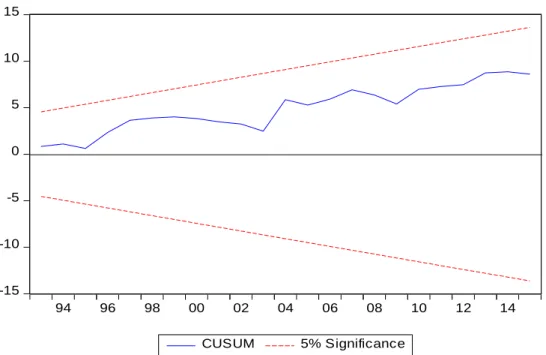
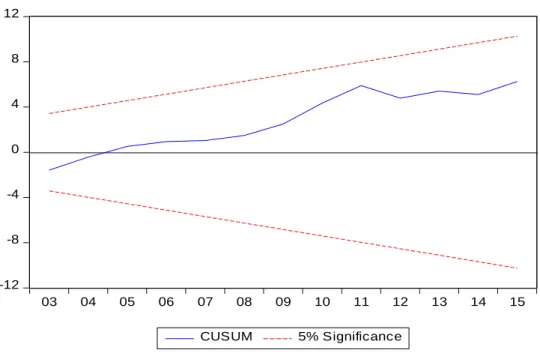
This test is known as a cumulative sum of recursive residuals (CUSUM) and a cumulative sum of squares of recursive residuals (CUSUMSQ). If the CUSUM and CUSUMSQ statistics lie between the lower and upper critical bounds at the five percent significance level, then the null hypotheses of all coefficients in the given regression are stable. Finally, this proposed theoretical model contributes to the economic growth literature by incorporating several important significant independent variables into a comprehensive, economic model.
In addition, this study avoids some common weaknesses in the research literature, including a heavy reliance on an estimated or unofficial data source. Moreover, the reliance on narrow indicators and/or some financial indicators, which may lead researchers to draw inaccurate conclusions and lead to biased results.
Data Analysis
Chart Analysis
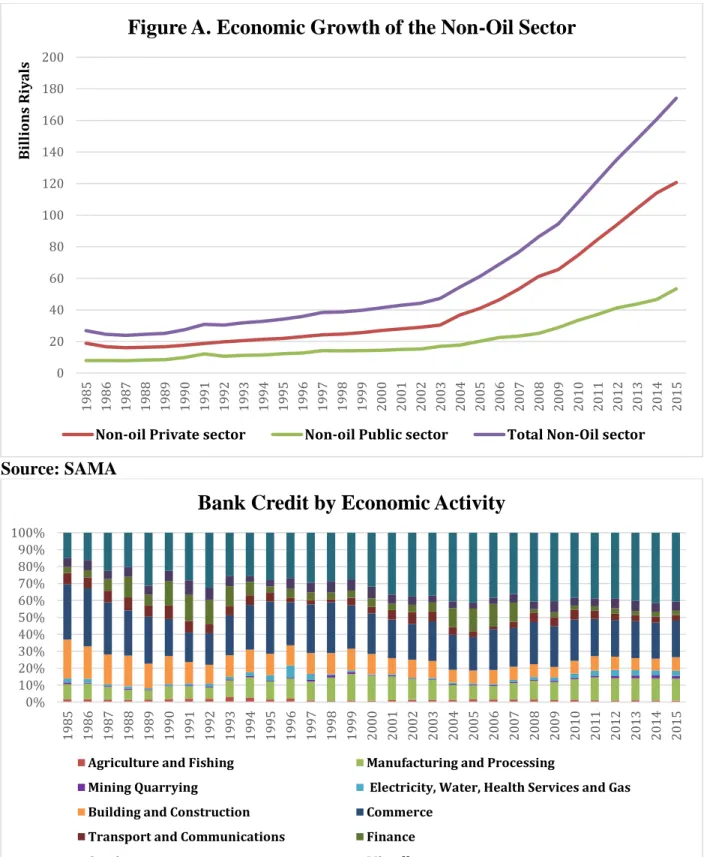
This section provides an overview of how the financial sectors have developed in Saudi Arabia, particularly during the last 10 years after the oil price rise, which led Saudi Arabia to make massive investments, thereby boosting the financial sectors. It turns out that between 2002 and 2015, the stock exchange sector grew much faster than the banking sector.
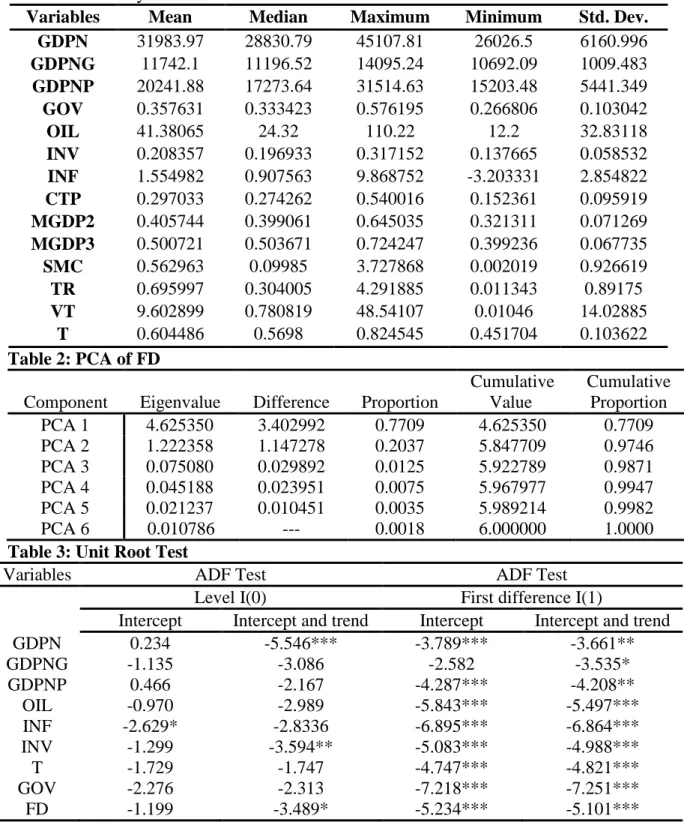
Principal component analysis (PCA)
The eigenvalue of FD associated with PCA1 is 4.6; thus it is significantly greater than one. PCA1 explains about 77 percent of the standardized variance; PCA2 explains a further 20.4 percent, and PCA 3 accounts for only 1.3 percent. Remarkably, PCA1 explains the variations in economic growth better than any of the other linear combinations of explanatory variables; thus, it is the most accurate measure of economic development in this study.
Empirical Results
- Unit root test
- Cointergration Test, Long-term Impact, and Short-term Impact for total Non-oil GDP
- Cointergration Test, Long-term Impact and Short-term Impact for the Non-oil GDP of the Private Sector
- Cointergration Test, Long-term Impact and Short-term Impact for the Non-oil GDP of the Public Sector
- Error Correction Model (ECM), Short-term Impact for the Total Non-oil GDP, Non-oil GDP Private Sector and Non-oil GDP Public
- Diagnostic test
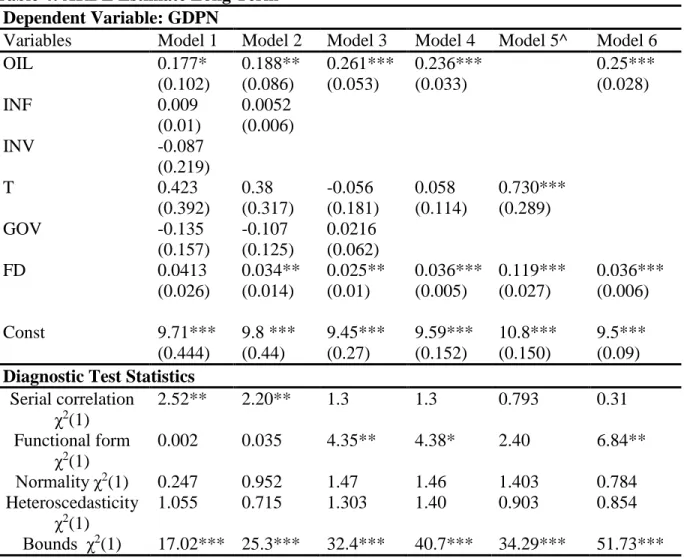
Oil prices, trade openness and financial sector development are the only significant variables of total private sector non-oil GDP. For total non-oil GDP, two models6 are estimated to determine which model best predicted total non-oil GDP. Ceteris paribus, a 10 percent increase in trade openness increases total non-oil GDP by an average of 7.3 percent in the long run, while a 10 percent increase in financial development increases total non-oil GDP by an average of 1.2 percent. in the long run.
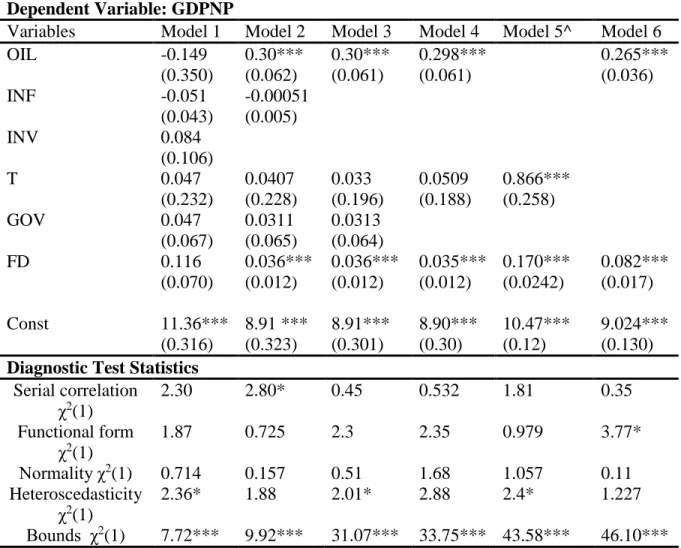
The magnitude of the effect of development in the financial sector is very small; this is plausible because financial development grows more slowly in an oil-based economy than in a non-oil-based economy7. 6Trade openness and financial development are regressed against total non-oil GDP on model 5, for model 6 oil prices and financial development are regressed against total non-oil GDP. Ceteris paribus, a 10 percent increase in trade openness, a non-oil GDP of the private sector increases by 8.7 percent on average in the long run, while a 10 percent increase in financial development, a non-oil Private sector GDP rises by an average of 1.7 percent in the long run.
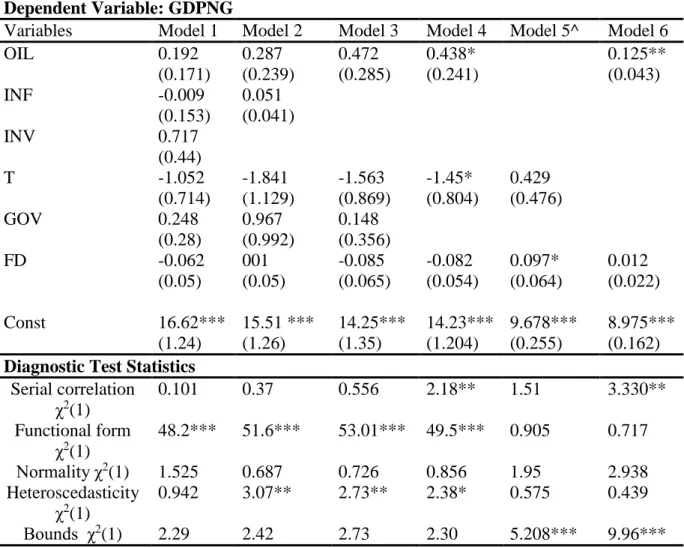
The size of the effect of the development of the financial sector is very small but larger than total GDP excluding oil; 8 Trade openness and financial development are plotted against private sector GDP excluding oil for model 5, while for model 6 oil prices and financial development are plotted against private sector GDP excluding oil. Two models9 are estimated to determine which model best predicted public sector GDP excluding oil, as shown in Table 8.
Ceteris paribus, a 10 percent increase in trade openness, private sector non-oil GDP increases 4.3 percent on average over the long term, while a 10 percent increase in financial development, non-oil GDP of the private sector will increase by an average of 0.97 percent over the long term. Financial development has the least impact on the non-oil public sector of all other forms of economic growth of the non-oil sector in this study. 9 Trade openness and financial development are plotted against public sector GDP excluding oil for model 5, while model 6 plots oil prices and financial development against public sector GDP excluding oil.
The coefficients of ECMt-1 have a negative sign, as expected under the alternative hypothesis, and are significant at the 1 percent significance level for total GDP excluding oil, the private sector excluding GDP excluding oil, and the public sector excluding GDP excluding oil. oil, as shown in Tables 5, 7 and 9 respectively. This confirms the long-term relationship between total GDP excluding oil, the private sector excluding GDP excluding oil, and the public sector excluding GDP excluding oil. The coefficients of ECMt-1 are and -0.097, indicating that the speed of the adjustment process is 13 percent, 11.4 percent, and 9.7 percent of the imbalances in total GDP excluding oil, private sector excluding GDP excluding oil, and The GDP growth in the public sector from last year's shock, respectively, is adjusted back to the long-term equilibrium in the current year.
Conclusion & Policy Implications
This study supports the Saudi Vision 2030, proposed by Deputy Crown Prize and Defense Minister Mohammad Bin Salman. The findings of this study are vital as they can inform policy decisions about financial development in Saudi Arabia, which can develop specific models to drive growth in the non-oil sector. In fact, it can be examined by compiling two indices: one for the banking sector and one for the stock market.
In addition, future research should use panel data on oil exporting countries because a panel approach estimation would provide more precise estimates of variable coefficients than is possible with the currently implemented ARDL approach. Financial Development and Economic Growth in the UAE: Empirical Assessment Using ARDL Approach to Cointegration." International Journal of Economics and Finance Vol. 34;Bounds testing approach to cointegration: A study of the impact of foreign direct investment and trade on growth in Saudi Arabia Journal of Economics and International Finance 6, no.